Team:NYMU-Taipei/safety

From 2014.igem.org

(Difference between revisions)
 
(20 intermediate revisions not shown)
Line 4: Line 4:
       <h>Safety</h>
       <h>Safety</h>
<div class='article safety indent'>
-
       
+
   
-
 
+
         <h1>Biosafety</h1>
         <h1>Biosafety</h1>
           <h3>Organisms We Used</h3>
           <h3>Organisms We Used</h3>
Line 25: Line 24:
<h3>Experiments</h3>
<p>Six plates of biosafety <i>E. coli</i> was cultured in individual 10 microliter LB.
-
Two in a group one test one control. Therefore, we have three groups of data (6 Control / 6 Test ) , (12 Control / 12 Test ) , (24 Control / 24 Test ) All six of them are covered with Aluminum foil, in order to isolate blue light disturbance. </p>
+
Two in a group one test one control. Therefore, we have three groups of data (6 Control / 6 Test ) , (12 Control / 12 Test ) , (24 Control / 24 Test ) All six of them are covered with Aluminum foil, in order to isolate blue light disturbance.We culture our <i>E. coli</i> in an incubator with shaker and light bulb to provide favored environment.</p>
-
 
+
<div style='display: inline-block;'><img class='bdframe' src='/wiki/images/1/13/NYMU14_biosafety_6plate_3_control_3_test.jpg' style='width: 400px;'><p style='display: block;margin: 0 auto;font-size: 14px;width: 400px;'>Figure 1. 6 plate of 3 Test,3 Control</p></div>
-
<p>After the culture reaches 6, 12 and 24 hour, we open the aluminum foli of the test group. We plotted the surviving cell number over blue light exposure time by doing CFU (colony Forming Unit), and hence we derive a surviving ratio over light exposure time. </p>
+
<div style='display: inline-block;position: absolute;margin-left: 20px;'><img class='bdframe' src='/wiki/images/5/5a/NYMU14_biosafety_incubator_with_shaker_and_light_bulb.jpg' style='width:400px;'><p style='display: block;margin: 0 auto;font-size: 14px;width: 400px;'>Figure 2. We culture our <i>E. coli</i> in an incubator with shaker and light bulb to provide favored environment. </p></div>
 +
<br><br><br>
 +
<p>After the culture reaches 6, 12 and 24 hour, we open the aluminum foil of the test group and plotted the surviving cell number over blue light exposure time. The counting procedure was carried out by CFU (colony Forming Unit), and te surviving ratio was documented over light exposure time. </p>
 +
<img src='/wiki/images/e/ef/NYMU14_safety_res1.png'>
 +
<p>And we did serial dilution for every sample we acquired. And apply our 10^4, 10^5, 10^6, 10^7, 10^8, 10^9, 10^10 dilutioned liquid culture to the plate. </p>
<img src="/wiki/images/4/4f/NYMU14_safety_2.jpg" style='width:700px;'>
 +
<p>The overall results “group data 24 Hour” and the colony counting list was placed in the down-right.<p>
 +
<img src="/wiki/images/7/78/NYMU14_biosafety_40_plate_count.jpg" style='width:500px;'>
-
<h3>Results</h3>
 
-
<div style="display: inline-block; float: right; margin: 24px;"><img src="/wiki/images/a/a1/NYMU14_safety_3.jpg" style="width: 360px;"><p class="noindent" style="font-size: 14px;display: block; margin: 0 auto; text-align: center;"> The Clock Count Dilution Based test /// CCDB test </p></div>
 
-
 
-
<p>Due to the killing efficiency attained less than 1 survival in every 100 population at the growing time 6 hour. The CFU counting may not be a suitable alternative. Therefore, we did rough estimation by a serial 10X times dilution. By setting the gradient at 10 times dilution, we can know where the cell number’s power index lye. For example, the colony disappear between gradient of 4 and 5, thus we can infer the cell number X would be : 10<sup>4</sup> &lt; X &lt; 10<sup>5</sup> . So on and on, there are several examples in graph. </p>
 
<h3 style='float:left; width:100%;'>Statistics Analysis</h3>
<p class="noindent" style="width: 100%; float: left;">Control: no exposure to light<br>
Line 42: Line 43:
<b><p><i>E. coli</i> induced to death by light after cultured for 12hr</b></p>
<img src='/wiki/images/d/d4/NYMU14_safety_table2.JPG'>
-
 
<b><p><i>E. coli</i> induced to death by light after cultured for 24hr</b></p>
<img src='/wiki/images/4/41/NYMU14_safety_table3.JPG'>
 +
 +
<p> According to our modeling results, a 20% efficiency may already occur some influence in human oral environment. In our case, HOPE can attain 28% of biofilm cleansing just in 12 hours of culture, not even to mention the excellent performance of 70% cleansing at the culture of 36 hours. </p>
 +
<img src='/wiki/images/3/3e/NYMU14_hpres.png'>
 +
 +
<h3>Results </h3>
 +
<div style="display: inline-block; float: right; margin: 24px;"><img src="/wiki/images/a/a1/NYMU14_safety_3.jpg" style="width: 360px;"><p class="noindent" style="font-size: 14px;display: block; margin: 0 auto; text-align: center;"> The Clock Count Dilution Based test /// CCDB test </p></div>
 +
 +
<p>Due to the killing efficiency attained less than 1 survival in every 100 population at the growing time 6 hour. The CFU counting may not be a suitable alternative. Therefore, we did rough estimation by a serial 10X times dilution. By setting the gradient at 10 times dilution, we can know where the cell number’s power index lye. For example, the colony disappear between gradient of 4 and 5, thus we can infer the cell number X would be : 10<sup>4</sup> &lt; X &lt; 10<sup>5</sup> . So on and on, there are several examples in graph. </p>
 +
<p>Inferred from the above table, we could discover that after exposure to light for a period of time, the population of modified <i>E. coli</i>(transformed by ccdb suicide gene) decrease. The more exposure time, the less the population is. So we could conclude that our modified <i>E. coli</i> could be killed by exposure to light. </p>
Line 54: Line 63:
<p>Indicated from the above graph, we could discover that after exposure to light for a period of time, the population of <i>E. coli</i>(transformed by ccdb suicide gene) dramatically decrease. And even the population of <i>E. coli</i> reached the stable stage, we can still attain 92.5%proportion of killing.</p>
-
<div><img src=''><p>Six plates of biosafety <i>E. coli</i> was cultured in individual 10 microliter LB. Two in a group one test one control. Therefore, we have three groups of data (6 Control / 6 Test ) , (12 Control / 12 Test ) , (24 Control / 24 Test ) All six of them are covered with Aluminum foil, in order to isolate blue light disturbance.</p></div>
+
<p>Example : 6 Hour light exposure, 10^5 dilution compare of “Control V.S Test” We see drastic number difference between them. 1984 V.S 324 </p>
-
 
+
-
<p>We culture our <i>E. coli</i> in an incubator with shaker and light bulb to provide favored environment.</p>
+
-
<p>At culture time : 6 Hour, we open the Aluminum foil of labled “Biosafety 6 Hour Test”
+
-
Then we started the compare test between control and test plate. A CFU (colony forming unit ) test was done every 2 hour, by comparing “Control and Test plate” we calculate the killing efficiency. </p>
+
-
<p>At time 12 hour, the second plate “Biosafety 12 hour test” was also revealed.</p>
+
-
<p>At time 18 hour, the second plate “Biosafety 18 hour test” was also revealed .</p>
+
-
<img src='/wiki/images/e/ef/NYMU14_safety_res1.png'>
+
-
<p>The overall results “group data 24 Hour” and the colony counting list was placed in the down-right. </p>
+
-
<br>
+
-
<p>Example : 6 Hour light exposure, 105 dilution compare of “Control V.S Test”</p>
+
<img src='/wiki/images/c/c8/NYMU14_safety_ex1.JPG' style='width:250px;'>
-
<h1>Lab safety</h1>
+
    <h1>Lab safety</h1>
<p>We conducted our experiments in Biosafety Level 1 (BSL1) laboratory, which is suitable for work involving well-characterized agents not known to consistently cause disease in healthy adult humans, and of minimal potential hazard to laboratory personnel and the environment according to CDC (Centers for Disease Control and Prevention in United states). Furthermore, professors checked our experiments before we did it. And we have written the protocols to confirm that we had right procedures.</p>
         <h3>Lab training</h3>
         <h3>Lab training</h3>
Line 75: Line 74:
         <h3>Waste</h3>
         <h3>Waste</h3>
<p>There is chemical and bacteria mixture after conducting the experiment, we gather then into a bottle. Clean it daily to prevent explosion because of air made by bacteria. After autoclaving the waste, we pour it with a lot of water to dilute the toxic chemicals. Instead of carcinogen EtBr, we used safer dyes to reduce contamination.</p>
 +
 +
</div>
</div>
         <h1>Reference</h1>
         <h1>Reference</h1>

Latest revision as of 01:39, 18 October 2014

X
Next ⇒
⇐ Prev
...
Safety

Biosafety

Organisms We Used

We use E. coli DH5α and phage M102 in our project. They help us to control the number of S. mutans, pathogen in the mouth. As we hope to use these organisms inside our mouth, we do biosafety research, and design suicide circuits in E. coli to prevent it from causing disease when dropping out of our mouth. We will discuss biosafety, laboratory safety respectively.

Strain information of E. coli

E. coli DH5α is in risk group 1, which is the most harmless. They do not carry the well recognized pathogenic mechanisms required by strains of E. coli that cause the majority of enteric infections. It is considered to be non‐pathogenic and unlikely to survive in host tissues and cause disease. [1]

Strain information of bacteriophage M102

Phage M102 belongs to the family of Siphoviridae with morphotype B1[2], which is tail long and noncontractile, head isometric. Bacteriophage M102 is specific to S. mutans, there is little concern of risks to human and environment.

Purpose

We use Lactobacillus casei as our chassis in bringing out numeral functions. However, we use E. coli primarily to do our circuit construction, and the testing of its features in biofilm-cleansing and pathogen killing. It is obvious that Lactobacillus casei has less safety concern in contrast to E. coli. Therefore, in afraid of causing environmental danger, we design several safety lock, in the aim of containing harms.

Design

We constructed a killing gene regulated by a blue light promoter. We picked Ccdb, which is a coding gene that blocks E. coli polymerase to bind on DNA. As for the blue light promoter we uses FixK2 promoter which is regulated by blue light. Both these gene were separately K145151 and K592006 in the iGEM parts registry.

Experiments

Six plates of biosafety E. coli was cultured in individual 10 microliter LB. Two in a group one test one control. Therefore, we have three groups of data (6 Control / 6 Test ) , (12 Control / 12 Test ) , (24 Control / 24 Test ) All six of them are covered with Aluminum foil, in order to isolate blue light disturbance.We culture our E. coli in an incubator with shaker and light bulb to provide favored environment.
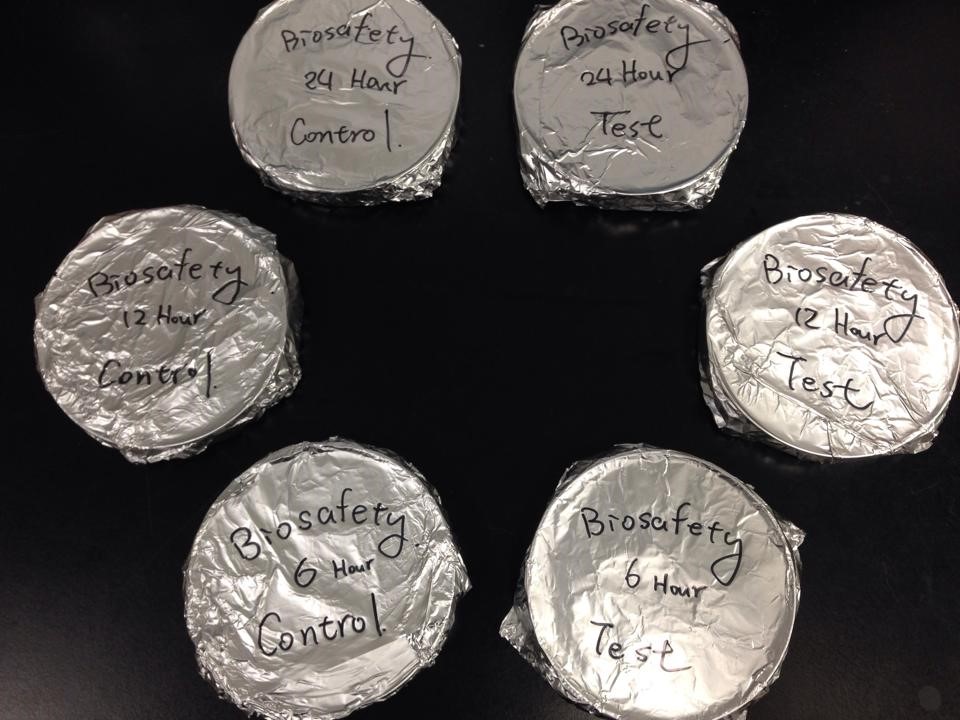
Figure 1. 6 plate of 3 Test,3 Control
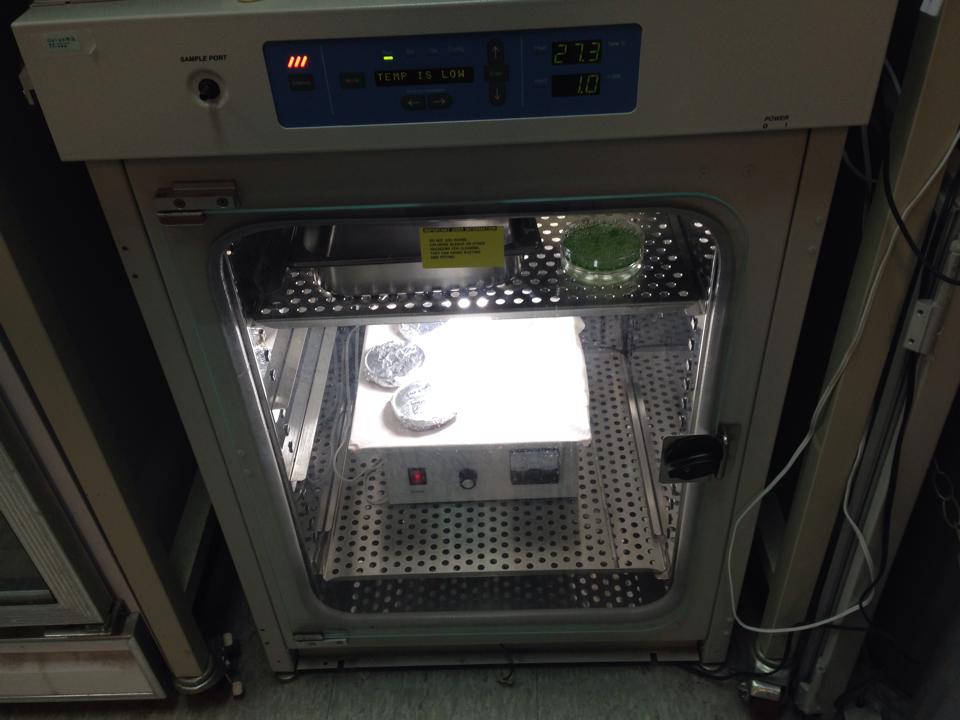
Figure 2. We culture our E. coli in an incubator with shaker and light bulb to provide favored environment.


After the culture reaches 6, 12 and 24 hour, we open the aluminum foil of the test group and plotted the surviving cell number over blue light exposure time. The counting procedure was carried out by CFU (colony Forming Unit), and te surviving ratio was documented over light exposure time.

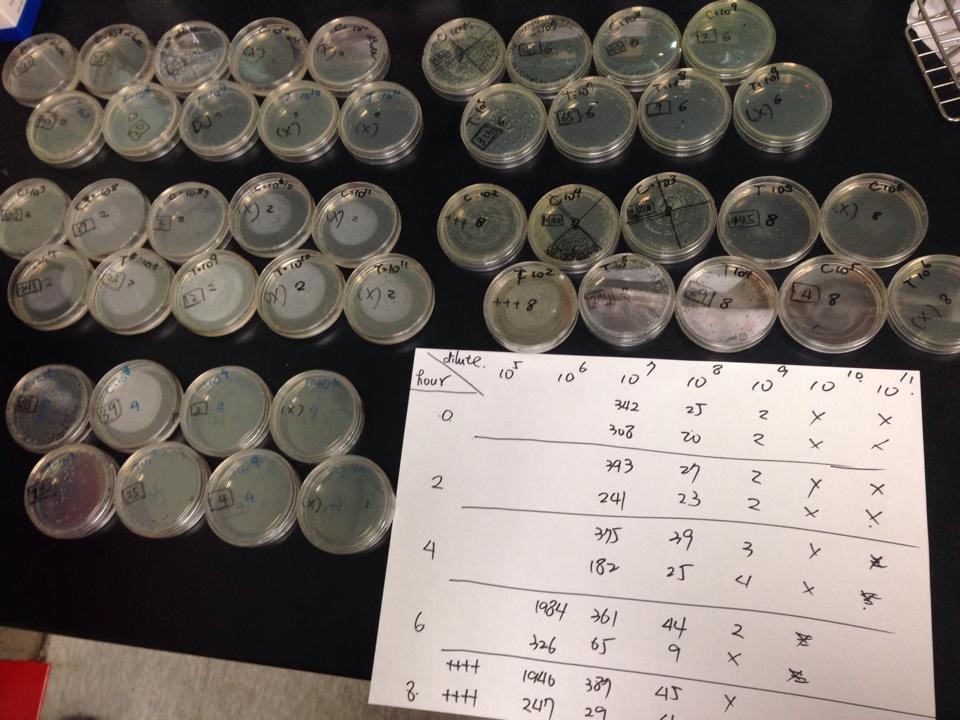
And we did serial dilution for every sample we acquired. And apply our 10^4, 10^5, 10^6, 10^7, 10^8, 10^9, 10^10 dilutioned liquid culture to the plate.

The overall results “group data 24 Hour” and the colony counting list was placed in the down-right.
Statistics Analysis

Control: no exposure to light
Test: exposure to light

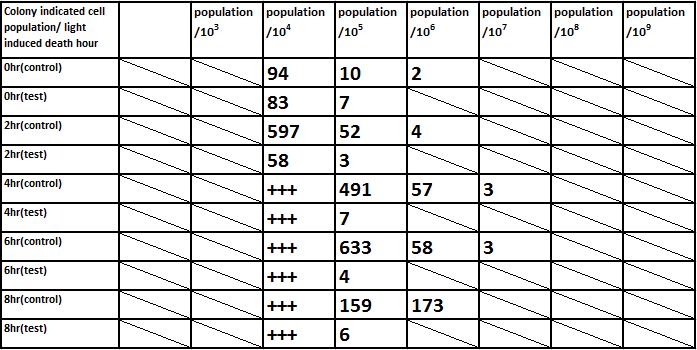
E. coli induced to death by light after cultured for 6hr
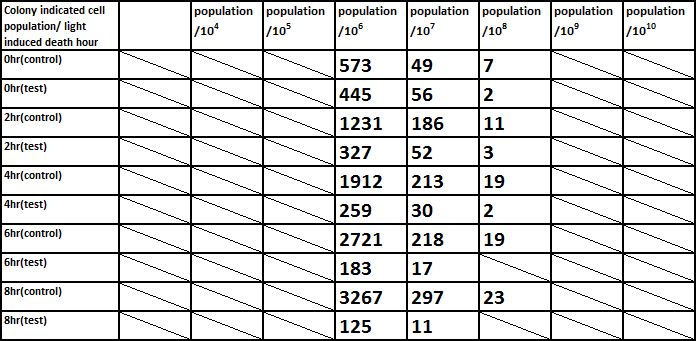
E. coli induced to death by light after cultured for 12hr
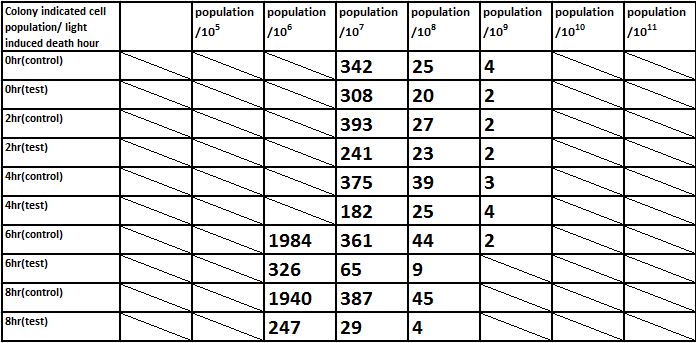
E. coli induced to death by light after cultured for 24hr
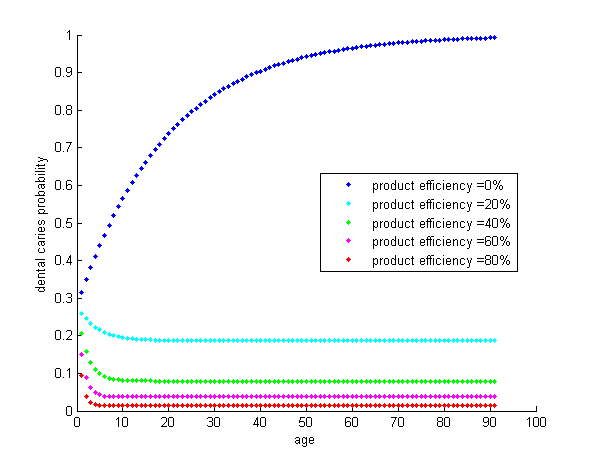
According to our modeling results, a 20% efficiency may already occur some influence in human oral environment. In our case, HOPE can attain 28% of biofilm cleansing just in 12 hours of culture, not even to mention the excellent performance of 70% cleansing at the culture of 36 hours.
Results
The Clock Count Dilution Based test /// CCDB test

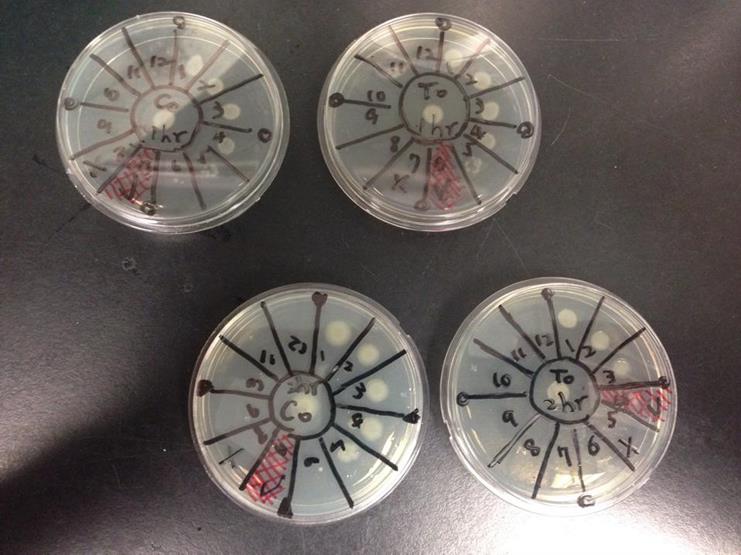
Due to the killing efficiency attained less than 1 survival in every 100 population at the growing time 6 hour. The CFU counting may not be a suitable alternative. Therefore, we did rough estimation by a serial 10X times dilution. By setting the gradient at 10 times dilution, we can know where the cell number’s power index lye. For example, the colony disappear between gradient of 4 and 5, thus we can infer the cell number X would be : 104 < X < 105 . So on and on, there are several examples in graph.

Inferred from the above table, we could discover that after exposure to light for a period of time, the population of modified E. coli(transformed by ccdb suicide gene) decrease. The more exposure time, the less the population is. So we could conclude that our modified E. coli could be killed by exposure to light.

Inferred from the above graph, we could discover that after exposure to light for a period of time, the survival rate of E. coli(transformed by ccdb suicide gene) dramatically decrease. And the less culture time, less time is needed to kill most of them (In 2hr survival rates are all below 1%). So we could conclude that our modified E. coli could be easily killed by exposure to light in a short upon released.
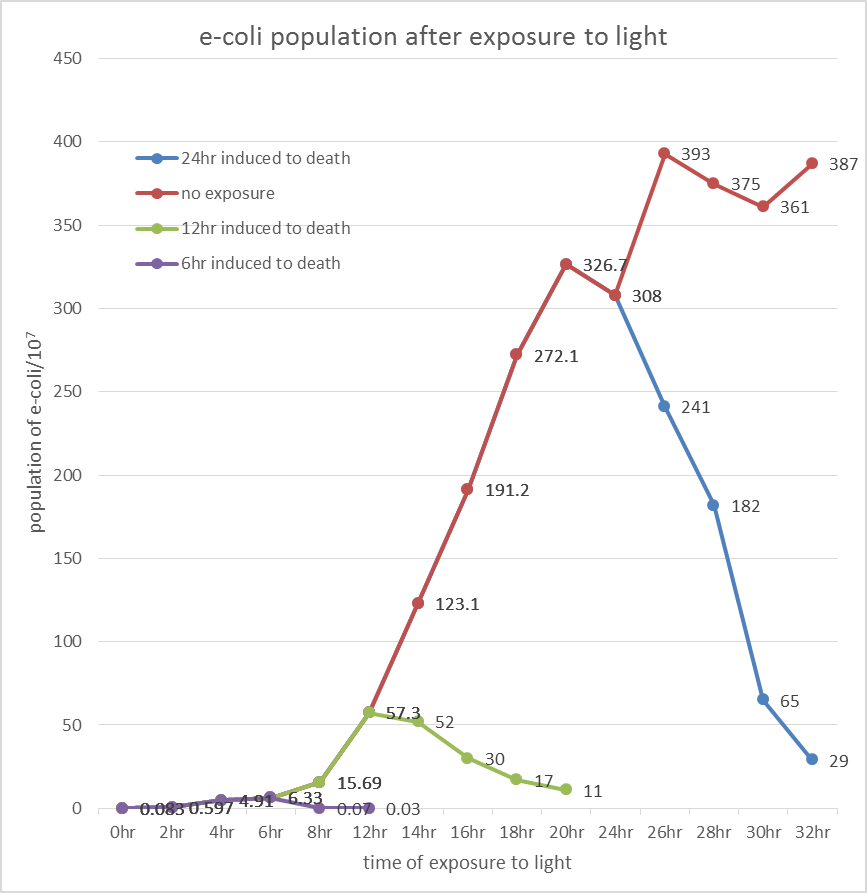
Indicated from the above graph, we could discover that after exposure to light for a period of time, the population of E. coli(transformed by ccdb suicide gene) dramatically decrease. And even the population of E. coli reached the stable stage, we can still attain 92.5%proportion of killing.

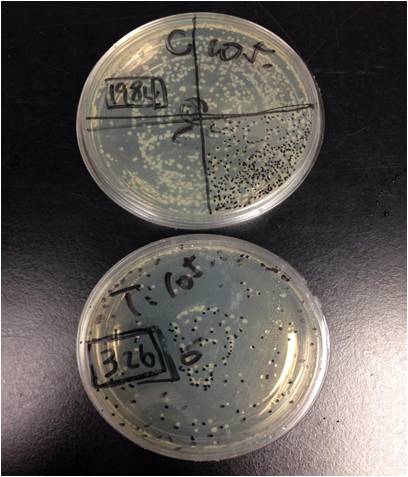
Example : 6 Hour light exposure, 10^5 dilution compare of “Control V.S Test” We see drastic number difference between them. 1984 V.S 324
Lab safety

We conducted our experiments in Biosafety Level 1 (BSL1) laboratory, which is suitable for work involving well-characterized agents not known to consistently cause disease in healthy adult humans, and of minimal potential hazard to laboratory personnel and the environment according to CDC (Centers for Disease Control and Prevention in United states). Furthermore, professors checked our experiments before we did it. And we have written the protocols to confirm that we had right procedures.

Lab training

Every person in NYMU iGEM team has 3 in 1 training directed by professors, who led us step by step. Thus, some toxic chemicals are emphasized, like DNA dye used in electrophoresis. After doing all steps overseen by professors, all people could use instruments properly.

Protection

Everyone must wear coat and gloves before entering the laboratory with long pants and shoes which covered our feet entirely. If we need to go out of the experimental zone, we take off the coat and gloves, and washed hands with antibacterial hand wash, not to touch door knob with gloves. We have done this strictly, so to prevent taking the bacteria out of lab.

Waste

There is chemical and bacteria mixture after conducting the experiment, we gather then into a bottle. Clean it daily to prevent explosion because of air made by bacteria. After autoclaving the waste, we pour it with a lot of water to dilute the toxic chemicals. Instead of carcinogen EtBr, we used safer dyes to reduce contamination.

Reference

  1. Escherichia coli K-12 Derivatives Final Risk Assessment , TSCA (http://epa.gov/biotech_rule/pubs/fra/fra004.htm)
  2. van der Ploeg, J. R. (2007). Genome sequence of Streptococcus mutans bacteriophage M102. FEMS Microbiol Lett 275, 130–138.