Background
As we have shown in competition model, it is better to control the population of S. mutans in a proper amount. To achieve this goal, we design a S. mutans population sensing promoter and a threshold in our circuit, and therefore won’t start the killing module, the lysine-protein-producing gene, until S. mutans exceed the optimal amount we have set.
NlmC is a S. mutans population sensing promoter. Studies have shown that nlmC is triggered by a transcription factor which is only produced when receptor binds to CSP, a quorum sensing chemical released by every S. mutans[1]. The more S. mutans there are, the higher the concentration of CSP is in the environment, and therefore, the more likely the coding sequence behind the downstream promoter, nlmC, is to be transcribe[2]. However, the certain and quantified connection between the amount of S. mutans and CSP concentration is not well understood. Therefore, we use modelling to do a regression and find out the relation by using an experimental data[3].
Nevertheless, using population sensing promoter only doesn’t meet our needs, for we want to have the killing module transcribed only when the amount of S. mutans exceed a certain level. And since the RBS in M102, the phage we plan to manipulate, is not well studied, changing RBS that have different ribosome binding strength is not suitable for our circuit to create a threshold. And therefore we have to find another way to attain the objective. It is well known that terminators have its own efficacy and is possible to have some leakage[4]. As a result, if we put terminators between promoter and coding sequence, the circuit will not be transcribed until the concentration of transcription factor reach a certain level and raise the terminator leakage probability.

Using the above-described module, we can change the level of threshold by putting different efficacies and numbers of terminators in our circuit. It is reasonable for use to introduce the rule of probability for predicting the result. The higher the efficacy of terminator is, the less likely the coding sequence is to be transcribed. And the more terminators put behind the promoter, the lower the transcription probability is, as the rule of probability multiplication has shown (eq.). Here, we use modelling to verify this concept and figure out the best combination of terminators for our circuit.
Models and mathematic equations
If we build some terminator in front of the lysine gene mRNA, the concentration of lysis protein won’t increase easily and thus killing the S. mutans in a short time. Although the threshold of concentration of lysine gene that would kill S. mutans is fixed, we can still regulate the velocity of lysine protein reach this threshold by using different amount of terminator with different efficiency.
$$\frac{\mathrm{d}[\text{lysine gene mRNA}]}{\mathrm{d}t}=\beta \frac{[\text{comE}]^n}{K_d+[\text{comE}]^n} (1-a)^x - [\text{lysine gene mRNA}] K_m$$ $$\frac{\mathrm{d}[\text{lysine protein}]}{\mathrm{d}t}= K_t [\text{lysine gene mRNA}] - K_p [\text{lysis protein}]$$
This is the simulation of lysine gene mRNA and the lysine protein. The circuit is activated by nlmC promoter, which is turned on by comE molecule. The term $(1-a)^x$ is how the terminator works, lowering the probability that the promoter can successfully transcript the lysine gene mRNA. Note that in addition to using same terminator, we can try combinations of different terminators. The meaning of parameters is shown as below:
1. $\beta$:max nlmC promoter activity
2. $K_d$:promoter-TF dissociation constant
3. $K_m$:Lysine gene mRNA degradation
4. $K_t$:Translation efficiency
5. $K_p$:Lysine protein degradation
6. $n$:hill coefficient
7. $a$:terminator efficiency
8. $x$:amount of terminator
Results and model validation
CSP, OD and beta-galactosidase
Here, we discuss the graphical representation of competence stimulating peptide(CSP), OD and beta-galactosidase. The aim is to determine the relationship of the different variables, and to reformulate a suitable models. As we can see on figure 1, a graphical representation between OD and beta-galactosidase has presented. It is noticeable that the relationship, OD vs beta-galactosidase, can be approximated using a simple regression model: $$\text{OD}=\alpha+\beta\text{beta-galactosidase}+\epsilon$$ and the fitted model, the result can be expressed as: $$\text{OD}=0.425+0.007\text{beta-galactosidase}$$
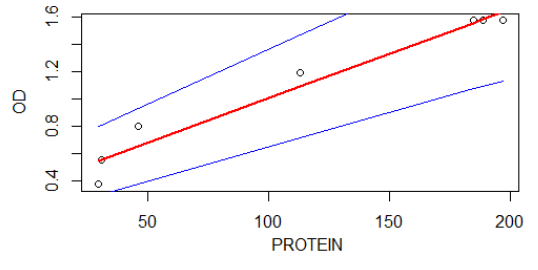
Figure 1 : Graphical representation of OD vs beta-galactosidase(protein)
This means that on average for a unit change on beta-galactosidase OD can be increased by 0.007. The two blue line curves show a 95% confidence interval of the fitted line (red).
$$\text{Table 1: Regression model result of OD vs beta-galactosidase}$$
==============================================================
Estimated parametrs:    | Statistical Tests:
Intercept (alpha)=0.415 | R-squared= 0.95
OD (beta)=0.007         | p-value=0.00011
--------------------------------------------------------------
F-statistic=116.5
===============================================================
The P.value < 0.05 of the regression model indicated that there is a significant relationship between OD and beta-galactosidase and the R-square value 0.95 shows that their relationship is strong. In other words, 95% of the variable OD in the model can be explained be variable beta-galactosidase and the remain 5% can be explained with other variables (which are not included in the model).
As for the model of beta-galactosidase and CSP, which turned out to be a nonlinear one, we tried to fit it with exponential model:

Therefore, we can estimate the amount of CSP with OD from the two models we derived:
$$\text{CSP}=3.6837 \exp{(0.0039\times\frac{\text{OD}-0.425}{0.007})}$$
From the competition model, we know that we can optimize our oral condition via activating our killing module when S. mutans reach 72% the amount of its maximum population. From our growth & pH model, we can know that 72% the amount of S. mutans' maximum population is OD600 at about 0.86. The CSP concentration is then computed from the equation above: $$3.6837 \exp{(0.0039\times\frac{\text{0.86}-0.425}{0.007})}=4.69 \text{(ng/ml)}$$
To figure out how CSP regulate nlmC promoter, we again use data from literature and did linear transformation beforehand to fit our model and the theoretical endolysin amount. The shows the fitting result:
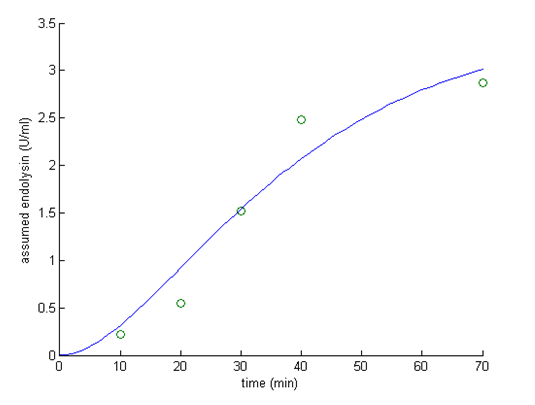
Based on the above described results, we are going to find the number and the efficiency of terminators we plan to put in our control circuit, so that endolysin will reach the toxic concentration as soon as CSP concentration is above 4.69 ng/ml. The toxic concentration of endolysin was obtained from literature[5], which pointed out that endolysin at the concentration of 15 U/ml may start to decrease OD600. Table 2 reveals the effect of different numbers and the efficiencies of terminators.
$$\text{Table 2: Effect of different threshold terminators on endolysin expession}$$
| Number of terminators | BBa_B0012($a$=0.309) | BBa_B0015($a$=0.984) |
|---|---|---|
| 1 |  |  |
| 2 |  | 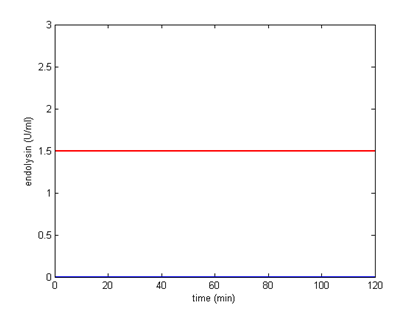 |
| 3 | 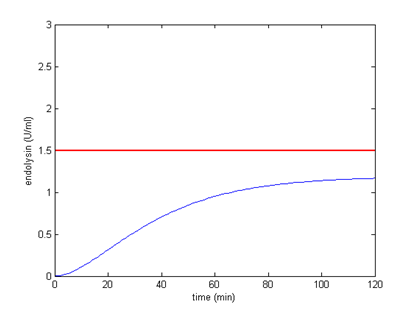 |  |
It turns out that among all, using 2 BBa_B0012 terminators will meet our needs better, the circuit can start the killer module when CSP is around 4.69 ng/ml. Other terminator combinations would start the killer module either when CSP is too high or too low. By analytical calculation, we figure out that any combination of terminators that reduces transcription rate to about 0.1225% will be suitable for our control circuit. The optimal condition is shown below:

Appropriate combination of terminators. When CSP is less than 4.69, the killer module won’t be started.
The concentration of endolysin will exceed toxic concentration and kill the S. mutans as more CSP is secrete by S. mutans.
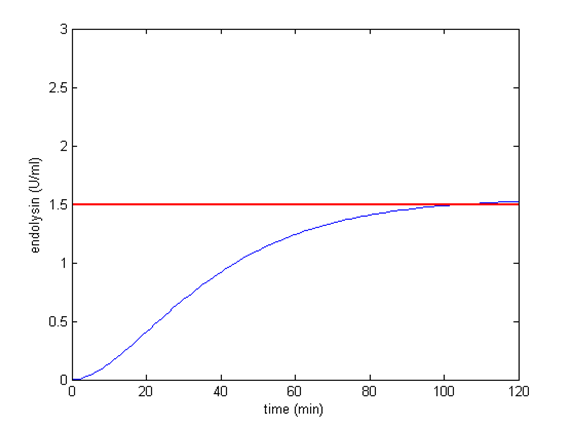
Appropriate combination of terminators. When CSP is more than 4.69, the killer module will be started.
 "
"


