"
"


Background
Our human practice team has sent out surveys to know the public opinion of our product (link). Here we make use of the survey questions and model for how our product will influence caries rate. Tooth decay rate with respect to age was obtained from Health and Nutrition Examination Survey in the USA[1]. We added in the assumption that the probability of one having dental plaque was about the same over time. Therefore, we use Markov chain to fit the data and figure out the probability of getting caries, hoping to predict the caries rate change after the application of our product.
Markov chain describes how a system undergoes transitions from one state to another. The next state depends only on the current state, which is computed by a transition matrix. The transition matrix describes the probabilities of going from one state at time n to the other states at time n+1. Markov chain is a kind of stochastic process which has many applications of real-world processes. By validating the Markov chain with caries rate, we can find the probability of one having caries in different age. We then add into the survey-based probability of one using our product and predict the caries rate change.
Models and mathematic equations
In this model, the probability of having dental caries over lifetime is described as $$\begin{bmatrix}x_k\\1-x_k\end{bmatrix}=\begin{bmatrix}a_k & b_k\\1-a_k & 1-b_k\end{bmatrix}\begin{bmatrix}x_{k-1}\\1-x_{k-1}\end{bmatrix}$$
where $x_k$ is the probability of having dental caires at time period $k$; $a_k$ is the probability of tooth-decayed people being untreated if not going to a dentist, so it might close to 1 in common sense; $b_k$ is the probability of oral-healthy people becoming tooth-decayed. The term $1-a_k$ and $1-b_k$ is opposite to $a_k$ and $b_k$ respectively, which is the probability of two kinds of people, tooth-decayed and oral-healthy, become oral healthy in time period $k$. In out experiment, $k$ is set to 100.
Results and model validation
We fitted the transition matrix of Markov chain via using statistics data about dental caries rate mentioned above. Therefore, the probabilities of one with or without dental caries after ten years based on current dental health status were derived. Figure 1 reveals how our Markov chain fits the statistics data.
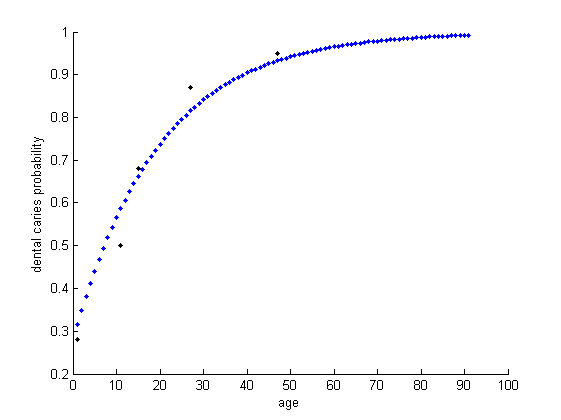
Figure 1: Applied Markov chain model on statistics data.
Base on survey result done by Human Practice team, we can know the one’s willingness of using our product. About 41% tooth-decayed people and 51% oral-healthy people would like to use the product. Thus, we can predict how our product can affect dental caries rate among the public. However, there is concern that our product can’t prevent tooth decay 100%. But without clinical trial, we can’t have precise idea about the prevention effect of our product. We then use sweeping to model for the effect. The result is shown in figure 2.
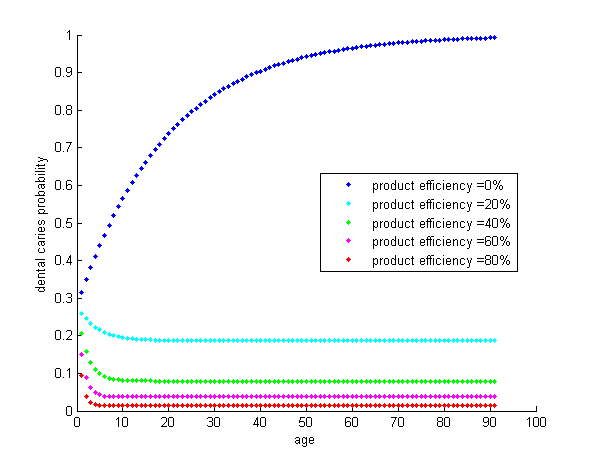
Figure 2: Effect of our product based on public acceptability questionnaire and sweeping clinical efficiency.
Here we can conclude that if our product effect is above 20%, we can reverse the fact that one will be more likely to have dental caries when growing older. Moreover, we can suppress the tooth decay rate below 10% if the effect is above 40%, which is very encouraging.