Introduction
This part aims to simulate the circuit of Attachment part, which can help shorten the distance of helper E. coli and S. mutans.
The circuit is constructed by the following parts, constitutive promoter + rbs + INPNC (k523013) + C16 + terminator (B0015). The detailed mechanism is introduced on Cleanse-Attachment.
In this part, we fit the parameter in the system with the experimental data from our wet lab. To test how the circuit works, GFP is added after C16 in the testing circuit. It can represent the amount of C16 protein. The amount of protein expression is transferred from the GFP florescence [1].
System
INPNC, C16, and GFP are the main product in the testing circuit. In the design circuit, there are only INPNC and C16. GFP can be used to test whether the circuit is functional.
$$\frac{d[\text{GFP mRNA}]}{dt}=P_{const}-K_{deg_mGFP}[\text{GFP mRNA}]$$
$$\frac{d[\text{GFP}]}{dt}=K_t[\text{GFP mRNA}]-K_{deg_GFP}[GFP]$$
1. $P_{const}$:constitutive promoter activity
2. $K_{deg\_mGFP}$:GFP mRNA degradation
3. $K_{t}$:Translation efficiency
4. $K_{deg\_GFP}$:GFP degredation
Result
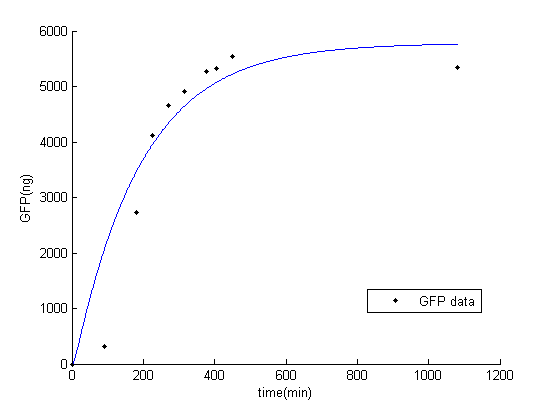
While fitting the parameter, we set range of parameter which met the range of normal promoter activity, mRNA degradation, translation rate, and protein degradation [2]. The result of fitted parameter is, $P_{const}=0.24$, $K_{deg\_mGFP}=0.15$, $K_{t}=19.45$, $K_{deg\_GFP}=0.01$. The result of simulation and experimental data is very similar.

Figure 1: Result of GFP simulation and experimental data
Reference
- H. A. Richards, Quantitative GFP fluorescence as an indicator of recombinant protein synthesis in transgenic plants. Plant Cell Rep (2003) 22:117–121
 "
"


