Team:Colombia/Parameters
From 2014.igem.org
| (25 intermediate revisions not shown) | |||
| Line 28: | Line 28: | ||
<br><br> | <br><br> | ||
| - | <b>c) Screening of parameters: </b> Sometimes we don't have the exact number that we need, but we have a rank where it could be or the parameter for a similar biological system, then we can perfom a screening of parameter, where we try to find the value that perfectly fits the reponse of our circuit. We designed a screening of parameters that can be made for any team | + | <b>c) Screening of parameters: </b> Sometimes we don't have the exact number that we need, but we have a rank where it could be or the parameter for a similar biological system, then we can perfom a screening of parameter, where we try to find the value that perfectly fits the reponse of our circuit. We designed a screening of parameters that can be made for any team, check the end of this section to know how to do it <html>. |
| Line 40: | Line 40: | ||
Some of the parameters only have an estimated order of magnitude and if their value is sensitive to the model we have to establish a better way to define the parameter. Also we wanted to know the importance of each parameters in the main outputs and how much each parameter affects the desired response. | Some of the parameters only have an estimated order of magnitude and if their value is sensitive to the model we have to establish a better way to define the parameter. Also we wanted to know the importance of each parameters in the main outputs and how much each parameter affects the desired response. | ||
| - | This test considered the following stages: i.) Establish the ranges of the parameters (Include one or two orders of magnitude), ii) Determine appropriate division for the ranges, iii) Iterate each parameter while leaving the others fixed in the MATLAB code. iv) See how the difference between the steady state's concentrations and the concentrations during the impulse of the pathogen changed with the change of each parameter. | + | This test considered the following stages: |
| + | <br> | ||
| + | i.) Establish the ranges of the parameters (Include one or two orders of magnitude), <br> | ||
| + | ii) Determine appropriate division for the ranges, <br> | ||
| + | iii) Iterate each parameter while leaving the others fixed in the MATLAB code.<br> | ||
| + | iv) See how the difference between the steady state's concentrations and the concentrations during the impulse of the pathogen changed with the change of each parameter. | ||
<br> | <br> | ||
<br> | <br> | ||
| Line 48: | Line 53: | ||
<br> | <br> | ||
Here we show the most important results: | Here we show the most important results: | ||
| - | + | <br> | |
<br> | <br> | ||
A careful a priori analysis showed the following to be key factors for a correct response: the maximum expression rate for the repressor (btr) and the activator (bta) of the pTet promoter and also their basal production rates, the phosphorylated LuxO-DNA coupling rate, the TRdomain-DNA coupling rate, and the hill’s coefficient. | A careful a priori analysis showed the following to be key factors for a correct response: the maximum expression rate for the repressor (btr) and the activator (bta) of the pTet promoter and also their basal production rates, the phosphorylated LuxO-DNA coupling rate, the TRdomain-DNA coupling rate, and the hill’s coefficient. | ||
| + | <br> | ||
| + | <center><i>Change in response for the basal expression rate of pTet activator</i></center> | ||
| + | </html> | ||
| + | [[File:Col1.tiff|450px|center|TA basal production Rate]] | ||
| + | <html> | ||
| + | <br> | ||
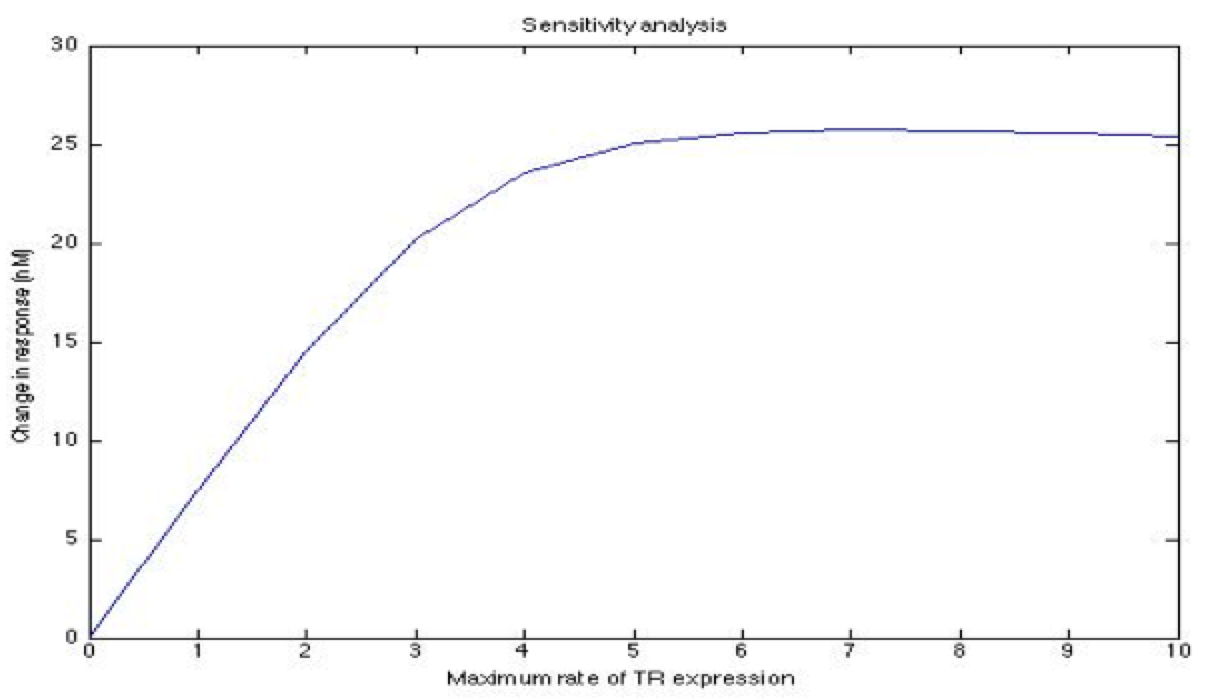
| + | <center><i>Change in response for the maximum rate of pTet repressor expression</i></center> | ||
| + | <br> | ||
| + | </html> | ||
| + | [[File:Col2.tiff|450px|center|Maximum rate of TR expression]] | ||
| + | <html> | ||
| + | <br> | ||
| + | <center><i>Change in response for the phosphorylated LuxO binding rate with DNA</i></center> | ||
| + | <br> | ||
| + | </html> | ||
| + | [[File:Col3.tiff|450px|center|LuxO*-DNA coupling rate]] | ||
| + | <html> | ||
| + | <br> | ||
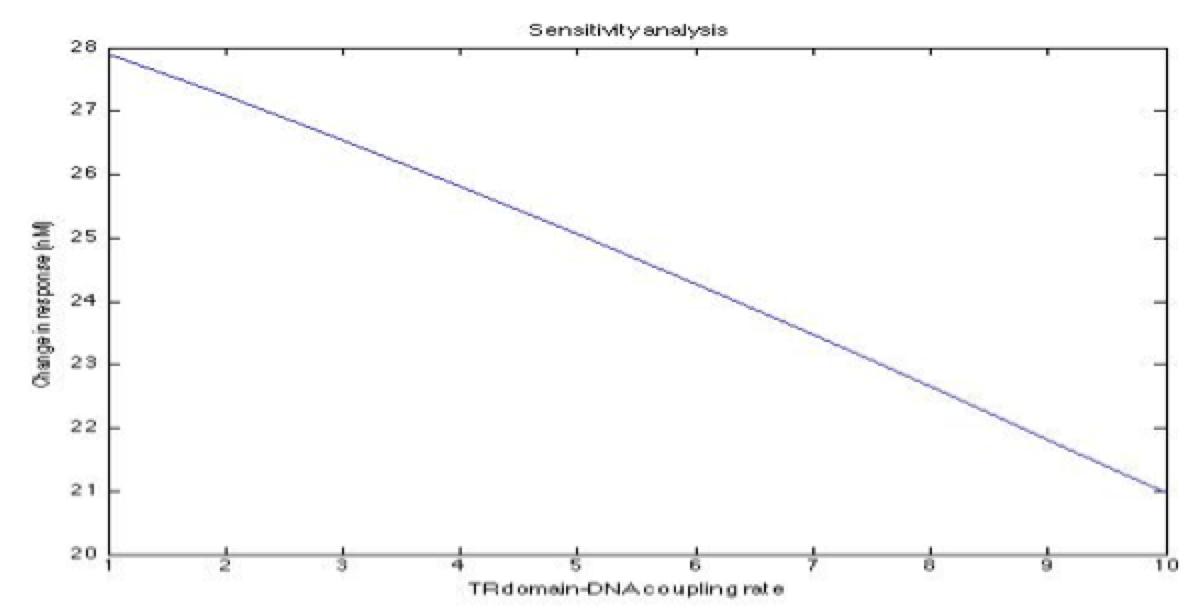
| + | <center><i>Change in response for the pTetR dimer DNA binding domain coupling rate with DNA</i></center> | ||
| + | <br> | ||
| + | </html> | ||
| + | [[File:Col4.tiff|450px|center|TRdomain-DNA coupling rate]] | ||
| + | <html> | ||
| + | <br> | ||
| + | <br> | ||
| + | </html> | ||
| + | <html> | ||
| + | <br> | ||
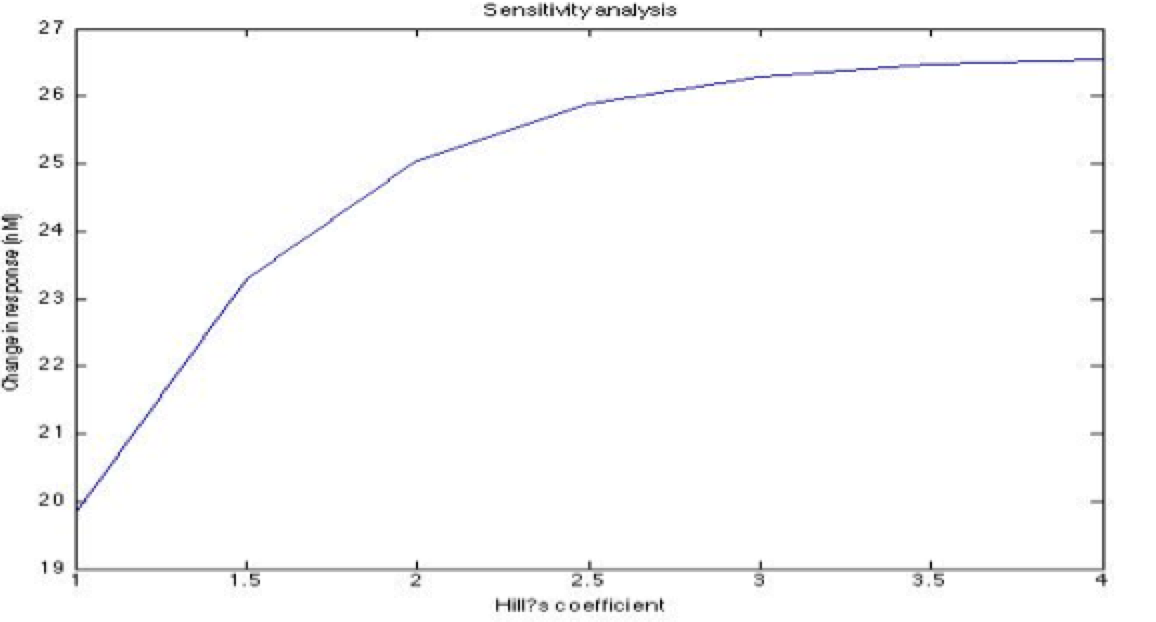
| + | <center><i>Change in response for the Hill's coefficient</i></center> | ||
<br> | <br> | ||
</html> | </html> | ||
| - | + | [[File:Col6.tiff| 450px|center|Hills coefficient]] | |
| - | + | ||
| - | + | ||
| - | + | ||
| - | [[File:Col6.tiff| | + | |
<html> | <html> | ||
<br> | <br> | ||
There is a clear tendency in protein degradation rate to have a peak in the maximum response rate at 0.5 (reciprocal hours) which is here is a few examples | There is a clear tendency in protein degradation rate to have a peak in the maximum response rate at 0.5 (reciprocal hours) which is here is a few examples | ||
<br> | <br> | ||
| + | <center><i>Change in response for the pTet repressor dimer decay rate</i></center> | ||
</html> | </html> | ||
| - | [[File:Col7.tiff| | + | [[File:Col7.tiff|450px|center]] |
| - | [[File:Col9.tiff| | + | <html> |
| + | <br> | ||
| + | <center><i>Change in response for the LuxU decay rate</i></center> | ||
| + | <br> | ||
| + | </html> | ||
| + | [[File:Col9.tiff|450px|center]] | ||
<html> | <html> | ||
<br> | <br> | ||
The importance of these analysis lies in the fact that some of these graphs are unpredictable a priori with just glance of the differential equations, here are a few examples | The importance of these analysis lies in the fact that some of these graphs are unpredictable a priori with just glance of the differential equations, here are a few examples | ||
<br> | <br> | ||
| + | <center><i>Change in response for the phosphorylated LuxO decay rate</i></center> | ||
</html> | </html> | ||
| - | [[File:Col10.tiff| | + | [[File:Col10.tiff|450px|center]] |
| - | + | ||
<html> | <html> | ||
<br> | <br> | ||
| - | + | <center><i>Change in Phosphorylated LuxO for the LuxO decay rate</i></center> | |
| + | <br> | ||
| + | </html> | ||
| + | |||
| + | [[File:Col12.tiff|450px|center]] | ||
<html> | <html> | ||
<br> | <br> | ||
| + | If you want to check out the full Document</html> [https://static.igem.org/mediawiki/2014/b/be/Col_SensA.pdf Click Here] | ||
| + | <html> | ||
| + | |||
| + | <br><br><br> | ||
| + | <b><font color="#8A0808" size="3" >Metropolis-Hastings Parameter Search→ </font></b><br> | ||
| + | <br> | ||
| + | Sometimes when everything has been tried and you still havent been able to even estimate the order of magnitude of one of your parameters a pretty nive tool to implemet is a Metropolis-Hastings Parameter Search. This algorithm is a Markov chain Monte Carlo method generally used to estimate parameters from models when some of the parameters are known or there are experimental measurements, this is specially useful for models with a high number of parameters. What is done is: | ||
| + | <br> | ||
| + | <br> | ||
| + | i.) Create a vector containing random numbers for the unkown parameters.<br> | ||
| + | ii.) Solve the system of diferential equations with this parameters and save a reference.<br> | ||
| + | iii.) Repeat step i.) with a new vector.<br> | ||
| + | iv.) Repeat step ii.) with the new vector.<br> | ||
| + | v.) Compare the results in both cases and save the reference of the solution that approaches the most to the desired one.<br> | ||
| + | vi.) Repeat from step iii.).<br> | ||
| + | <br> | ||
| + | |||
| + | |||
| + | </html> | ||
| + | [[File:ColMetropolis.png|650px|center]] | ||
| + | <html> | ||
| + | |||
| + | <center><i> Metropolis -Hastings algorithm </i></center> | ||
| + | |||
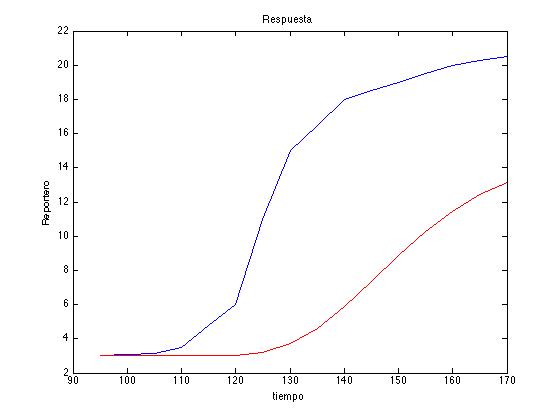
| + | Here is an example of the algorithm. In red we can see the reference saved for a random number vector generated and in blue the desired response: | ||
| + | <br> | ||
| + | <center><i>Example of a Metropolis-Hastings algorithm run with our model parameters.</i></center> | ||
| + | </html> | ||
| + | [[File:Col11.tiff|450px|center]] | ||
| + | <html> | ||
| + | <br> | ||
| + | We conducted such analysis, the code can be found in the </html> [https://2014.igem.org/Team:Colombia/Scripting scripting page] <html>. | ||
| + | <br><br><br> | ||
| + | |||
<b><font color="#8A0808" size="3" >References → </font></b><br> | <b><font color="#8A0808" size="3" >References → </font></b><br> | ||
| Line 102: | Line 176: | ||
</div> | </div> | ||
| + | |||
| + | <center> | ||
| + | <div class="button-fill orange" ><div class="button-text"> Back to modeling</div><div class="button-inside"><div class="inside-text"><a style="text-decoration: none; background-color: none; color: red;" href="https://2014.igem.org/Team:Colombia/Modeling">Go! </a></div></div></div> | ||
| + | </center> | ||
| + | <script> | ||
| + | $(".button-fill").hover(function () { | ||
| + | $(this).children(".button-inside").addClass('full'); | ||
| + | }, function() { | ||
| + | $(this).children(".button-inside").removeClass('full'); | ||
| + | }); | ||
| + | //@ sourceURL=pen.js | ||
| + | </script> | ||
| + | <br><br><br> | ||
</html> | </html> | ||
Latest revision as of 03:23, 18 October 2014
The Parameters
The numbers that define our destiny....
There are three possible ways to find this parameters (taken from Colombia 2012):
a) Literature: There are a lot of studies trying to find parameters for biological systems; but only a few of them have been characterised. Luckily for our project the Quorum Sensing of V. cholera and the pTEt inversor have been studied and we found a lot of parameters.
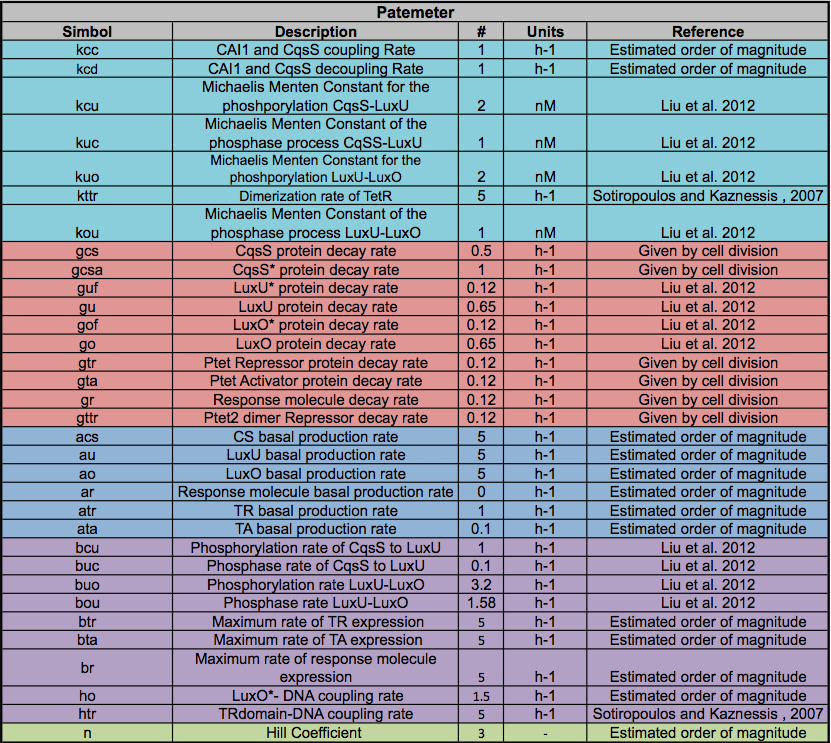
All of the Parameters found in the table below were taken from the literature (see references), if the exact parameter was not found we estimated an order of magnitude.
b) Experimental way: If an experiment is made using the biological system of interest, it is possible to find the parameters for the equations that models the whole system. For this project, it was necessary to model the biological system first. Thus, experiments couldn't be performed to find the constant for the differential equations.
c) Screening of parameters: Sometimes we don't have the exact number that we need, but we have a rank where it could be or the parameter for a similar biological system, then we can perfom a screening of parameter, where we try to find the value that perfectly fits the reponse of our circuit. We designed a screening of parameters that can be made for any team, check the end of this section to know how to do it .
Sensitivity analysis→
Some of the parameters only have an estimated order of magnitude and if their value is sensitive to the model we have to establish a better way to define the parameter. Also we wanted to know the importance of each parameters in the main outputs and how much each parameter affects the desired response.
This test considered the following stages:
i.) Establish the ranges of the parameters (Include one or two orders of magnitude),
ii) Determine appropriate division for the ranges,
iii) Iterate each parameter while leaving the others fixed in the MATLAB code.
iv) See how the difference between the steady state's concentrations and the concentrations during the impulse of the pathogen changed with the change of each parameter.
Note: the exact value for each parameter is not important. It is important their relevance and how they change the response.
Here we show the most important results:
A careful a priori analysis showed the following to be key factors for a correct response: the maximum expression rate for the repressor (btr) and the activator (bta) of the pTet promoter and also their basal production rates, the phosphorylated LuxO-DNA coupling rate, the TRdomain-DNA coupling rate, and the hill’s coefficient.
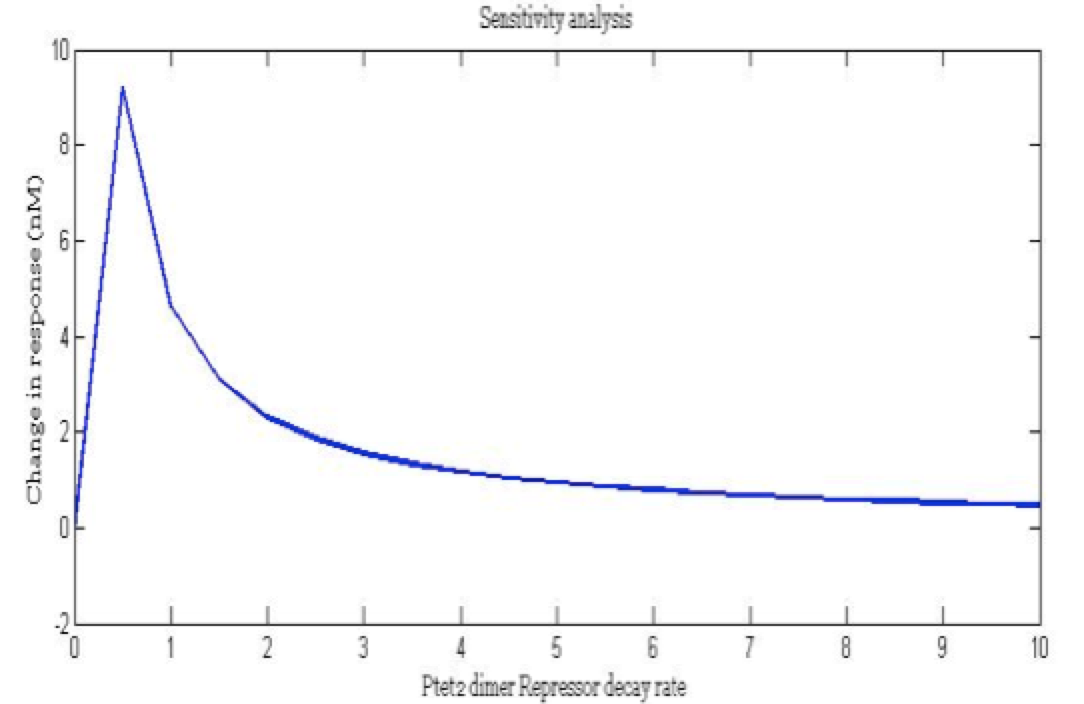
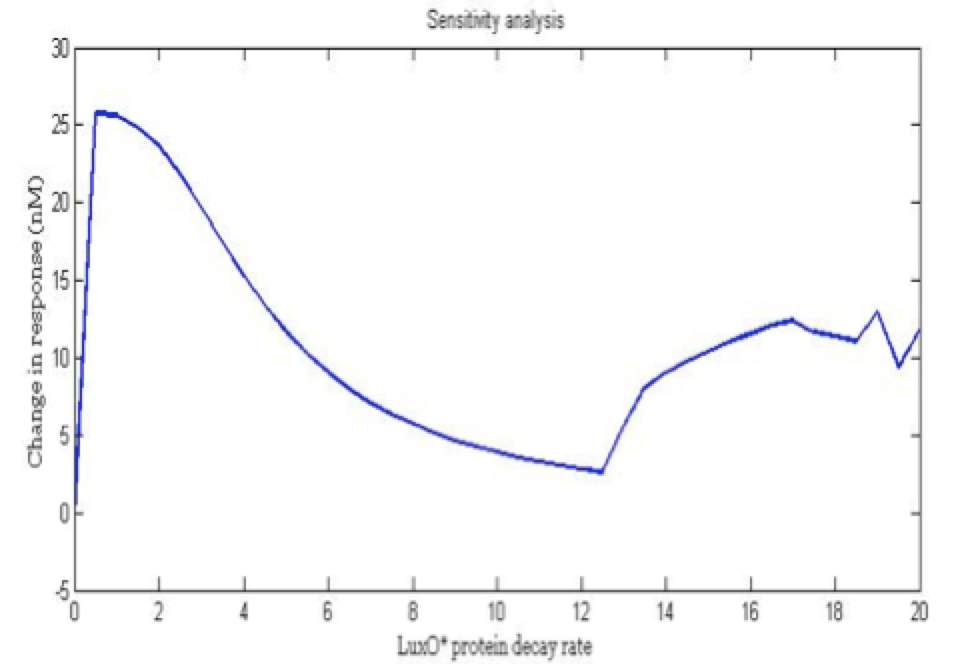
There is a clear tendency in protein degradation rate to have a peak in the maximum response rate at 0.5 (reciprocal hours) which is here is a few examples
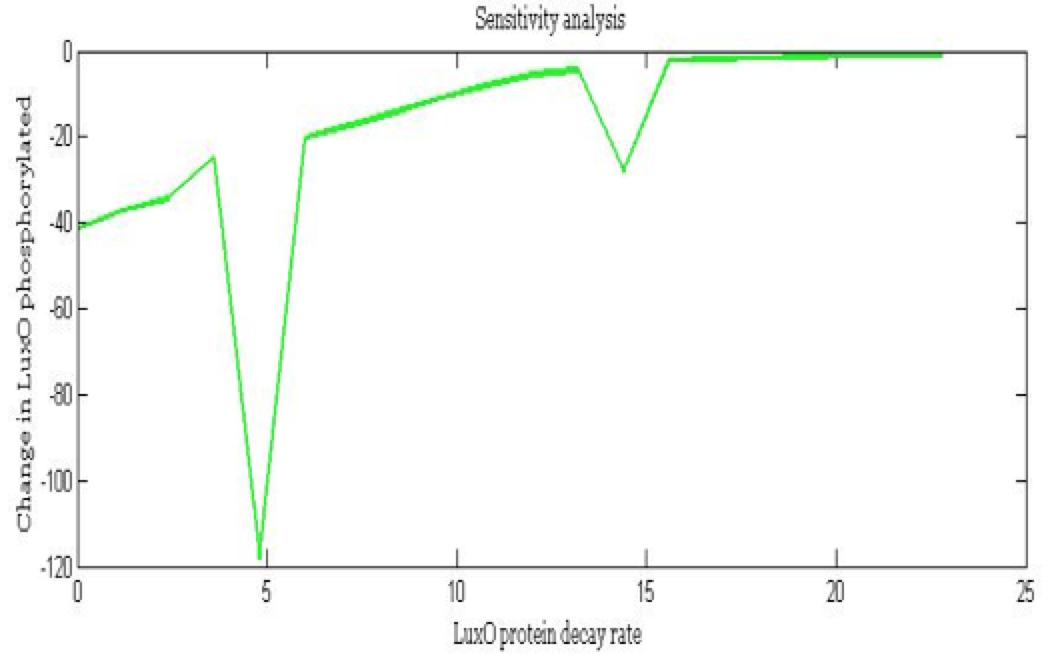
The importance of these analysis lies in the fact that some of these graphs are unpredictable a priori with just glance of the differential equations, here are a few examples
If you want to check out the full Document Click Here
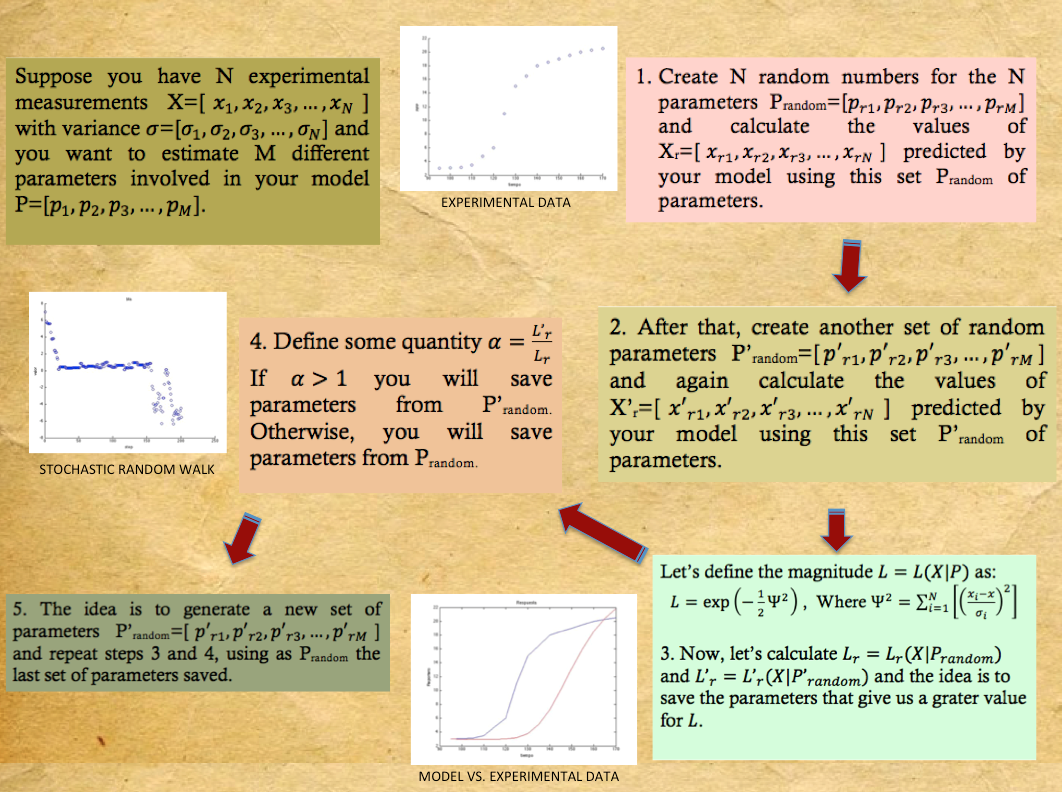
Metropolis-Hastings Parameter Search→
Sometimes when everything has been tried and you still havent been able to even estimate the order of magnitude of one of your parameters a pretty nive tool to implemet is a Metropolis-Hastings Parameter Search. This algorithm is a Markov chain Monte Carlo method generally used to estimate parameters from models when some of the parameters are known or there are experimental measurements, this is specially useful for models with a high number of parameters. What is done is:
i.) Create a vector containing random numbers for the unkown parameters.
ii.) Solve the system of diferential equations with this parameters and save a reference.
iii.) Repeat step i.) with a new vector.
iv.) Repeat step ii.) with the new vector.
v.) Compare the results in both cases and save the reference of the solution that approaches the most to the desired one.
vi.) Repeat from step iii.).
We conducted such analysis, the code can be found in the scripting page .
References →
Liu, X., Zhou, P., & Wang, R. (2012, August). Switch-like regulation of signal transduction by small RNA-mediated quorum sensing. In Systems Biology (ISB), 2012 IEEE 6th International Conference on (pp. 164-168). IEEE.
Sotiropoulos, V., & Kaznessis, Y. N. (2007). Synthetic tetracycline-inducible regulatory networks: computer-aided design of dynamic phenotypes. BMC Systems Biology, 1(1), 7.
Esmaeili, Afshin, Iman Yazdanbod, and Christian Jacob. "A model of the quorum sensing system in genetically engineered E. coli using membrane computing." International Genetically Engineered Machine (iGEM) competition (2009).
Jian-Wei, S. H. E. N. "Dynamics and mechanism of A quorum sensing network regulated by small RNAs in Vibrio harveyi." Communications in Theoretical Physics 55.3 (2011): 465.
Higgins, Douglas A., et al. "The major Vibrio cholerae autoinducer and its role in virulence factor production." Nature 450.7171 (2007): 883-886.
Kelly, Robert C., et al. "The Vibrio cholerae quorum-sensing autoinducer CAI-1: analysis of the biosynthetic enzyme CqsA." Nature chemical biology 5.12 (2009): 891-895.
 "
"


