Team:Colombia/Deterministic
From 2014.igem.org
| (4 intermediate revisions not shown) | |||
| Line 11: | Line 11: | ||
</font></h1></b></center> | </font></h1></b></center> | ||
| - | The first step is to develop a deterministic model based | + | The first step is to develop a deterministic model based on differential equations. Ordinary differential equations allow us to quantitatively describe the system at the molecular level. |
| - | Using the law of mass action is possible to model most | + | Using the law of mass action, it is possible to model most metabolic networks. We express the changes of concentration trough time for every substance in the system. We consider processes related to molecule export and import processes across the cell membrane or peptide production by a given gene or through a chemical reaction. All these terms depend on reaction kinetics that can be expressed as a simple multiplication or a complex expression, like a Hill equation. |
<b><font color="#8A0808" size="3" >Signal transduction → </font></b> | <b><font color="#8A0808" size="3" >Signal transduction → </font></b> | ||
| - | The receptor CqsS acts as a kinase when there is no auto inducer (CAI). It phosphorylates LuxU, which transfers its phosphate to LuxO. | + | The receptor CqsS acts as a kinase when there is no auto inducer (CAI). It phosphorylates LuxU, which transfers its phosphate to LuxO. In our case, phosphorylated LuxO activates promoter Pqrr. |
| - | Once the inducer is in the | + | Once the inducer is in the medium the receptor changes to phosphatase (CqsSp) mode and the flow is reversed. When LuxU is dephosphorylated, it removes the phosphate from LuxO. In consequence, promoter Pqrr is repressed. |
[[File: Colombia_Rxn1.png|center|600px]] | [[File: Colombia_Rxn1.png|center|600px]] | ||
| Line 32: | Line 32: | ||
| - | Taking this process into account and given the fact the phosphorylation process can | + | Taking this process into account and given the fact the phosphorylation process can be described as an enzymatic process, we used the Mass Action Law and Michaelis-Menten Kinetics in order to obtain the mathematical expressions that describe signal transduction: |
[[File: EqA.png|center|630px]] | [[File: EqA.png|center|630px]] | ||
| Line 40: | Line 40: | ||
[[File: EqB.png|center|630px]] | [[File: EqB.png|center|630px]] | ||
| - | Equations a and b describe the behavior of the receptor acting as a kinase (CqsS) and as a | + | Equations a and b describe the behavior of the receptor acting as a kinase (CqsS) and as a phosphatase (CqsSP). The kinase is produced at a constant rate alpha CS, is involved in Reaction 1, and has a decay rate of Gamma CS. The phosphatase is also involved in Reaction 1 and has its own decay rate. |
| Line 57: | Line 57: | ||
| - | To describe the phosphorylation cascade we based our expressions on the model that Liu et al. | + | To describe the phosphorylation cascade, we based our expressions on the model that Liu et al. developed in 2012. LuxU and LuxO are both involved in enzymatic reactions 2-5, both are produced by a constitutive promoter at a rate a_u and a_o respectively, and each molecule has its own decay rate. Taking this into account, equations c-f were constructed. |
<b><font color="#8A0808" size="3" >Response → </font></b> | <b><font color="#8A0808" size="3" >Response → </font></b> | ||
| - | LuxO controls | + | LuxO controls promoter Pqrr. Downstream of this promoter we find TetR, which represses tetracycline promoter (pTet) downstream. This promoter controls production of a visible color output and the activator of the promoter TetA. |
| Line 72: | Line 72: | ||
| - | LuxO controls the production of TetR and it can be expressed with a Hill type equation where | + | LuxO controls the production of TetR and it can be expressed with a Hill type equation where phosphorylated LuxO is the activator. The promoter has a small constitutive production rate alpha tr and TetR has a decay rate of gamma tr. TetR is consumed when it forms a dimer in order to repress pTet. |
[[File: EqI.png|center|680px]] | [[File: EqI.png|center|680px]] | ||
| Line 81: | Line 81: | ||
| - | Equations i and j describe the production of the | + | Equations i and j describe the production of the output and pTet activator. As in all previous equations, both proteins have a constitutive production and decay rate. In our design, there is a promoter (pTet) with a unique operator sequence (TetO) where the repressor (TetR2) and the activator (tTA) bind (TetR2 and tTA have the same binding domain). For this reason, it was necessary to propose a mathematical expression in which the repressor and the activator compete for the binding site. |
| Line 87: | Line 87: | ||
| - | Before we established the | + | Before we established the above equations, we tried different versions of the systems. In order to get the desired response for our <i> S. coli </i>, we needed to find the right circuit. In this section, we will be showing how we did this, step by step. |
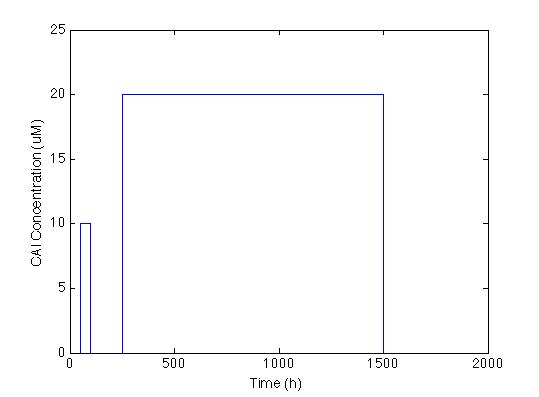
| - | The first we did | + | The first thing we did was to establish the desired response. We wanted the system to react with a low and longlasting concentration of CAI. The figure below shows the impulse we used to test the system: two pulses with different concentrations and durations. |
[[File: Colombia_Test1.png|center|400px]] | [[File: Colombia_Test1.png|center|400px]] | ||
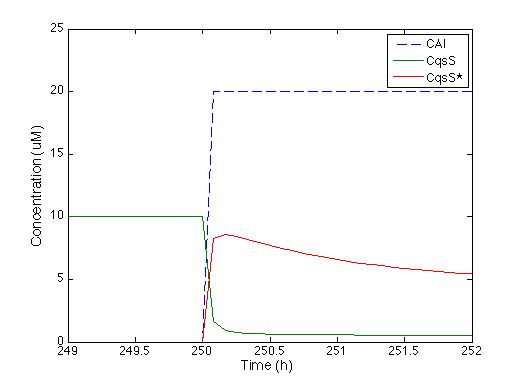
| - | We knew that the equations of the CqsS protein | + | We knew that the equations of the CqsS protein behavior are right because they were previously reported by Lelu et al (2012). Therefore, we needed to check that behavior. The figure below shows the answer of CqsS with CAI. |
[[File: Colombia_Test2.png|center|450px]] | [[File: Colombia_Test2.png|center|450px]] | ||
| - | As soon as the CAI molecule is present | + | As soon as the CAI molecule is present, CqsS concentration is instantly decreased, and CqsS* (which stands for the CAI bound with the CqsS protein) increases. After half an hour, the concentration of CqsS starts to decrease because it is consumed by LuxU, just the way it’s supposed to. |
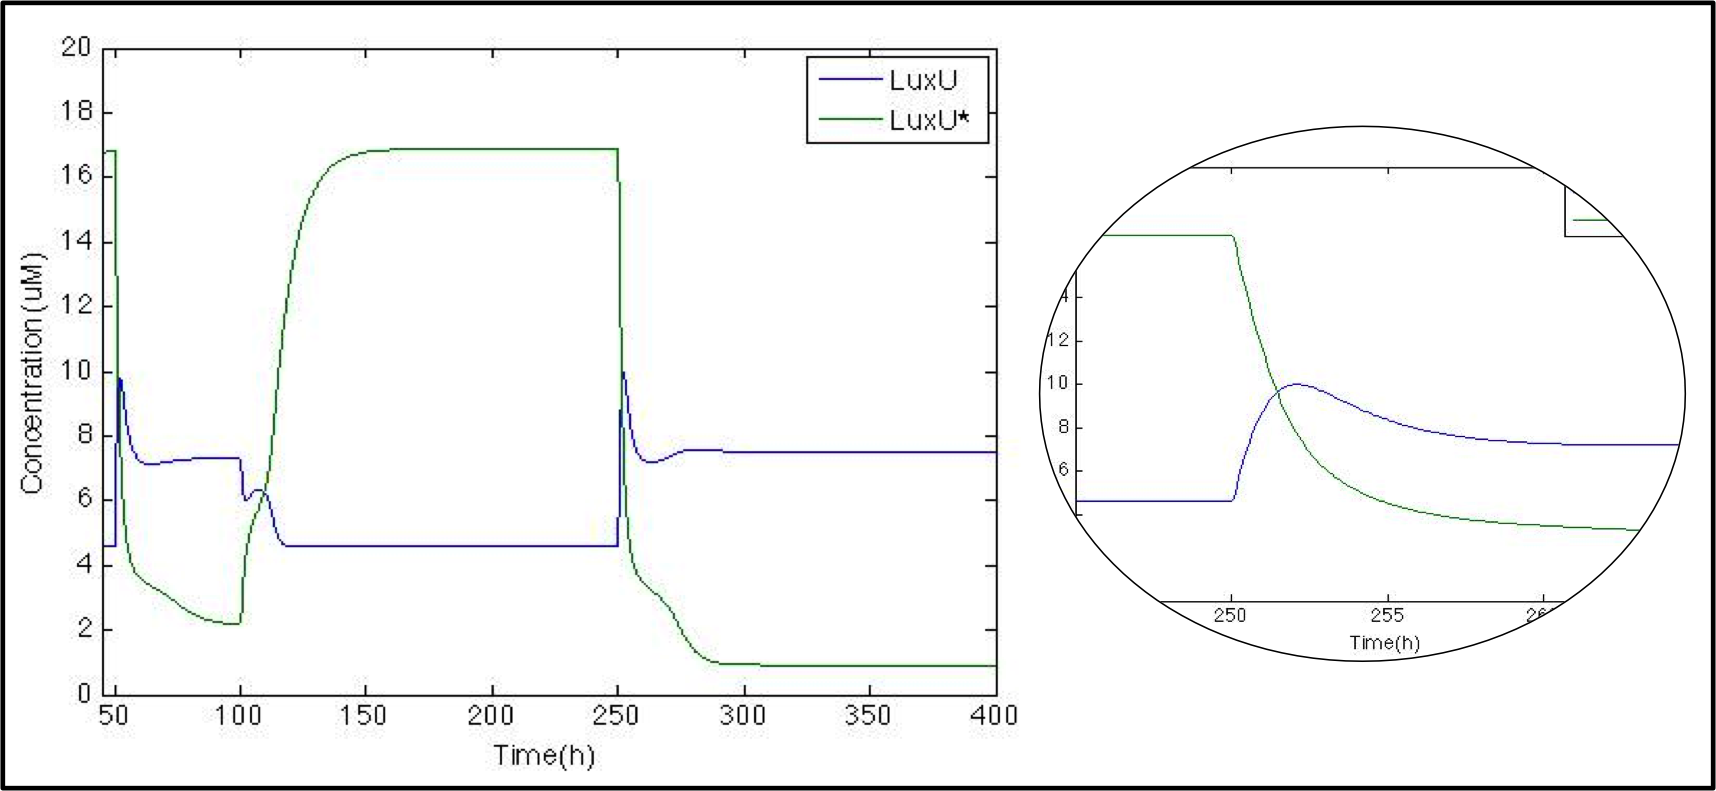
| - | The next step is to check what happens with LuxU and its phosphorylated version. Now that we know that | + | The next step is to check what happens with LuxU and its phosphorylated version. Now that we know that CqsS is modeled properly, we want to check the phosphorylation/phosphatase cascade. As with CqsS, this molecule has already been modeled by Lelu et al (2012). |
[[File: Colombia_Test3.png|center|550px]] | [[File: Colombia_Test3.png|center|550px]] | ||
| - | Just as expected whenever | + | Just as expected, whenever CAI is present (50h-100h and 250h) LuxU is greater than LuxU* due to the phosphatase function of CqsS*. At the beginning, we can see a peak in LuxU concentration. Because of Le Chatelier's principle, the reaction tends to go forward. After 3 hours, LuxU stabilizes itself thanks to the phosphorylation reaction. |
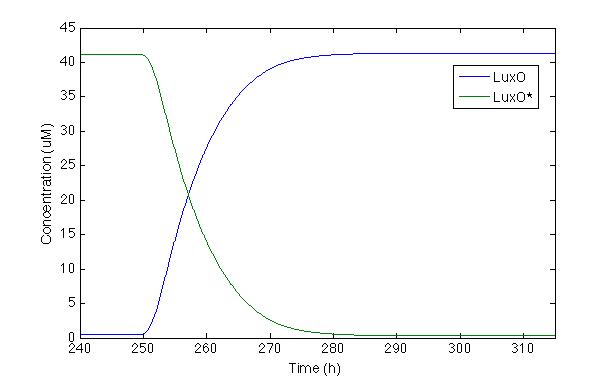
| - | Now let’s check LuxO and its phosphorylated version. Even | + | Now, let’s check LuxO and its phosphorylated version. Even though this part of the cascade was modeled by Lelu et al, we did no take into account some of the regulation routes they did such as miRNA, because our system does not have them. We wanted to check the response of the most important molecule from the cascade |
[[File: Colombia_Test4.png|center|450px]] | [[File: Colombia_Test4.png|center|450px]] | ||
| - | The first time we | + | The first time we modeled the system, LuxO response was slower than we wanted. Because of this, we changed the Hill constant coefficient proposed by Lelu et al. in order to make the response time faster and longer. This change compensates the lack of negative feedback caused by miRNA that is present in <i>V. cholera </i> but not in our <i> Sherlock coli</i>. |
| - | With this modification we can see that the systems takes 20 hours to react | + | With this modification we can see that the systems takes 20 hours to react. Furthermore, after 30h, the production of LuxO is completely activated and LuxO* is almost zero, which is desirable because we do not want any phosphorylated LuxO to turn on promoter Pqrr4. |
| - | So far the model is working great, and all this | + | So far, the model is working great, and all this section corresponds to the parts registered by [https://2011.igem.org/Team:Peking_S Peking 2011 Team]. What we are really interested in, though, is the response signal, and we want to see if <i>S. coli </i> would be able to shows us when <i> V. cholerae </i> is in the medium. Given that when CAI is in the medium, promoter Pqrr4 turns off, we need a NOT logical gate to invert the transduction, so we used a pTet-TetR system. |
[[File: Colombia_Test5.png|center|600px]] | [[File: Colombia_Test5.png|center|600px]] | ||
| - | When CAI is present in the | + | When CAI is present in the medium, TetR production turns off, which can be seen as a small change in TetR concentration. Even though the change is small, it is enough to decrease the dimer concentration by a factor of 10. |
| - | + | It is now time to see if this decrease is enough to turn on the production of the signal. When TetR is produced, it dimerises and represses pTet and the chromoprotein gene found downstream. Using the Hill equation for repression we have that the response equation is: | |
[[File: EqJ1.png|center|680px]] | [[File: EqJ1.png|center|680px]] | ||
| - | After running the model we | + | After running the model we found the figure below: |
[[File: Colombia_Test6.png|center|400px]] | [[File: Colombia_Test6.png|center|400px]] | ||
| - | Even | + | Even though chromoprotein increases by 500%, maximum concentration is less than 10uM, which makes it difficult to see without a microscope. So we decided to change the model and add a positive feedback loop. |
| - | At first we thought of using the same promoter <b> pTet </b> which has an activator protein <b> TetA </b>. In this case the promoter and the activator compete for the DNA binding site, so the expression for the system is: | + | At first we thought of using the same promoter as before, <b> pTet </b>, which has an activator protein called <b> TetA </b>. In this case, the promoter and the activator compete for the DNA binding site, so the expression for the system is: |
[[File: EqJ.png|center|650px]] | [[File: EqJ.png|center|650px]] | ||
| - | In order to have more options we | + | In order to have more options, we tried the system with another positive feedback: <b> Psp3 </b> with <b> pag </b> promoter from the [https://2009.igem.org/Team:Cambridge Cambridge 2009 Team]. In this case, the activator and repressor have different DNA binding sites, so the expression for the change in the response through time is: |
[[File: EqJ2.png|center|650px]] | [[File: EqJ2.png|center|650px]] | ||
| - | The | + | The figure below shows how the system will behave if positive feedback is added to the circuit. On the left is the response of <i> Sherlock coli </i> if the Psp3 protein is used as an activator. We can see that the chromoprotein concentration will be adequate for the system, but basal production is high compared with the maximum production. |
| - | On the other hand | + | On the other hand, response with TetA has a higher chromoprotein concentration, and the increase when CAI is in the medium is 12 times greater than the basal concentration. This is exactly what we wanted!!! |
[[File: Colombia_Test7.png|center|600px]] | [[File: Colombia_Test7.png|center|600px]] | ||
| - | We chose the system with a positive feedback that includes | + | We chose the system with a positive feedback that includes activator TetA. The figure below shows how the system behaves with the two impulses. We can see that <i> Sherlock coli </i> takes about 20h to start producing the chromoprotein and 72h to reach its maximum expression. |
[[File: Colombia_Test8.png|center|600px]] | [[File: Colombia_Test8.png|center|600px]] | ||
| + | In order to get this behavior, we needed to find the right set of parameters. You can check the [https://2014.igem.org/Team:Colombia/Parameters Parameters Section] to understand how we did it. | ||
| + | <html> | ||
| + | <center> | ||
| + | <div class="button-fill orange" ><div class="button-text"> Back to modeling</div><div class="button-inside"><div class="inside-text"><a style="text-decoration: none; background-color: none; color: red;" href="https://2014.igem.org/Team:Colombia/Modeling">Go! </a></div></div></div> | ||
| + | </center> | ||
| + | <script> | ||
| + | $(".button-fill").hover(function () { | ||
| + | $(this).children(".button-inside").addClass('full'); | ||
| + | }, function() { | ||
| + | $(this).children(".button-inside").removeClass('full'); | ||
| + | }); | ||
| + | //@ sourceURL=pen.js | ||
| + | </script> | ||
| + | </html> | ||
<br><br><br><br> | <br><br><br><br> | ||
Latest revision as of 03:05, 18 October 2014
Deterministic model
Finding the mean behaviour of the system...
The first step is to develop a deterministic model based on differential equations. Ordinary differential equations allow us to quantitatively describe the system at the molecular level.
Using the law of mass action, it is possible to model most metabolic networks. We express the changes of concentration trough time for every substance in the system. We consider processes related to molecule export and import processes across the cell membrane or peptide production by a given gene or through a chemical reaction. All these terms depend on reaction kinetics that can be expressed as a simple multiplication or a complex expression, like a Hill equation.
Signal transduction →
The receptor CqsS acts as a kinase when there is no auto inducer (CAI). It phosphorylates LuxU, which transfers its phosphate to LuxO. In our case, phosphorylated LuxO activates promoter Pqrr.
Once the inducer is in the medium the receptor changes to phosphatase (CqsSp) mode and the flow is reversed. When LuxU is dephosphorylated, it removes the phosphate from LuxO. In consequence, promoter Pqrr is repressed.
Taking this process into account and given the fact the phosphorylation process can be described as an enzymatic process, we used the Mass Action Law and Michaelis-Menten Kinetics in order to obtain the mathematical expressions that describe signal transduction:
Equations a and b describe the behavior of the receptor acting as a kinase (CqsS) and as a phosphatase (CqsSP). The kinase is produced at a constant rate alpha CS, is involved in Reaction 1, and has a decay rate of Gamma CS. The phosphatase is also involved in Reaction 1 and has its own decay rate.
To describe the phosphorylation cascade, we based our expressions on the model that Liu et al. developed in 2012. LuxU and LuxO are both involved in enzymatic reactions 2-5, both are produced by a constitutive promoter at a rate a_u and a_o respectively, and each molecule has its own decay rate. Taking this into account, equations c-f were constructed.
Response →
LuxO controls promoter Pqrr. Downstream of this promoter we find TetR, which represses tetracycline promoter (pTet) downstream. This promoter controls production of a visible color output and the activator of the promoter TetA.
LuxO controls the production of TetR and it can be expressed with a Hill type equation where phosphorylated LuxO is the activator. The promoter has a small constitutive production rate alpha tr and TetR has a decay rate of gamma tr. TetR is consumed when it forms a dimer in order to repress pTet.
Equations i and j describe the production of the output and pTet activator. As in all previous equations, both proteins have a constitutive production and decay rate. In our design, there is a promoter (pTet) with a unique operator sequence (TetO) where the repressor (TetR2) and the activator (tTA) bind (TetR2 and tTA have the same binding domain). For this reason, it was necessary to propose a mathematical expression in which the repressor and the activator compete for the binding site.
Before we established the above equations, we tried different versions of the systems. In order to get the desired response for our S. coli , we needed to find the right circuit. In this section, we will be showing how we did this, step by step.
The first thing we did was to establish the desired response. We wanted the system to react with a low and longlasting concentration of CAI. The figure below shows the impulse we used to test the system: two pulses with different concentrations and durations.
We knew that the equations of the CqsS protein behavior are right because they were previously reported by Lelu et al (2012). Therefore, we needed to check that behavior. The figure below shows the answer of CqsS with CAI.
As soon as the CAI molecule is present, CqsS concentration is instantly decreased, and CqsS* (which stands for the CAI bound with the CqsS protein) increases. After half an hour, the concentration of CqsS starts to decrease because it is consumed by LuxU, just the way it’s supposed to.
The next step is to check what happens with LuxU and its phosphorylated version. Now that we know that CqsS is modeled properly, we want to check the phosphorylation/phosphatase cascade. As with CqsS, this molecule has already been modeled by Lelu et al (2012).
Just as expected, whenever CAI is present (50h-100h and 250h) LuxU is greater than LuxU* due to the phosphatase function of CqsS*. At the beginning, we can see a peak in LuxU concentration. Because of Le Chatelier's principle, the reaction tends to go forward. After 3 hours, LuxU stabilizes itself thanks to the phosphorylation reaction.
Now, let’s check LuxO and its phosphorylated version. Even though this part of the cascade was modeled by Lelu et al, we did no take into account some of the regulation routes they did such as miRNA, because our system does not have them. We wanted to check the response of the most important molecule from the cascade
The first time we modeled the system, LuxO response was slower than we wanted. Because of this, we changed the Hill constant coefficient proposed by Lelu et al. in order to make the response time faster and longer. This change compensates the lack of negative feedback caused by miRNA that is present in V. cholera but not in our Sherlock coli.
With this modification we can see that the systems takes 20 hours to react. Furthermore, after 30h, the production of LuxO is completely activated and LuxO* is almost zero, which is desirable because we do not want any phosphorylated LuxO to turn on promoter Pqrr4.
So far, the model is working great, and all this section corresponds to the parts registered by Peking 2011 Team. What we are really interested in, though, is the response signal, and we want to see if S. coli would be able to shows us when V. cholerae is in the medium. Given that when CAI is in the medium, promoter Pqrr4 turns off, we need a NOT logical gate to invert the transduction, so we used a pTet-TetR system.
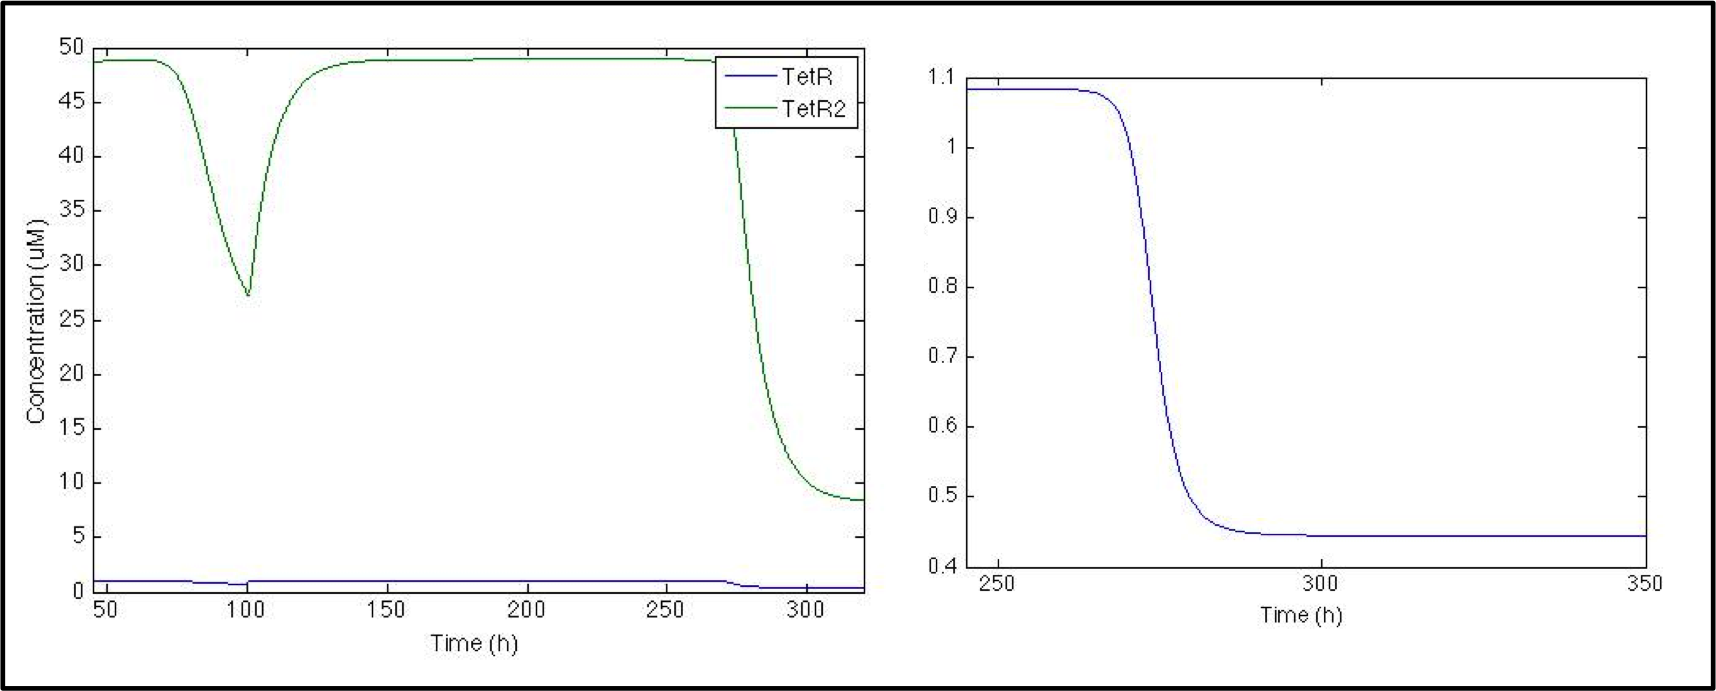
When CAI is present in the medium, TetR production turns off, which can be seen as a small change in TetR concentration. Even though the change is small, it is enough to decrease the dimer concentration by a factor of 10.
It is now time to see if this decrease is enough to turn on the production of the signal. When TetR is produced, it dimerises and represses pTet and the chromoprotein gene found downstream. Using the Hill equation for repression we have that the response equation is:
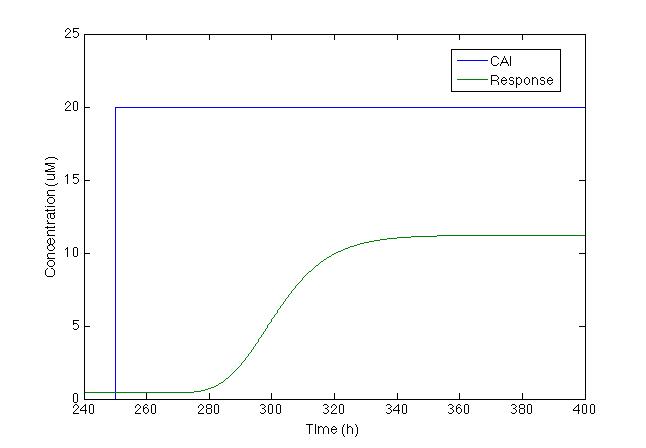
After running the model we found the figure below:
Even though chromoprotein increases by 500%, maximum concentration is less than 10uM, which makes it difficult to see without a microscope. So we decided to change the model and add a positive feedback loop.
At first we thought of using the same promoter as before, pTet , which has an activator protein called TetA . In this case, the promoter and the activator compete for the DNA binding site, so the expression for the system is:
In order to have more options, we tried the system with another positive feedback: Psp3 with pag promoter from the Cambridge 2009 Team. In this case, the activator and repressor have different DNA binding sites, so the expression for the change in the response through time is:
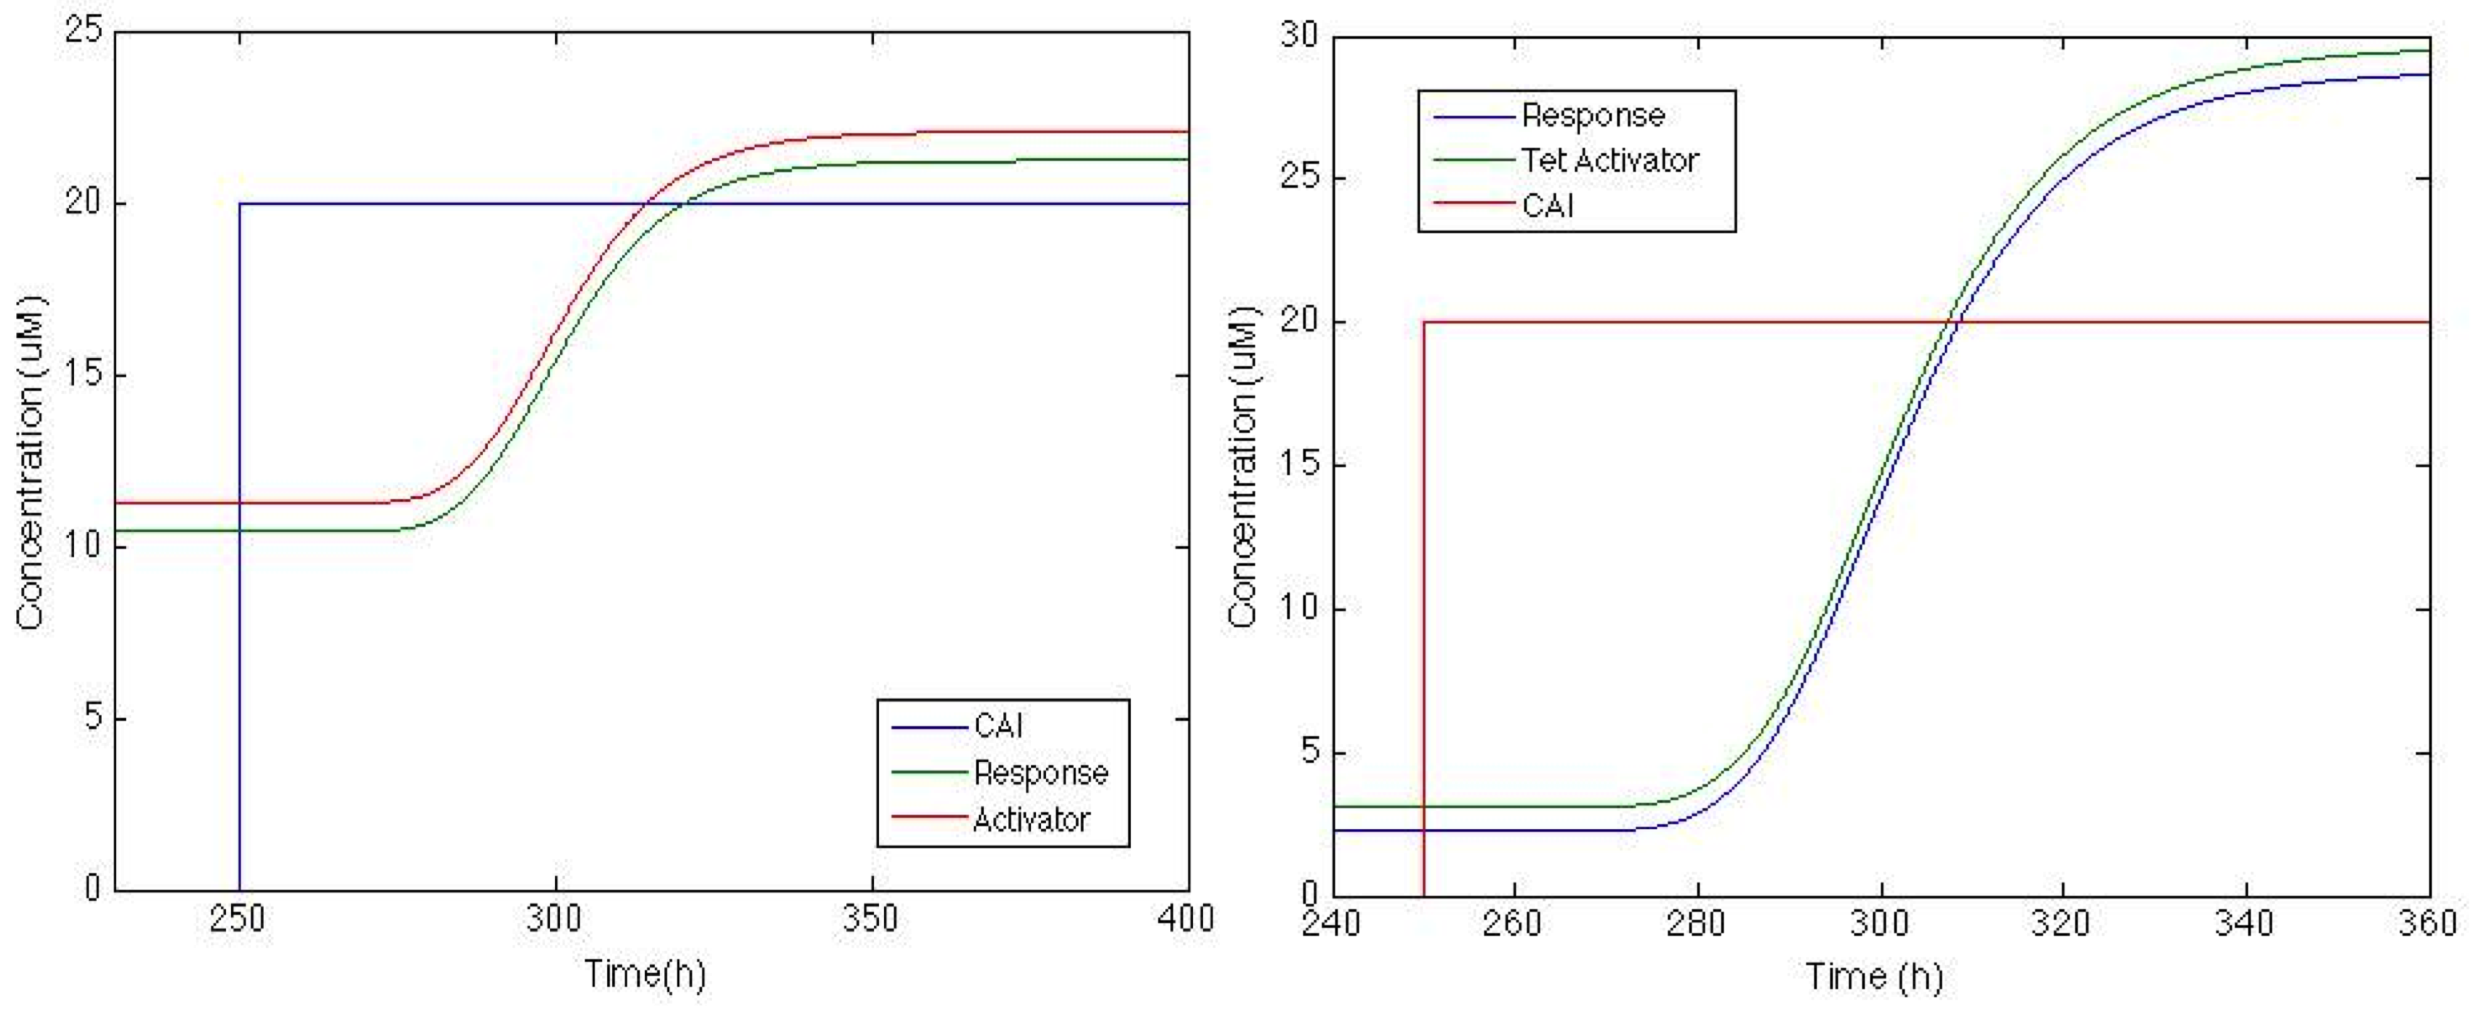
The figure below shows how the system will behave if positive feedback is added to the circuit. On the left is the response of Sherlock coli if the Psp3 protein is used as an activator. We can see that the chromoprotein concentration will be adequate for the system, but basal production is high compared with the maximum production.
On the other hand, response with TetA has a higher chromoprotein concentration, and the increase when CAI is in the medium is 12 times greater than the basal concentration. This is exactly what we wanted!!!
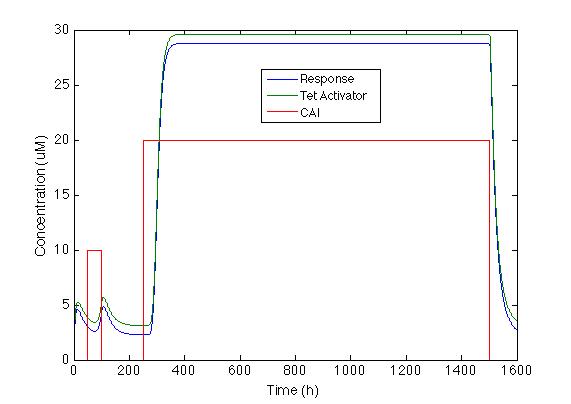
We chose the system with a positive feedback that includes activator TetA. The figure below shows how the system behaves with the two impulses. We can see that Sherlock coli takes about 20h to start producing the chromoprotein and 72h to reach its maximum expression.
In order to get this behavior, we needed to find the right set of parameters. You can check the Parameters Section to understand how we did it.
 "
"


