 "
"
Team:Exeter/invivoactivity
From 2014.igem.org
-
Measuring in vivo degredation using Raman spectroscopy
Introduction
Aim
The aim of this experiment was to measure the degradation rate of trinitrotoluene (TNT) and nitroglycerin (NG) in vivo using Raman spectroscopy. The degradation rate of enzymes NemA and XenB when transcribed by an E. coli bacterium will be measured. In addition to the degradation rates, a value for the partition coefficient for TNT and NG between water and the cell membrane was determined.
Raman Spectroscopy
Raman spectroscopy is a technique used to observe vibrational, rotational and other low frequency modes in a system. It utilises the inelastic scattering of monochromatic light from these low frequency modes by detecting the shift in reflected photon energy. Inelastic scattering occurs where part of the photons energy is transferred to the vibrational state resulting in a lower energy reflected photon. This shift can be used to give information about the types of bonds in the system and how many of these are present.
Typically the inelastically reflected light from the low frequency modes in a system is very weak in comparison to the elastically scattered light from the sample. In the past this had been the major barrier to the wider use of Raman spectroscopy. With recent improvements to band-stop filters the ease of processing the signal from the sample has been greatly improved and as a result Raman spectroscopy has been put to greater use.
Raman spectroscopy was used for this experiment because of its ability to both detect the compounds of interest and give quantifiable values for their concentration. The data obtained in this experiment compliments similar measurements made using high performance liquid chromatography. In addition, this experiment will provide an early indication as to whether this type of spectroscopy is suitable for use on aqueous organic samples.
The partition coefficient
The rate of degradation of the TNT or NG may be limited by the rate of diffusion across E. coli's double lipid membrane. Michaelis-Menten kinetics tell us that rate of reaction is proportional to the concentration of enzyme and, at low concentrations, proportional to the concentration of the compound of interest (in this case TNT and NG). If this compound cannot cross the cell's membrane, or the enzyme cannot diffuse outside the cell, then the effectiveness of the designed bacterial system will be greatly impaired.
To determine the rate at which TNT and NG will diffuse across the membrane the partition coefficient must be found. The partition coefficient of a compound is equal to the ratio of compound concentration at the surface of either side of a semi-permeable barrier. In E. coli the barrier is the phospholipid bilayer.
Assembling a lipid bilayer in vitro, from which it is possible to sample on both sides, is technically challenging. Instead the partition coefficient of TNT and NG is measured across the boundary between olive oil and water. There is a close correlation between the partition coefficient of a compound across a phospholipid bilayer and across the olive oil water boundary found by Collander and Barlund in 1930 [1].
Experimental Method
The Standard Curve
In order for the results of any concentration measurement to be analyzed a standard curve of compound concentration versus peak area must be created. To do this the compound is mixed from a known concentration with distilled water to create solutions at a variety concentrations. For nitroglycerin the concentrations were 200, 100, 66.7, 40 and 20 $\mu$gml$^{-1}$.
To measure the spectra of the compound at different concentrations 1 μl of the solution was placed onto an aluminium slide. The slide was placed into the Raman microscope. The microscope acts as the sight for the laser, a cross hair on the microscope mounted camera output shows where the laser will become incident on the droplet.
A 785nm laser was chosen to detect the carbon nitrogen bonds found in nitroglycerin and TNT [3]. The laser was set to a power output of 33 Watts, this was a compromise between peak intensity and preventing large convection currents in the droplet from building up. Inelastic scattering was scanned between wavenumbers of 2000nm$^{-1}$ and 500nm$^{-1}$. Two scans were completed and combined to accentuate any peaks.
Measuring degradation of TNT and NG in vivo
After producing a standard curve the degradation rate of TNT and NG was measured in vivo. To do this TNT and NG where added to cultures of E. coli and the concentrations of the compounds was measured over time. Overnight cultures of Top 10 cells and Top 10 cells with coding sequences for both BBa_K1398001 and BBa_K1398003 were grown. 20 $\mu$l of TNT and nitroglycerin was added to 1978 $\mu$l of overnight culture, 2 $\mu$l of IPTG was added at the same time. 20 $\mu$l of both TNT and nitroglycerin was added to 1980 $\mu$l of Lysogeny Broth to test the background rate of degradation.
50 $\mu$l aliquots were snap frozen in liquid nitrogen. These would be used to expose any degradation that occurs after snap freezing as the concentration in these samples was known. Further samples were snap frozen at regular time intervals after this point. The samples were stored overnight in a -80 $^o$C freezer before being thawed.
All of the samples from a given set were thawed at the same time, the samples were then be measured in chronological order with the time at which the measurements were taken recorded. This was done to increase the time range over which the concentration could be measured.
Thawed cells were centrifuged at 800rpm for 5 minutes. 10 μl of the supernatant was removed. The remainder of the supernatant was discarded. Measurements of both the supernatant and cells were taken to determine if degradation occurred inside the cells.
To take measurements of the cells 2 $\mu$l of the pellet was placed onto an aluminium slide. The sample was spread over the slide in a small rectangle to speed up the evaporation of the remaining supernatant. Watching through the microscope convection currents caused by the remaining supernatant could be seen as ripples moving radially across the monitor. When the convection currents ceased the microscope was re-focused onto the cells and a scan between 1200 cm$^{-1}$ and 600 cm$^{-1}$ was taken for NG. A scan between 1600 cm$^{-1}$ and 1200 cm$^{-1}$ was carried out for TNT samples.
To take measurements in the supernatant 4 $\mu$l of solution was placed onto the aluminium slide. The microscope was focused into the droplet and the scan was started between the same wavenumber used for cells. The scan had to be completed before the droplet evaporated significantly under the laser, as this would cause the microscope to lose focus. This defocussing was the reason for using a larger volume of fluid on the slide.
The partition coefficient
To measure the partition coefficient of NG 6 $\mu$l of the compound was added to 494 $\mu$l of distilled water. 20 $\mu$l of TNT was added to 480 $\mu$l of distilled water. The solutions were vortexed from 30 seconds to mix. 50 $\mu$l of each of the mixtures was pipetted into a separate Eppendorf tube for use in determining the original concentration of the compounds.
450 $\mu$l of olive oil was then added to the mixtures. The oil and water combination was then vortexed for a minute, thoroughly mixing the two immiscible liquids. After an hour the two liquids had fully re-separated. The oil portion was removed into a separate Eppendorf tube.
To take measurements in the water with the original concentration of TNT or NG 4 $\mu$l of solution was placed onto an aluminum slide. The microscope was focused into the droplet and a scan was completed between 2000 cm$^{-1}$ and 500 cm$^{-1}$. This was repeated for both the separated oil and water. A final scan of oil with no added compound was taken between 2000 cm$^{-1}$ and 500 cm$^{-1}$.
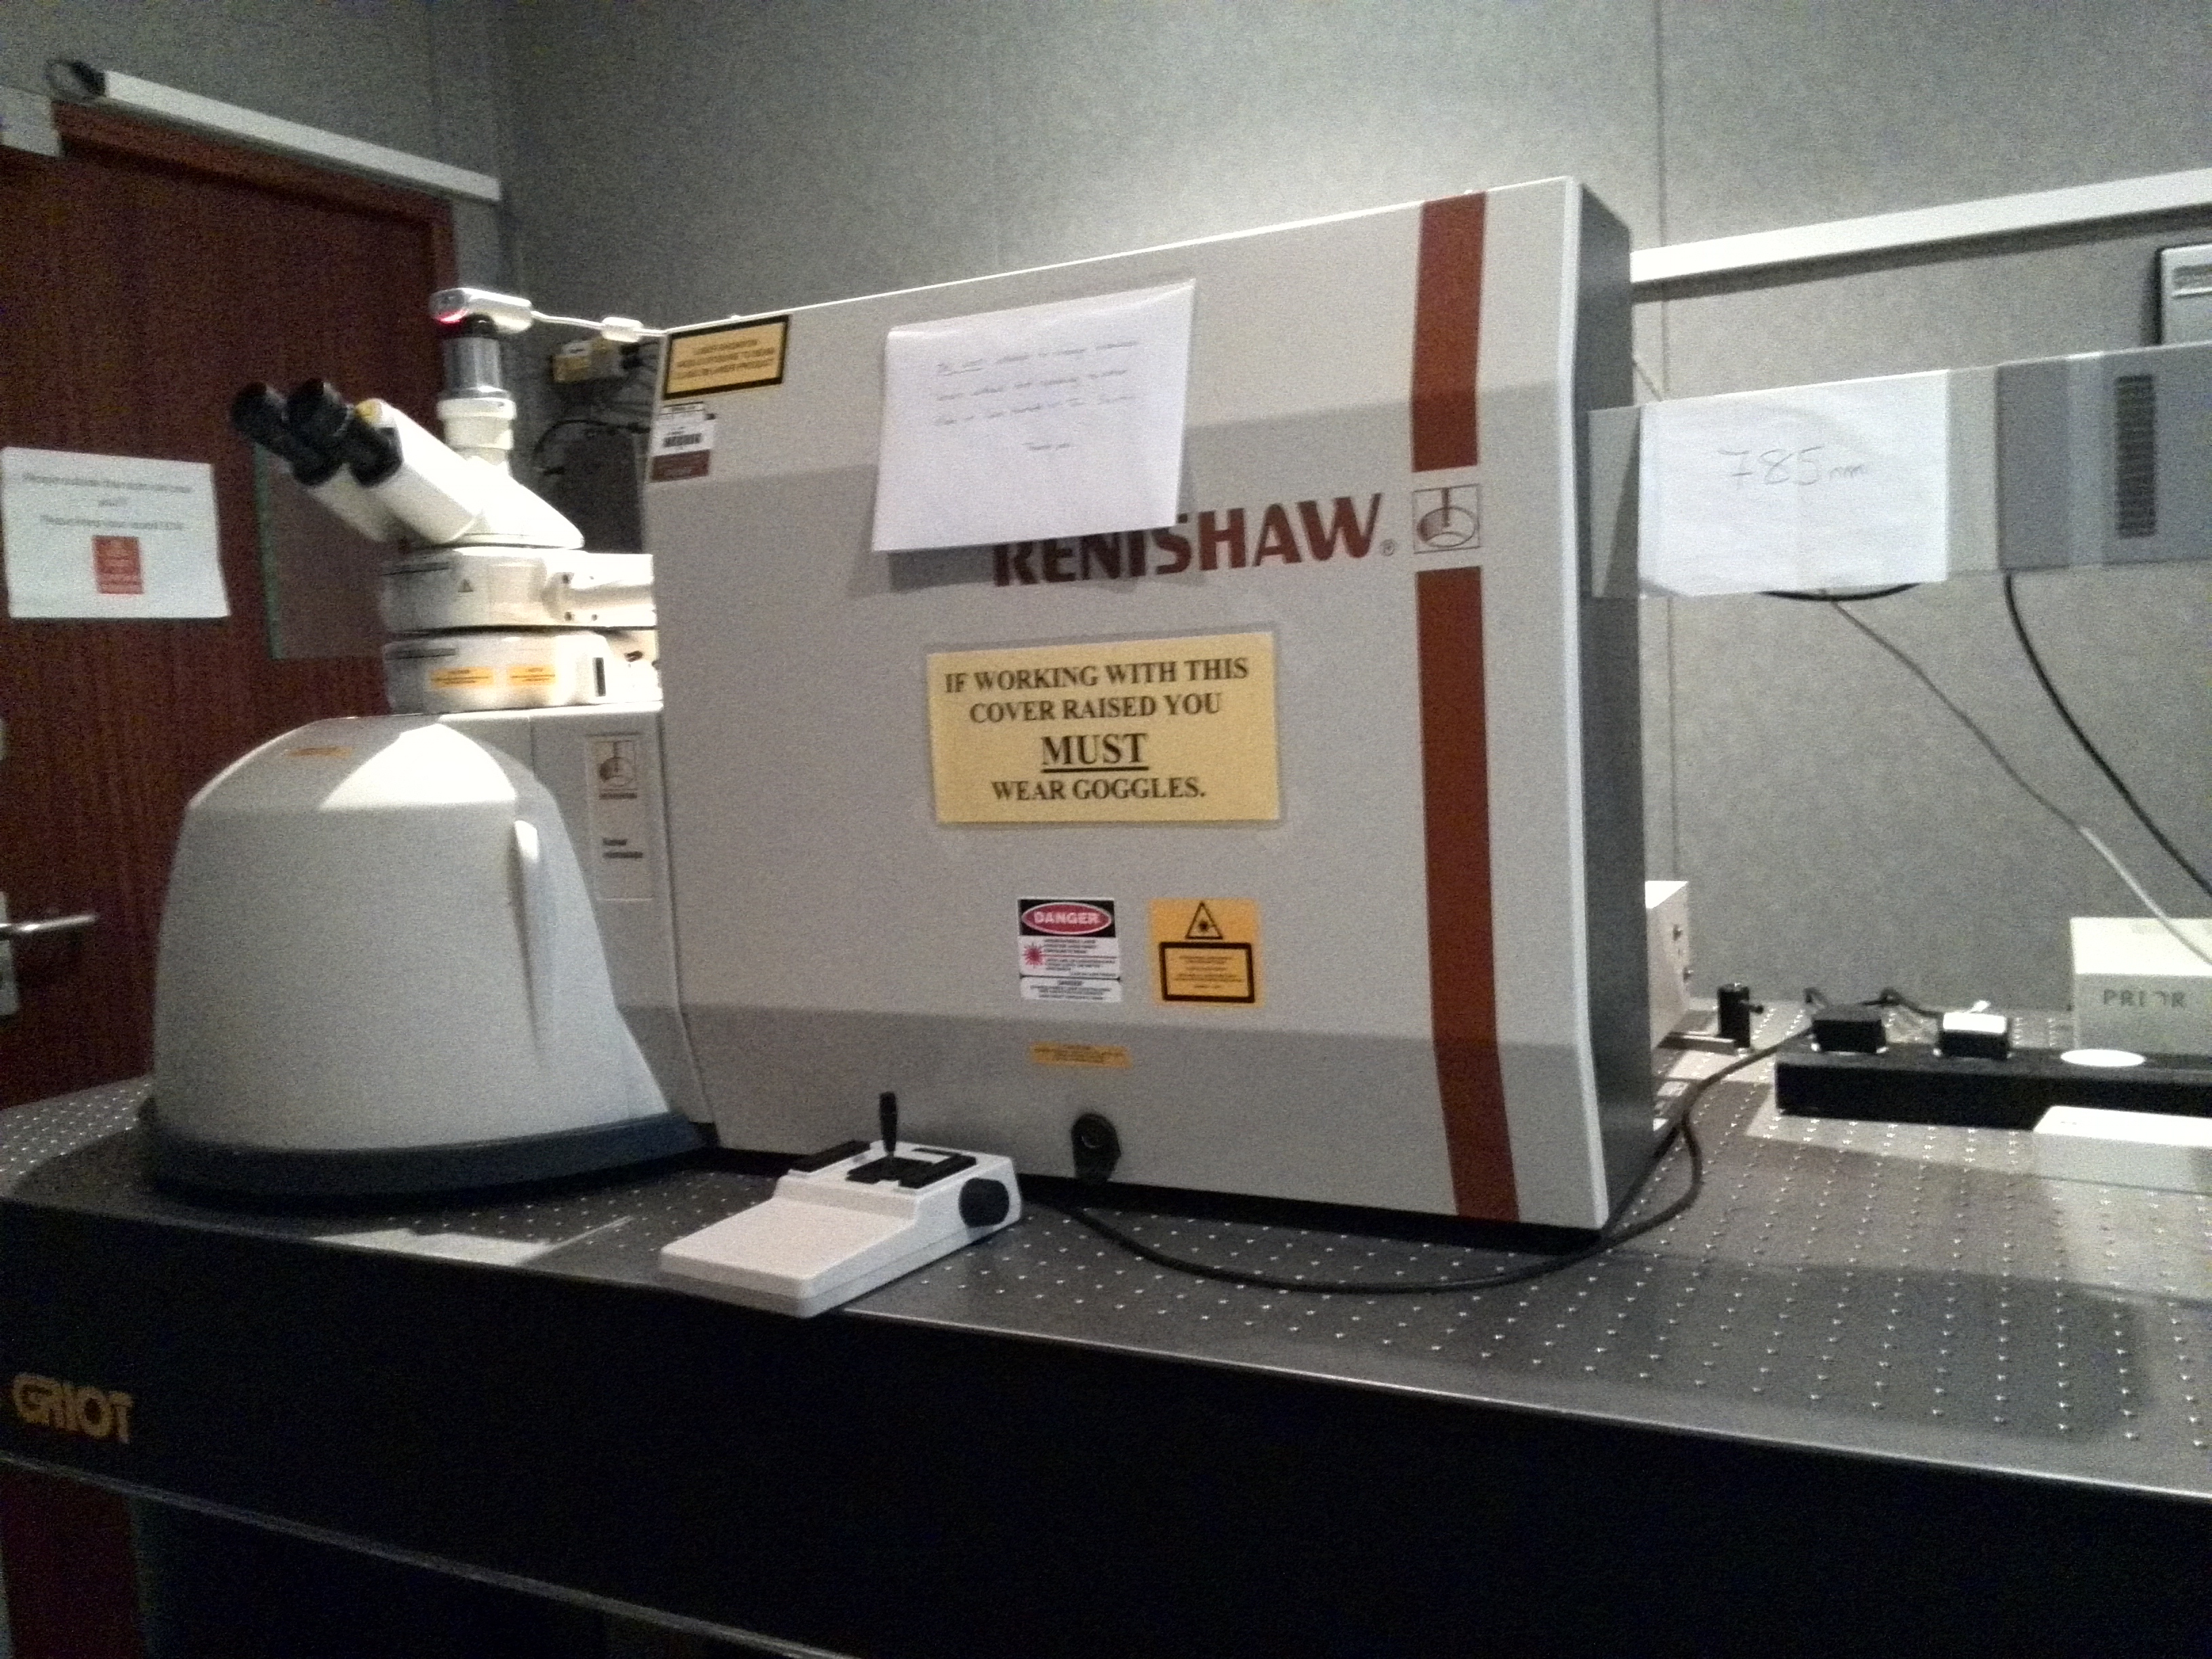
Figue 1: The Raman laser microscope setup. A 785nm laser was used at a power output of 33 Watts. Results, Analysis and discussion
The Raman spectrum of TNT and NG
Figure 2 shows the Raman spectrum of NG and TNT observed using undiluted samples. The NG spectrum agrees with literature spectrum having two high intensity peaks at 800cm$^{-1}$ and 840cm$^{-1}$ [3]. The TNT spectrum corresponds to the literature spectrum [2] with its highest intensity peaks at 820$^{-1}$ and 1360 cm$^{-1}$.
The TNT spectrum has a low intensity in compared to the nitroglycerin. This is to be expected as the nitroglycerin sample was at a higher concentration (2mgml$^{-1}$) than the TNT sample (1mgml$^{-1}$).
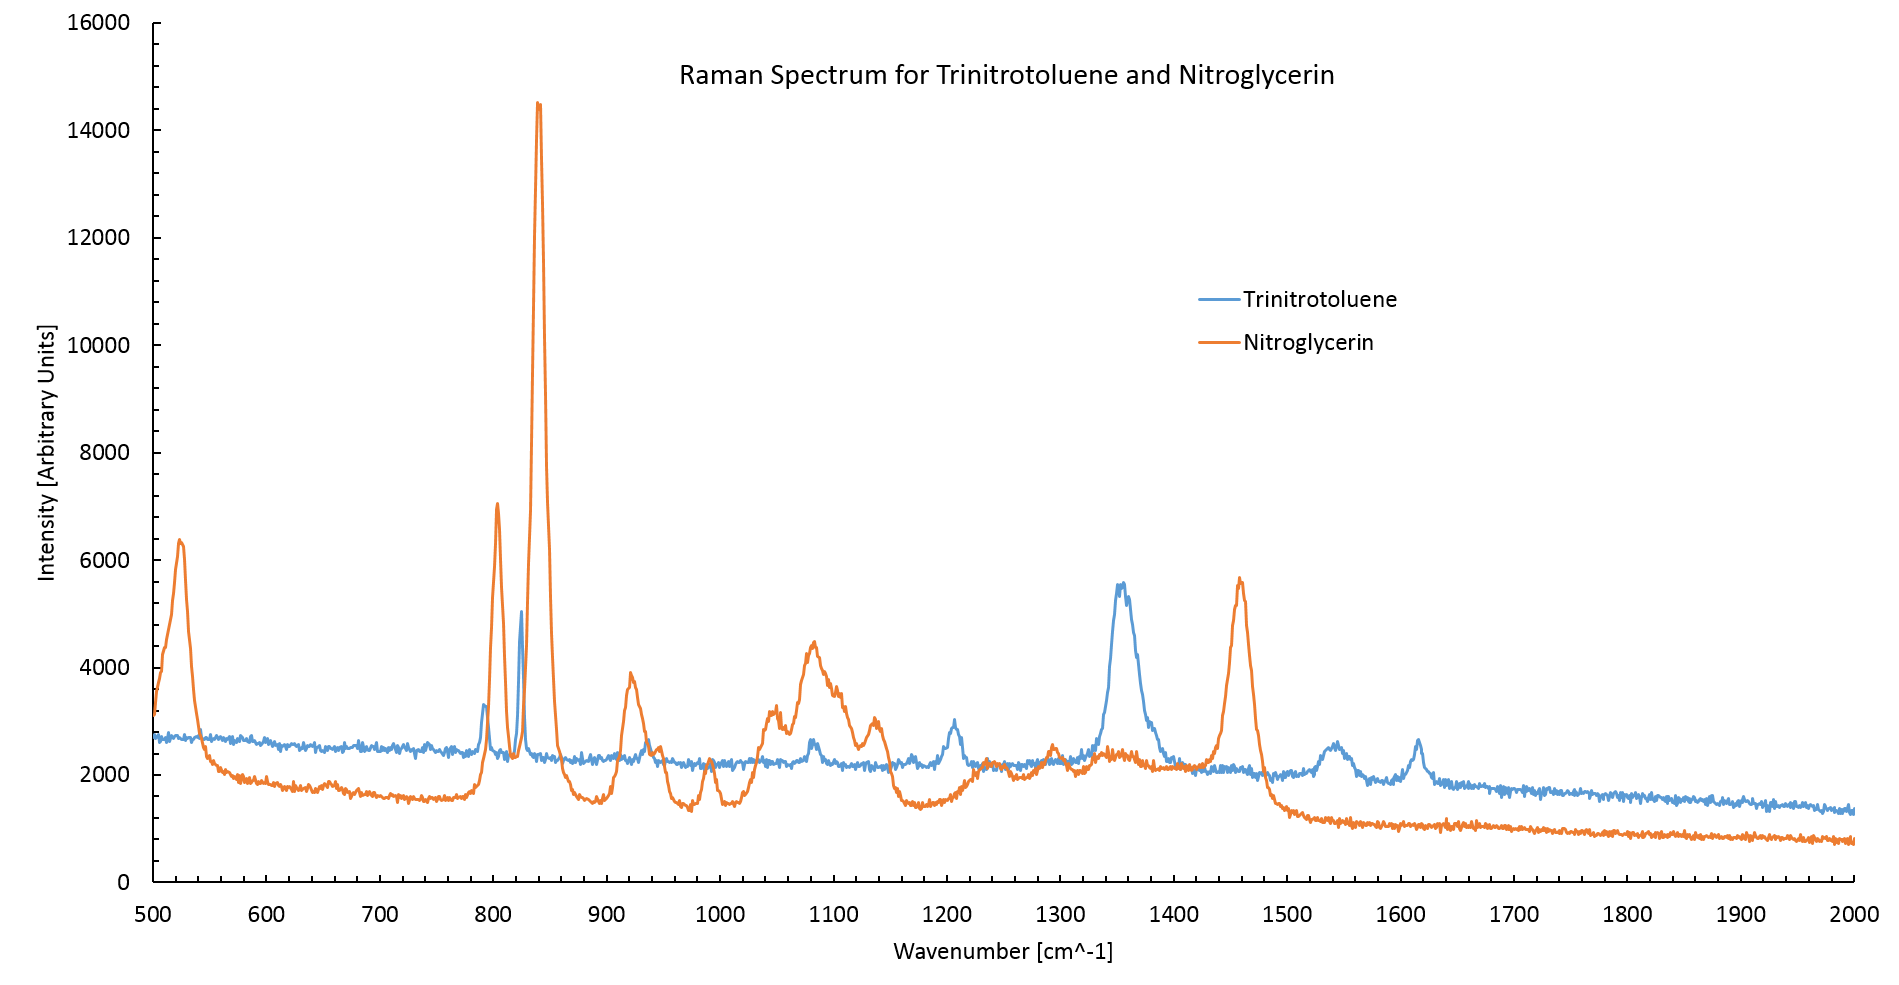
Figure 2: The Raman spectrum of TNT and nitroglycerin. The TNT spectrum agrees with literature values having high intensity peaks at 820cm$^{-1}$ and 1360cm$^{-1}$ [2]. Nitroglycerin also agrees with literature values having two high intensity peaks at 800cm$^{-1}$ and 840cm$^{-1}$[3]. The Standard curve
Figure 3 shows the normalized Raman spectrum for nitroglycerin at various concentrations between the wavenumbers of 850 cm$^{-1}$ and 750 cm$^{-1}$. The spectrum was normalized between 1200 cm$^{-1}$ and 600 cm$^{-1}$ by dividing by the average intensity between these points. The concentration is proportional to the peak area.
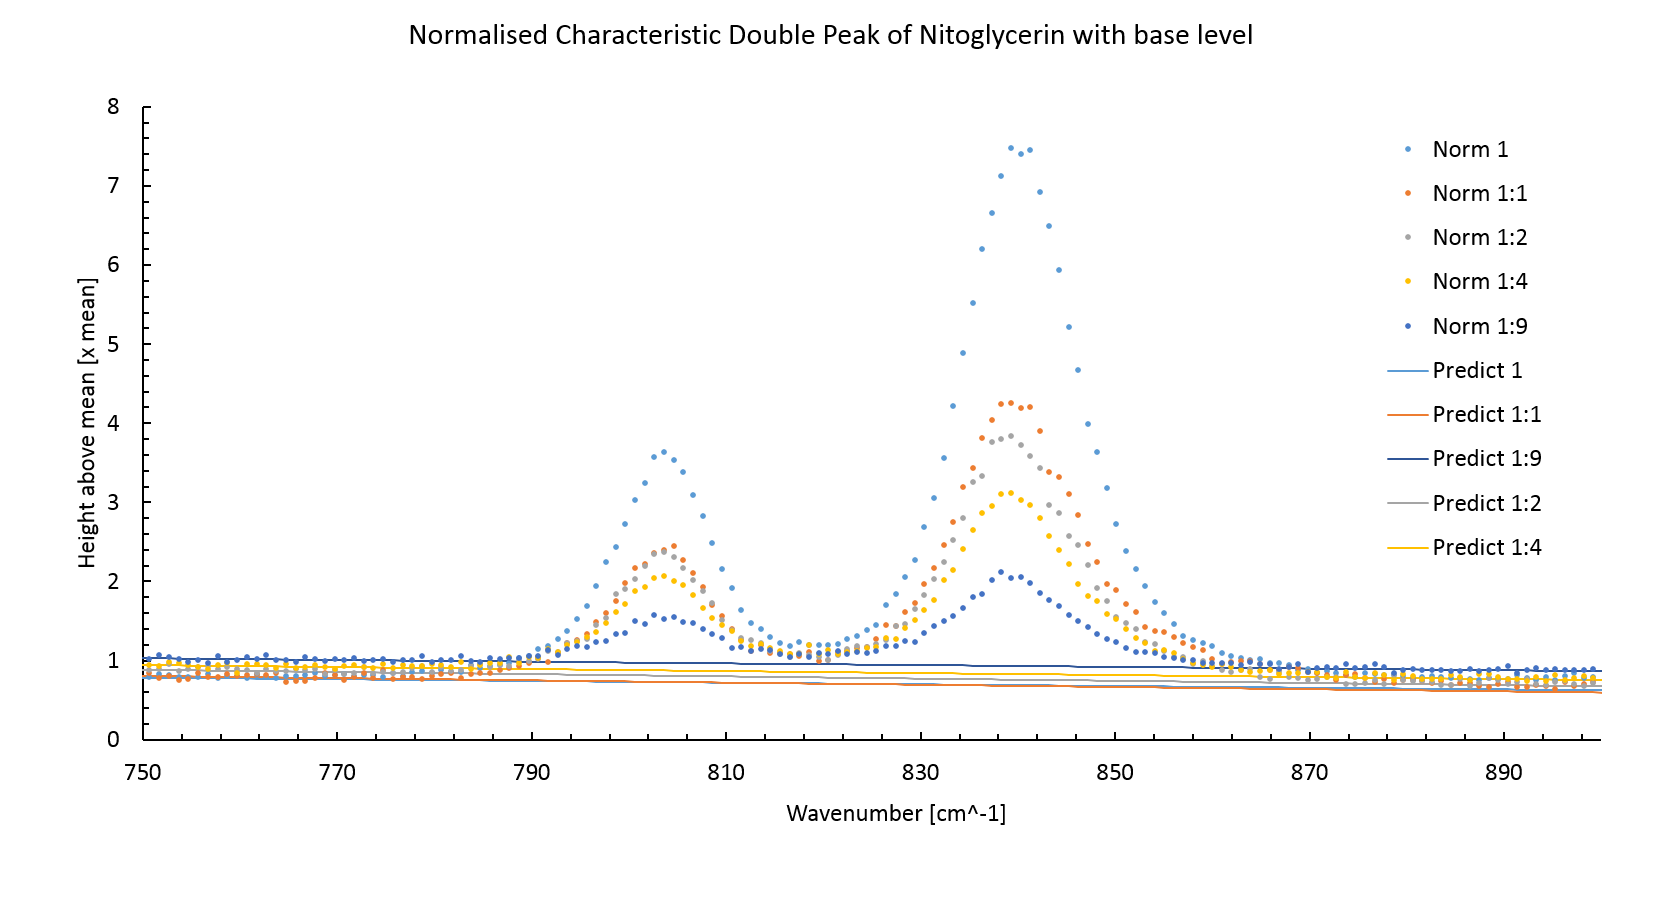
Figure 3: The normalized Raman spectrum for nitroglycerin. The concentration of nitroglycerin is proportional to the peak area. The figure 3 also shows the predicted background intensity level without the peaks. This was made by plotting a least square fitted line through measurements around the peak sites. The background intensity level increases with lower intensity peaks, this is an artifact of normalisation.
Using the predicted background intensity the peak area, and thereby the concentration, can be calculated using the trapezium rule,
\begin{equation} \text{Area} = \sum_i^{N-1} \frac{I_i+I_{i+1}}{2}(k_{i+1}-k_i). \end{equation}Where $I_i$ is the intensity of the $i$th measurement and $k_i$ is the wavenumber of the $i$th measurement.
The peak area is plotted against the concentration of the prepared sample in figure 4. A least square fitted line (Red dashed line) does not intercept the origin of the graph. This error could be due to a systematic error in transferring the nitroglycerin into the dilutions. The stock nitroglycerin solution was quite viscous meaning that some extra nitroglycerin stuck to the outside of the pipette, this would have increased the amount of compound in each dilution.
The error in the NG concentration attempted to account for the difficulty of mixing the correct quantities of NG and water by estimating the quantity of nitroglycerin to be $\pm$ 0.5 $\mu$l. This is probably incorrect as the actual error would be biased towards greater concentrations of nitroglycerin.
Assuming that the peak height must be zero at zero concentration another least square fitted line was plotted, this time fixing the intercept to zero. This line will be used for determining concentrations of NG in future measurements.
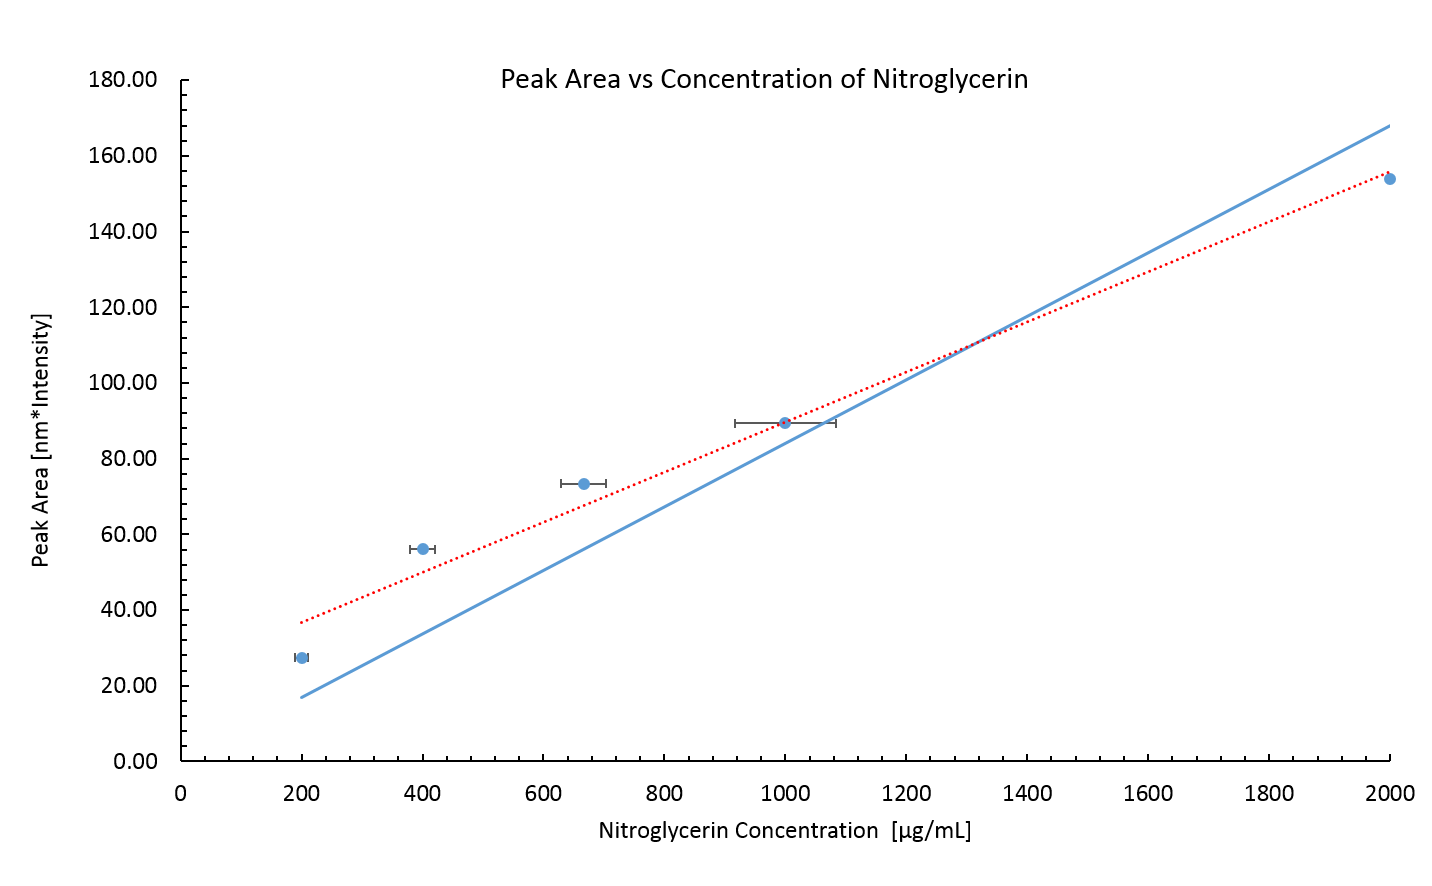
Figure 4: Peak area of Raman spectrum for known concentrations of nitroglycerin. The nitroglycerin concentrations are probably lower than the real values due to a systematic error incurred by the viscosity of the stock nitroglycerin solution. The error in the peak area is small, it is calculated via,
\begin{equation} \delta \text{Area} = \sigma \langle k_{i+1}-k_i \rangle \sqrt{\frac{N}{2}}, \end{equation}where $\sigma$ is the standard deviation from the predicted background intensity of the background intensity measurements. $\langle k_{i+1}-k_i \rangle$ is the average wavenumber gap between measurements and $N$ is the number of measurements. The error in the peak area diverges from the measured area considerably for the large numbers of measurements used to calculate it.
No standard curve for TNT was made. TNT was found to be immiscible with water resulting in extremely variable peak intensities when measuring TNT/water samples. This was likely due to the TNT forming a layer on top of the water, when part this layer was deposited onto the slide the concentration would be unexpectedly high. However for most measurements only the water part of the sample would be placed onto the slide resulting in no peaks.
Due to the immiscibility of TNT and water, measurements of TNT's concentration in vivo and its partition coefficient could not be made.
Measuring NG degradation in vivo
Figure 5 shows the normalized spectrum of E. coli cells containing construct BBa_K1398003 with added nitroglycerin for four of the time points at which samples were snap frozen. The immediate difference between these spectra and the two spectra in figure 2 is presence of a large fluorescence background intensity caused by the organic material in the cells.
Auto-florescence is a large problem in the analysis of organic materials using Raman spectroscopy. It is often alleviated by using a longer wavelength laser, however Raman scattering intensity is inversely proportional to the fourth order of the excitation wavelength [4] as such the sensitivity of measurements would be dramatically reduced making this option only applicable to large concentrations of sample material. The concentration of the NG that was used in this experiment was approaching the limit of resolution as such this option was not available.
The inset shows how the background line for measurement of peak area was determined. A least square fitted line was plotted for measurements around the peaks. The Peak area was then measured as the space between this predicted line and the peak. Only the peak centered around 840 nm was used in calculations of peak area as the lower wavenumber peak was not visible for the lowest concentration spectrum.
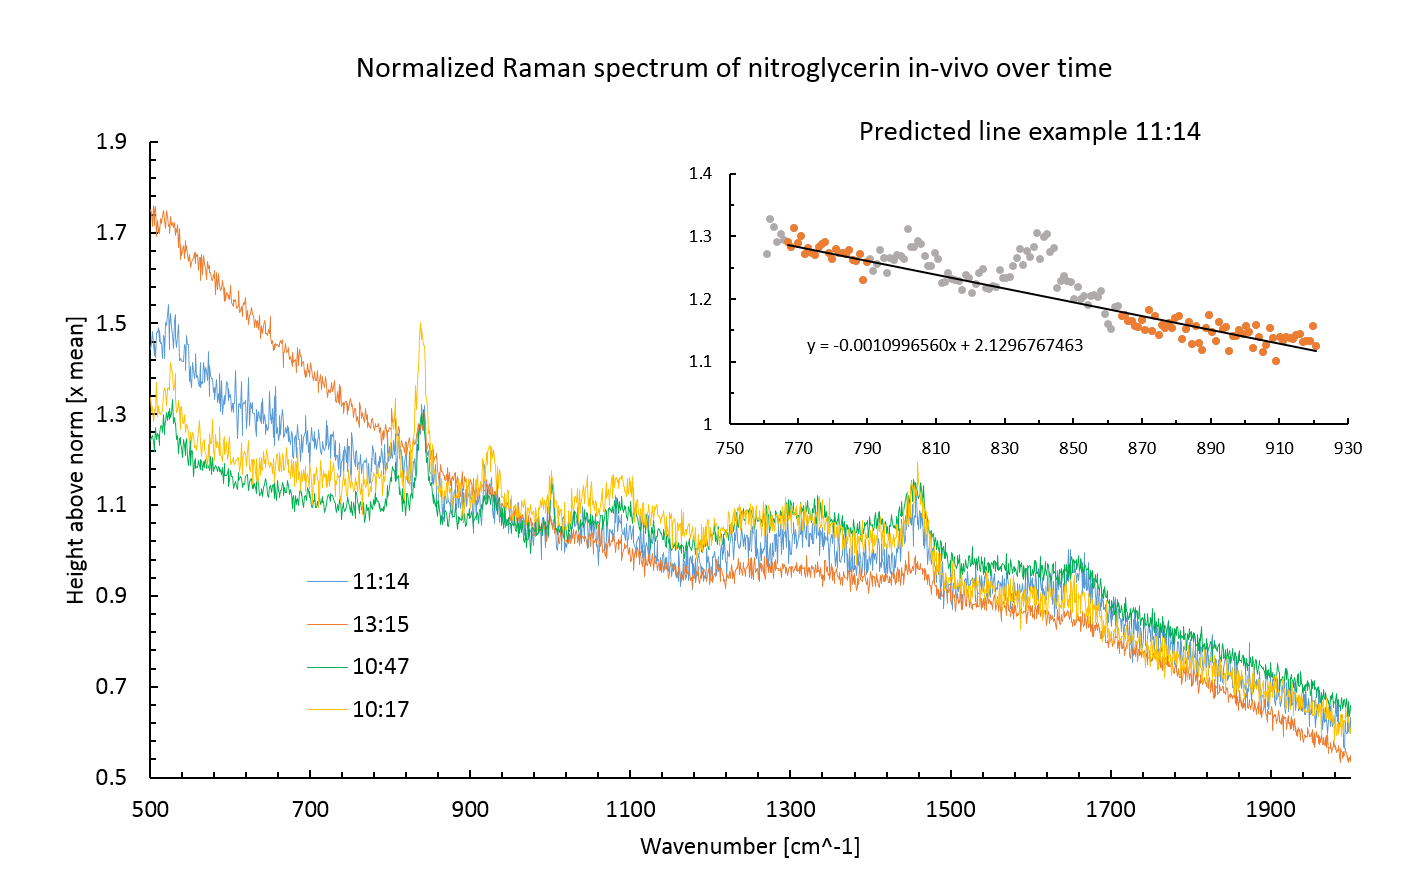
Figure 5: Raman spectrum for Nitroglycerin in E. coli. The large auto-fluorescence posed a significant problem in analyzing the results of the experiment. The inset shows how this auto-florescence was removed when calculating peak area. No nitroglycerin was detected in the supernatant. This may have been a result of centrifuging process to separate the supernatant from the cells or some unknown influx process. There was an auto-fluorescence background interference present in the supernatant spectra, probably due to organic products excreted by the cells.
Figure 6 shows the nitroglycerin concentration for four of the time points at which the samples where snap frozen. The samples were all taken in the presence of E. coli expressing the XenB enzyme. With only four plot points taken at the limit of resolution and no standard plot made (For native E. coli) it is impossible to make any conclusion based solely off this result.
Only four of the cell samples were measured due to extensive time taken to make measurements in vivo. Multiple measurements had to be made on each sample as only the fluorescence background intensity was seen whilst the supernatant was evaporating. After the evaporation of the supernatant a spectrum could be acquired. However the spectra had large background intensities making it difficult to determine by eye whether the scan had been successful or would have to be repeated.
Another issue with measurements in vivo was determining whether the focus of the laser was off. If the laser was out of focus then no nitroglycerin peak would be observed. It was difficult to distinguish between measurements where the laser was out of focus and measurements where there was simply no NG present.
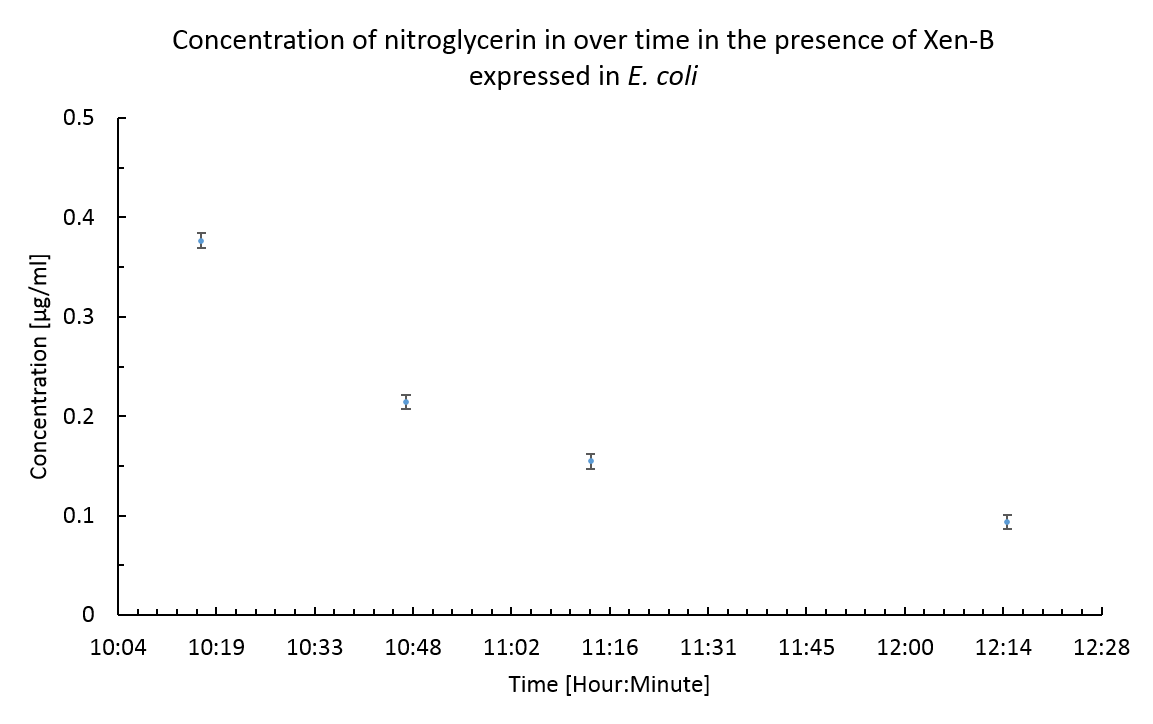
Figure 6: The concentration of nitroglycerin over time in the presence of XenB expressing E. coli, found using the peak area and the standard curve found previously. The time axis corresponds to the time at which samples were snap frozen. No peaks corresponding to NG were seen in samples of the supernatant. This was probably due to the same effect that masked the NG spectrum in the cell samples until the supernatant had evaporated. This masking effect was probably due to the evaporation of the droplet causing the laser to unfocus.
Partition coefficient
Figure 7 shows the spectra from the partition coefficient experiment. It can immediately be seen from the spectrum of the water after separation that the two liquids had not fully separated. This is revealed by the similarity of the water after separation spectrum and the oil spectrum. The lower auto-florescence and intensity related to olive oil peaks suggest that whilst much of the oil had separated out there were still small micro bubbles of the oil remaining.
The presence of oil in the water sample invalidated any results gained from this experiment. Such a small concentration of nitroglycerin was used at the outset that no peaks can be seen in either oil or water after separation anyway. The original concentration spectrum shows the maximum size of the peaks that would be expected, these are simply below the limit of resolution in the other spectra due to the presence of the oil spectra and high auto-florescence.
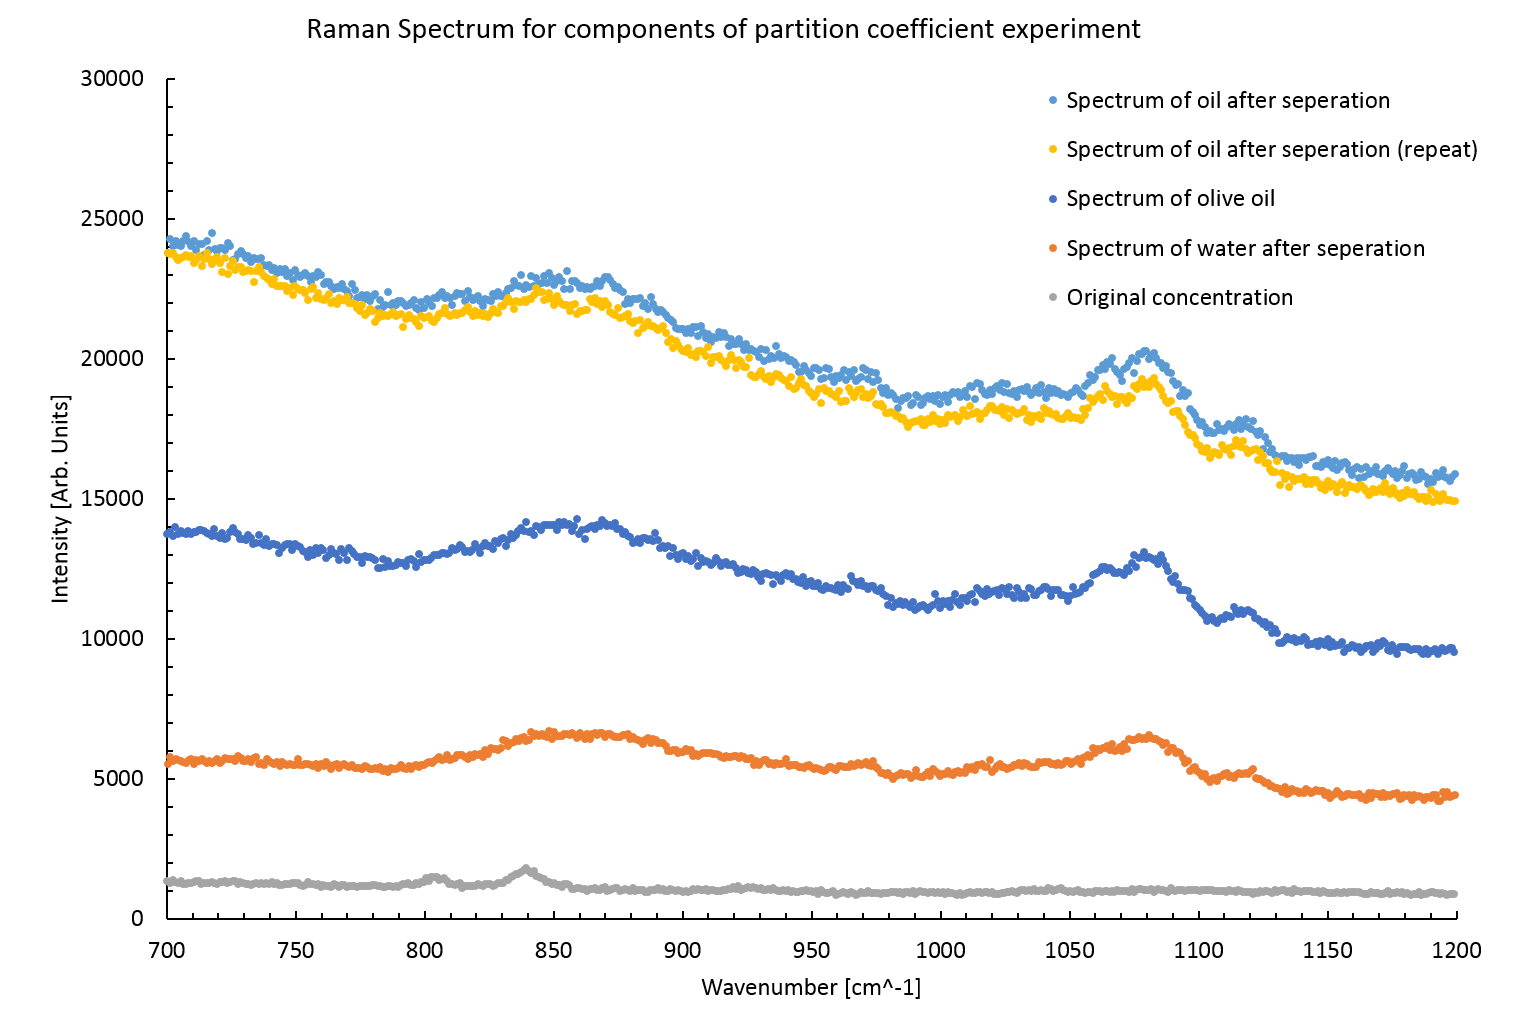
Figure 7: Raman spectra from various stages of the partition coefficient experiment. The peaks seen in the original concentration spectra are unresolvable in the later spectra. It is interesting to note that the auto-florescence increases in the oil samples after separation. Perhaps the boundary between water and oil creates a strong reflection, this may also explain the apparent magnitude of the oil remaining in the separated water sample.
Summary
Raman Spectroscopy
This experiment shows that Raman spectroscopy can be used to measure the concentration of NG in aqueous solutions. It was shown to provide accurate quantifiable measurements of the concentration of NG where the main source of error was in the preparation of the samples themselves.
However the use of Raman spectroscopy to measure low concentrations of artificial compounds in the presence of organic material is not recommended. The issue with measuring concentrations in the presence of cells is the large amount of different systems inside the cell, these produced a large fingerprint region (800cm$^{-1}$ to 1800cm$^{-1}$) that can mask the peaks of the artificial compound. The cells had a large auto-florescence which contributed to the difficulty of extracting useful information from the spectrum.
The experiment to determine the partition coefficient of NG and TNT was unsuccessful due to either incomplete separation of the oil and water or improper removal of the oil layer. Leaving the mix to separate for a longer time period may have been an option, however the background degradation of the compounds in oil and water would have to be determined to remove and systemic error this may cause.
Raman spectroscopy would be better suited to measuring concentrations of NG and TNT in-vitro where higher concentrations could used and auto-florescence could be kept to a minimum. For measurements in vivo the accuracy and rate of gathering data would be greatly improved by adding an nonreactive marker compound. This compound would have a known peak area and concentration and would allow for the calibration of other peaks present in a spectrum. This method could remove uncertainties in focusing the laser.
References
- COLLANDER, R., AND BARLUND, H.: Acta Botan. Fennica 11, 1 (1930)
- Trace level detection and identification of nitro-based explosives by surface-enhanced Raman spectroscopy, S. Botti,* S. Almaviva
- Explosive Detection using the D3 Klarite SERS technology, D3 Technologies Ltd.
- Fluorescence Background Problem in Raman Spectroscopy, Shan Yang and Ozan Akkus
Navigation
Exeter | ERASE
 ERASE-The Game!


