 "
"
Team:Freiburg/Notebook/Labjournal
From 2014.igem.org

Viral Vectors
Viral Vectors - May
2014/05/21
Transfection/ Virus production
For virus production Phoenix cells (producer cell line) were splitted (well separated) on 100mm plates. At 70% cell density cells were transfected using polyethylenimine.
- remove medium and refill with 5 ml new completed growth medium (DMEM)
- 600 µl transfection mastermix was prepared (8 µg pMIG IRES EGFP, 24 µl PEI, rest OptiMEM)
- mastermix was incubated 15 min and carefully drop on the plates
Plates were incubated at 37°C. The supernatant after 24 was removed and refilled with 5 ml new DMEM, the supernatant was collected after 48 h (refilled with 5 ml DMEM) as well as 72 h.

Phoenix cells transfected with pMIG IRES EGFP one day after transfection.
2014/05/25
Transduction mouse cells
NIH 3T3 cells (60% density) were transduced with MuLV IRES EGFP.
- 500 µl of supernatant was removed
- 1 µl Polybrene was added (10mg/ml)
- 500 µl virus supernatant was added (sterile filtered)
- incubation at 37°C for 6h
- cell supernatant was replaced with fresh DMEM
- transduction was repeated once
Pictures could be made after 48 h of incubation.

NIH 3T3 cells were transduced twice with MuLV IRES EGFP for 6h. Picture was made after 48 h of incubation at 37°C.
Viral Vectors - June
2014/06/20
Thawing of eukaryotic cells
New Phoenix cell stocks were thawed:
- cryotube was thawed at 37°C water bath until almost defrosted
- stock was filled in 9 ml warm completed growth medium and centrifuged at 900 rpm for 2 min
- medium was removed and refilled with 10 ml warm completed growth medium
- cells were seeded on 100 mm plates
Testing optimal cell density of mouse fibroblasts
NIH 3T3 have a really fast growth so that we tested the optimal cell number for seeding NIH 3T3 for having around 60% cell density on the next day. NIH 3T3 cells grow very fast; therefore we have tested the optimal seeding cell number to obtain 60% cell density on the next day. Results indicate that the optimal cell number is 1 &ndash 1.5x10^5 cells per well ( = 0.5 – 0.75 cells/ml)

2014/06/22
Transfection/ Virus production
Transfection of Phoenix cells (70% density) with pMIG IRES EGFP (protocol: 2014/05/21) (2 x 100mm plate)

Phoenix cells transfected with pMIG IRES EGFP.
2014/06/24
Transfection/ Virus production
Transfection of Phoenix cells (70% density) with pMIG IRES EGFP (protocol: 2014/05/21) (5 x 100mm plate)
2014/06/27
Thawing new HEK 293 cells
(protocol: 2014/06/20)
Transfection CHO cells with receptor
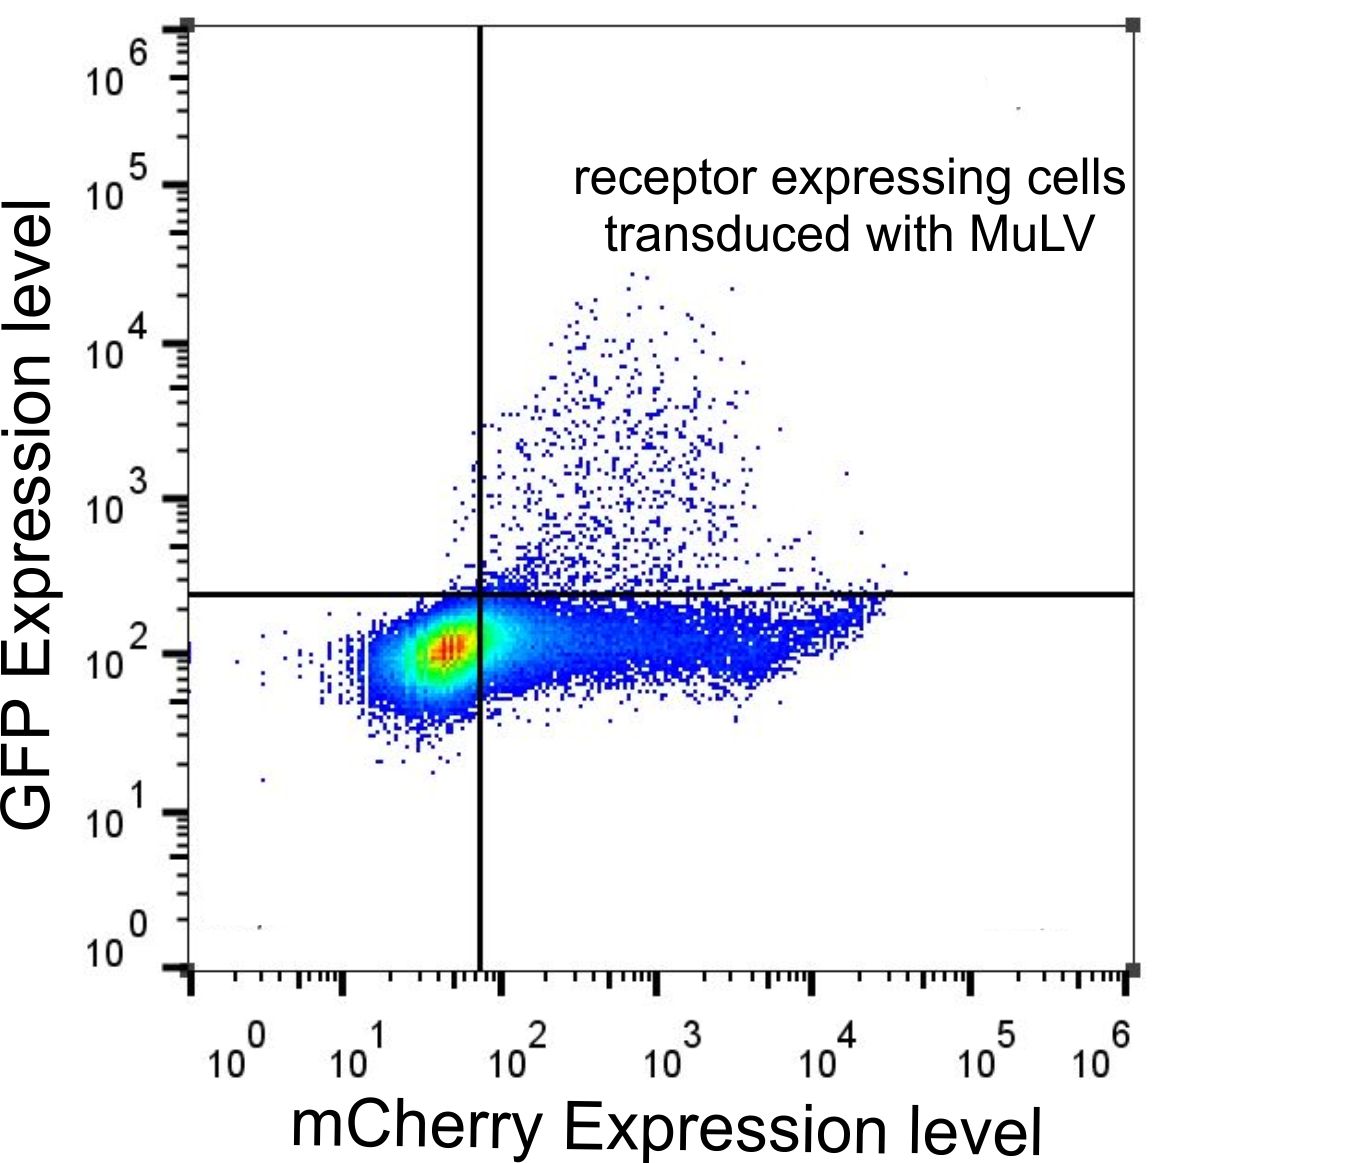
Transfection of CHO cells with SLC7a1 (for later transduction with virus). Medium was changed after 5 h. Cells were incubated for 24 h before viral transduction with MuLV IRES EGFP, medium change after 16 h.


(left) Cho cells without receptor were transduced with MuLV IRES EGFP ,(right) CHO cells transfected with SLC7a1 and transduced with MuLV IRES EGFP (24h after transfection). Analyses with flow cytometry indicates that 5% of cells were transfected (transfection control) and 2% of cells transfected with the receptor were infected with MuLV.

2014/06/27
Transduction mouse cells (different incubation times)
NIH 3T3 cells (60% density) were transduced with MuLV IRES EGFP and incubated for 8, 16, 24 and 2 x 8 hours. Virus was taken from different supernatants (an older one and a newer one) to see, if it makes any difference. Cells were infected with supernatant (500µl viral supernatant, 500µl completed growth medium + 1µl Polybrene/ml) harvested at different time points. Results indicate that there was no difference between older and newer virus; best results were given with an infection time of 2 x 8 hours.

For testing, if centrifugation brings better transduction efficiencies, mouse cells were infected with the different viral supernatants and centrifuged for 45 min, 1800 rpm, 32°C. In two wells it was tested if the double amount of Polybrene brings better transduction efficiencies. However, we found out that cells were death after centrifugation.

2014/06/30
Transfection CHO cells with receptor
CHO cells were transfected with the receptor (for later transduction). Medium was removed and filled with 2 ml new medium per well. Medium was changed after 5 h. Cells were transduced with MuLV IRES EGFP after 24 h of incubation at 37°C.

CHO cells were transduced with MuLV IRES EGFP 24 h after transfection with SLC7A1.
Transfection/ Virusproduction
Phoenix cells were transfected with pMIG IRES EGFP (protocol: 2014/05/21).
Viral Vectors - July
2014/07/03
Transfection CHO cells with receptor
CHO cells were transfected with the receptor (for later transduction). Medium was removed and filled with 2 ml new medium per well. Medium was changed after 5 h. Cells were transduced with MuLV IRES EGFP after 24 h of incubation at 37°C. This time there were no results du to high density of cells during transduction.
Freezing (cryopreservation) of eukaryotic cells
Phoenix cells were frozen at -80°C.
- removal of medium and washing with cold PBS
- addition of 1 ml 0,05% Trypsin per plate, incubation for 1-2 min)
- stopping of reaction with 5 ml DMEM (with FCS)
- centrifugation (5 min, 900 rpm)
- removal of supernatant and resuspension in 2 ml FCS (+10% DMSO)
- quick transfer in steril cryotube (1ml per tube) and quick freezing in -80°C
2014/07/06
Transfection CHO cells with receptor
CHO cells were seeded on cover slips and transfected with the receptor (for later transduction). Due to the fact that cells must be in growth phase during transduction with virus the cell density was set to 40%. Medium was changed after 5 h. Cells were transduced with MuLV IRES EGFP after 24 h of incubation at 37°C.
CHO cells transfected with SLC7a1 and transduction with MuLV IRES EGFP 24 h after transfection (A) experimental scheme. CHO cells were transduced with MuLV IRES EGFP 24 h after transfection with SLC7a1. (B) Transduced CHO cells expressing EGFP.
2014/07/08
Phoenix cells were transfected with pMIG IRES EGFP (protocol: 2014/05/21)

FACS results of pMIG IRES EGFP transfected Phoenix cells. Phoenix cells were transfected with pMIG IRES EGFP for production of viral particles. They were anaylsed by flow cytometry after three days of virus production (middle and upper pictures); negative control (upper picture).
2014/07/10
Transfection of CHO cells with receptor
CHO cells were transfected with the receptor (for later transduction). Medium was changed after 5 h and cells were transduced with MuLV IRES EGFP. This experiment gave no results.

2014/07/10
Fixation of cells on cover slips
CHO cells (transfected with SLC7a1; 2014/07/04) were fixed on cover slips
- Medium was removed and cells were washed with PBS
- Appropriate amount of 4% PFA/PBS was added (200µl on 24W) and incubated for 10 min on ice
- PFA was removed and plate was washed with PBS
- Cover slips were fixed with Mowiol on slides
2014/07/11
Transfection of HEK cells with receptor
HEK 293 cells were transfected with the receptor (for later transduction). Medium was changed after 5 h. Cells were transduced with MuLV IRES EGFP after 24 h of incubation at 37°C.
HEK293 transfected with SLC7a1 and transduction with MuLV IRES EGFP 24 h after transfection.
2014/07/14
Transfection/ Virus production

FACS results of pMIG IRES EGFP transfected Phoenix cells. Phoenix cells were transfected with pMIG IRES EGFP for production of viral particles. They were anaylsed by flow cytometry after three days of virus production (middle and upper pictures); negative control (upper picture).
2014/07/17
Transduction of mouse cells
Different volumes of virus supernatant were added to mouse cells (on 24W plate, 70% density) and analyzed by FACS (green), Microscopy (yellow) and Western Blot (blue) after 48 h.

green: anaylsis with flow cytometry
NIH cells transduced with MuLV IRES EGFP (left: 0,5 ml Virus + 0,5 ml DMEM; middle: 0,75 ml Virus + 0,25 ml DMEM; right: 1 ml Virus + 0 ml DMEM). Pictures made after 48 h.
yellow: fixation with PFA on cover slips
- Removal of medium
- Washing with cold PBS
- Adding of 400 µl PFA and incubation for 10 min on ice, another 10 min at RT
- Incubation of cover slips for 10 sec in DAPI solution (1:5000 in water)
- Washing in water
- Mounting with Mowiol on slides
Cells detach from the cover slip, therefore a coating is necessary e.g. with Poly-L-Lysine no results (better use poly-lysine for better grip of cells on cover slip)
blue: preparation for Western Blot via RIPA Lysis (as positive control for anti-CAT1 antibody)
- Removal of medium
- Washing with ice cold PBS
- Addition of 100 µl RIPA Buffer (completed with Phosphatase-Inhibitor-Mix)
- Incubation 10 min on ice
- Removal of cells with tip and transfer into Eppendorf tube
- Incubation for 10 min on ice
- Centrifugation for 5 min 10000 x g
- Transfer of 60 µl supernatant in new tube
- Addition of 15 µl 5 x SDS loading dye (with β-Mercaptoethanol)
- Cooking for 10 min at 95°C or for 15 min at 72°C
- Freezing at -24°C
Transfection of CHO cells with receptor
CHO cells growing in completed HTS medium (K1) were compared to CHO cells growing in completed DMEM medium. Cells were transfected with the receptor. Afterwards both kinds of CHO cells were infected with MuLV IRES EGFP and analyzyd using flow cytometry investigate which cells are better for transfection and transduction. Medium was changed after 5 h. Cells were incubated for 24 h at 37°C.


FACS results of CHO HTS (left) and CHO DMEM (right) cells transfected the receptor and transduced with MuLV EGFP.
2014/07/21
QR-code on 96W plate
HEK cells were transfected with the blue light system with SEAP as reporter and seeded on a 96W plate for pattern generation.
- Transfection of HEK293 in suspension (2 x 10^5 cells/ml, 100µl transfection mix/ml) with PKM292, PKM297 and PKM084 (1,5 µg DNA/ml cell suspension)
- Incubation for 5 h at 37°C and seeding on a 96W plate (with photo mask) afterwards (120µl/well)
- After 24 h of incubation at 37°C cells were illuminated with blue light for 5 h.
- Again after 24 h of incubation a SEAP assay was made directly in the plate:
- 30 min incubation of plate at 65°C
- addition of 100µl SEAP buffer into each well (ca. 90µl medium was left in each well)
- before measurement 20 µl substrate was added

HEK293 cells were transfected with the blue light system (PKM292, PKM297) and light induced SEAP as reporter (PKM084). Single wells were covered with a photo mask to prevent cell from light exposure. 24 hours after illumination with blue light a SEAP assay was performed leading to colour changing of wells containing SEAP. A photo mask in heart form was used. (B) a pink colour was set to green and a yellow colour was set to blue at a computer, (C) the same experiment was performed with multiple well plates with separated wells, (D) the contrast an the colours of the wells were changed at a computer. All wells together are forming the word: IGEM.

A pink colour was set to green and a yellow colour was set to blue at a computer.
Transfection/ Virus production
Phoenix cells were transfected with pMIG IRES EGFP and pMIG EGFP(protocol: 2014/05/21)

FACS results of pMIG IRES EGFP transfected Phoenix cells. Phoenix cells were transfected with pMIG IRES EGFP for production of viral particles. They were anaylsed by flow cytometry after three days of virus production (middle and upper pictures); negative control (upper picture).
2014/07/31
Improvement of Transduction
Transduction of NIH 3T3 cells with two different viral supernatants via three different methods.
- 1.2 µl Polybrene adding directly to 1 ml DMEM on cells and adding 1 ml viral supernatant afterwards
- 2.addition of 1 µl Polybrene to 1 ml viral supernatant and addition of the mixture to 1 ml DMEM on the cells
- 3.addition of 2 µl Polybrene to 1 ml viral supernatant and addition of the mixture to 1 ml DMEM on the cells
- Incubation for 48 h at 37°C

NIH3T3 cells were transduced with MuLV EGFP (upper pictures) and with MuLV IRES EGFP (lower pictures) left: transduction method 1; middle: transduction method 2; right: transduction method 3
Transduction of NIH3T3 cells with two different viral supernatants (MuLV IRES EGFP or MuLV EGFP) with either 1 or 2 µl Polybrene.
- 1. 1 µl Polybrene added directly to 1 ml DMEM on cells, addition of 1 ml virus supernatant
- 2. 2 µl Polybrene added directly to 1 ml DMEM on cells, addition of 1 ml virus supernatant
- 3. 2µl Polybrene was added to 1 ml viral supernatant; mixture was added to 1 ml DMEM
Centrifugation at 37°C for 45 min at 400 RPM. Results indicate that cells do not like to be centrifuged.


NIH3T3 cells transduced with MuLV EGFP (A + B) and MuLV IRES EGFP (C + D) either with 1 µl (A + C) or 2 µl (B + D) Polybrene and centrifuged 45 min at 37°C for 400 RPM
Testing difference in transfection efficiency of Phoenix and HEK cells/ negative control for MuLV
Phoenix cells and HEK cells were tested for there transfection capacity and compared. In addition, it was tested that the virus cannot infect Phoenix nor HEK cells. So both kinds of cells were transfected with PHB308 (mCherry, 3 µg/well) and in parallel transduced with MuLV IRES EGFP (1 ml/well + 2 µl Polybrene).


HEK cells (A + B): transduced with MuLV IRES EGFP (A); negative control (B); Phoenix cells (C + D): transduced with MuLV IRES EGFP (C); negative control (D); HEK cells (E) and (F) Phoenix cells transfected with PHB308 and analysed after 24 h.
Comparison of transfection capacity of HEK 293 cells (red) and Phoenix cells (blue). Both cell lines were transfected with 3 µg PHB308 (mCherry) per well (6W plate) and analysed via FACS after 24 h.
Viral Vectors - August
2014/08/01
Generation of a GFP mouse cell line
For testing whether MuLV can stable transfer genes into cells, a stable mouse cell line using this virus was generated.
Therefore two 100mm plates were transduced with 3 ml virus supernatant (MuLV IRES EGFP) and splitted as usual. Cells were sorted with a cell sorter. Analysis via FACS happened before and after sorting. The analysis was repeated after several rounds of splitting.

NIH3T3 cells transduced with MuLV IRES EGFP and sorted. Negative control (left), before sorting (middle), after sorting (right).
2014/08/03
Testing different transfection methods with different cells
For optimizing transfection in different cell lines transfection methods and different concentrations of the transfection mixtures were compared. The experiment was done with mouse cells (NIH3T3), hamster cells (CHO) and human cells (Phoenix). As transfection reagents lipofectamin and PEI were used in different concentrations.

NIH3T3 cells transduced with MuLV IRES EGFP and sorted. Negative control (left), before sorting (middle), after sorting (right).
Transfection with Lipofectamin (for 3 wells):
- (solutions A) 50 µl OptMEM was mixed with either:
- 1. 1 µl Lipofectamin + 1,5 µl PHB308
- 2. 2,5 µl Lipofectamin + 1,5 µl PHB308 or
- 3. 4 µl Lipofectamin + 1,5 µl PHB308
- incubation for 25 min at RT
- (solution B) 150 µl OptiMEM was mixed with 1,5 µl PHB308 (2,5 µg/µl) and 4 µl Plut Reagent
- incubation for 15 min
- solutions A (1-3) were then mixed with 50 µl of solution B and incubated for 5 min at RT
- 100 µl of transfection solution were added to each well
- no medium changing, incubation at 37°C for 24 h
Transfection with PEI (for 1 well):
- 0,2 µl PHB308 was mixed with 40 µl OptiMEM and DNA, for each well another concentration of DNA was added:
- 1. 1,5 µl PEI
- 2. 3 µl PEI
- 3. 5 µl PEI
- Incubation for (optimal) 10,8 min
- addition of 40 µL solution to each well
- medium changing after 5 h of incubation at 37°C, incubation for 24 h at 37°C

Pictures and FACS data of different transfection methods with different kinds of cells. A: Phoenix cells transfected with PHB308 (mCherry) via 1 µl (left), 2,5 µl (middle) and 4 µl Lipofectamin; B: Phoenix cells transfected with PHB308 (mCherry) via 1,5 µl (left), 3 µl (middle) and 5 µl Pei; C: Cho cells transfected with PHB308 (mCherry) via 1 µl (left), 2,5 µl (middle) and 4 µl Lipofectamin; D: Cho cells transfected with PHB308 (mCherry) via 1,5 µl (left), 3 µl (middle) and 5 µl Pei; E: NIH3T3 cells transfected with PHB308 (mCherry) via 1 µl (left), 2,5 µl (middle) and 4 µl Lipofectamin; F: NIH3T3 cells transfected with PHB308 (mCherry) via 1,5 µl (left), 3 µl (middle) and 5 µl Pei.
2014/08/06
Transfection of HEK cells with receptor
HEK293 were transfected with the receptor plus mCherry to see, if the virus infect only cells expressing the receptor (the two plasmids should infect same cells). In parallel cells were transfected with the blue light and the red light positive control (PMZ422 and PSAM200) and the receptor inducible by the light systems. After 24 h cells (expressing the receptor) were infected with MuLV IRES EGFP.

HEK 293 tranfected with PHB308 (mCherry) and the receptor. Transduction with MuLV after 24 h of incubation. Pictures were taken two days post transfection.
Transfection HEK and Pheonix cells with receptor (transfection while seeding)
To avoid a too high cell density for transduction cells were transfected while seeding. The PEI transfection mix was given to the HEK or Phoenix cell suspension (1,5 x 10^5 c/ml, 100 µl mix per 1 ml cells) and seeded on a 12W plate. Results indicated that PEI was too toxic for cells during this method.

2014/08/09
Virus dilution
Virus supernatant was diluted with fresh DMEM before transduction. Cells were analyzed after 48 h.
- 0,5 ml virus + 0,5 ml DMEM
- 0,4 ml virus + 0,6 ml DMEM
- 0,3 ml virus + 0,7 ml DMEM
- 0,2 ml virus + 0,8 ml DMEM
- 0,1 ml virus + 0, 9 ml DMEM

NIH3t3 cells transduced with MuLV IRES EGFP in different dilutions (upper from left to right: 5/10, 4/10, 3/10, 2/10, 1/10 virus supernatant. Pictures were made after 48 h of incubation at 37°C.

NIH3t3 cells transduced with diluted MuLV IRES EGFP and analysed by FACS after 48 h, red: 1/10, blue: 2/10, orange: 3/10, green: 4/10, dark green: 5/10 dilution.
2014/08/15
Testing different receptor constructs
HEK293 cells were transfectec with p14rz_004 (labeled with HA-tag), p14ls_006 (labeled with HA-tag and mCherry) and the original receptor plasmid pQCXIN (containing SLC7A1).

Figure : HEK293 cells transfected with different receptor constructs and infected with MuLV EGFP afterwards.
The cells were transfected with pQCXIN (original vector containing SLC7A1) (A), p14rz_004 (labeled with HA-tag)(B) and p14rz_006 (labeled with HA-tag and mCherry)(C). Cells were transduced with MuLV after 24 hours. Pictures were taken after 48 hours.
FACS data of HEK-293T cells tranfected with the receptor and infected with MuLV-EGFP.
HEK-293T cells were transfected with the mCAT-1-mCherry and infected with MuLV-EGFP. Cells were analyzed by flow cytometry 48 h after infection.
Viral Vectors - September
2014/09/01
QR-code on 96W plate
HEK cells were transfected with the blue light system with SEAP as reporter and seeded on a 96W plate for pattern generation.
- Transfection of HEK293 in suspension (2 x 10^5 cells/ml, 100µl transfection mix/ml) with PKM292, PKM297 and PKM084 (1,5 µg DNA/ml cell suspension)
- Incubation for 5 h at 37°C and seeding on a 96W plate (with photo mask) afterwards (120µl/well)
- After 24 h of incubation at 37°C cells were illuminated with blue light for 5 h.
- Again after 24 h of incubation a SEAP assay was made directly in the plate:
- 30 min incubation of plate at 65°C
- addition of 100µl SEAP buffer into each well (ca. 90µl medium was left in each well)
- before measurement 20 µl substrate was added


left: Supernatants of HEK293 cells transfected with PKM292, PKM297 and PKM084 24 h after illumination with blue light. For visualizing of SEAP a SEAP assay was made (2014-09-03 23.55.54), right: same supernatants with with colour switch that was made after taking picture.
2014/09/03
Virus Half life time
800 µl aliquots of virus supernatants (MuLV IRES EGFP) were incubated for different times at 37°C in the incubator. After incubation cells were infected with the supernatants (250 ml supernatant/ 250 ml medium + 0,5 µl Polybrene). After 48 h cells were anaysed by FACS.
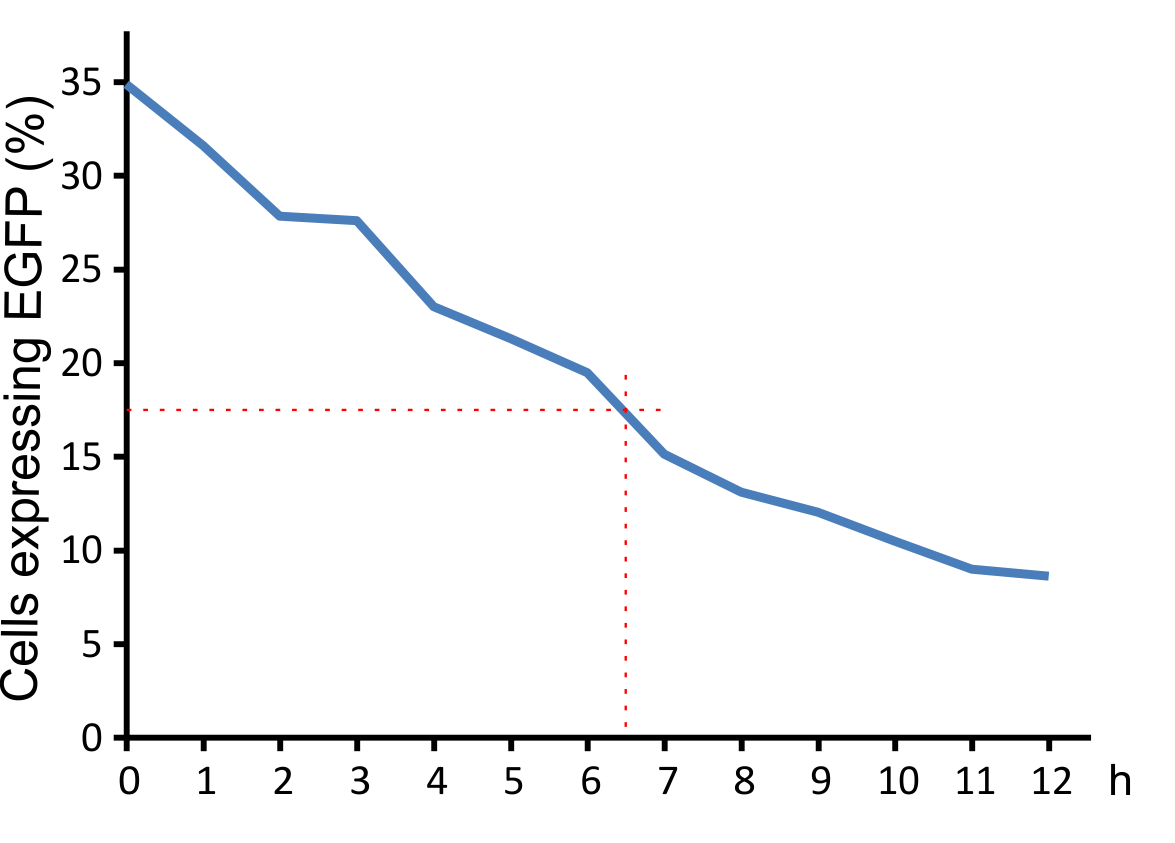
Figure 8: Decay of viral particles.
The virus was first incubated at 37°C and then added to the NIH 3T3 cell culture. Transduction efficiency was measured after 48 hours.
Experiment: receptor life time after splitting
Two 6W of HEK293 cells were transfected with rz006 (receptor labled with mCherry and HA-tag). After each round of splitting cells were analysed by Western blot. Therefore each round one well was splitted 1:2 on two new wells and one well was lysed by Ripa lysis. Afterwards, each lysed sample was frozen in -20°C until use.

Two new cells lines
New cells lines were thawed:
- MCF-7 human breast cancer cells
- A-547 human lung epithel carcinoma
Rezeptorexpression time
HEK293 cells on 16 x 35mm plates were transfected with rz006 (receptor labeled with mCherry and HA-tag). At several time points after transfection cells were lysed with RIPA buffer and analyzed with Western Blot. Samples were frozen at -20°C until analysis.


Figure 6: Expression time of the receptor that was transfected into HEK-293T cells.
After transfection with mCAT-1-HA cells were lysed with RIPA buffer at distinct time points. A Western blot was performed using an anti-HA antibody.
We quantified the expression of the receptor after transfection of HEK-293T cells with different concentrations of receptor DNA by Western blotting. 35 mm plates with HEK293T cells were infected with 0.6 to 5.4 µg receptor DNA labeled with HA-tag (p14rz_006). Cells were lysed with RIPA buffer 24 hours after transfection and analyzed by Western blot using an HA-probe antibody.

Figure 7: Tranfection of HEK-293T cells with different receptor DNA concentrations.
Cells (on 35mm plates) were transfected with 0.6 µg to 5.4 µg plasmid p14rz_006 coding for mCAT-1-HA per well. Cells were lysed with RIPA buffer after 24 h of incubation and analyzed by Western blotting.
2014/09/05
Generation of a GFP mouse cell line
For testing whether MuLV can stable transfer genes into cells, a stable mouse cell line using this virus was generated.
Therefore two 100mm plates were transduced with 3 ml virus supernatant (MuLV IRES EGFP) and splitted as usual. Cells were sorted with a cell sorter. Analysis via FACS happened before and after sorting. The analysis was repeated after several rounds of splitting.

Figure 2: Stable integration of EGFP into the genome of the target cells
(A) Histogram of fluorescence intensity at the first sorting step. (B) Histogram of fluorescence intensity at passage xx after sorting. (C) The fraction of fluorescent cells stays constant for many passages.
2014/09/09
Specificity of MuLV
We tested, if MuLV was specific for murine cell lines and was not able to infect cell lines not containing mCAT-1. So we incubated different human cell lines with MuLV EGFP regarding EGFP expression after infection.


Infection of different cell lines with the viral vector derived from the murine leukemia virus.
Cells that were infected by viral particles express EGFP.

FACS analysis of murine cells (NIH3T3) incubated with the mCAT-1 specific viral vector
Murine cells were transduced with MuLV EGFP and analysed with flow cytometry after 48 hours of incubation.
2014/09/11
Testing different pMIG constructs
We tested the expression strength of EGFP in pMIG constructs containing only the marker in comparison to constructs containing the target gene upstream of an IRES and EGFP as a marker.

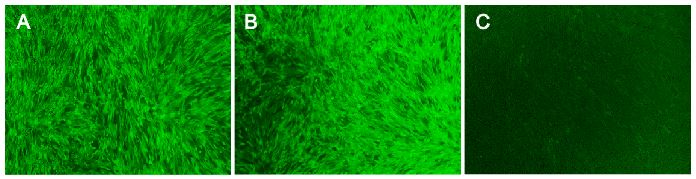
Figure 4: Expression strength of EGFP sorting marker with and without an IRES.
(A) Cargo contains only EGFP, (B) cargo contains EGFP downstream of an IRES, (C) cargo contains a gane of interest, an IRES, and the EGFP marker.
2014/09/20
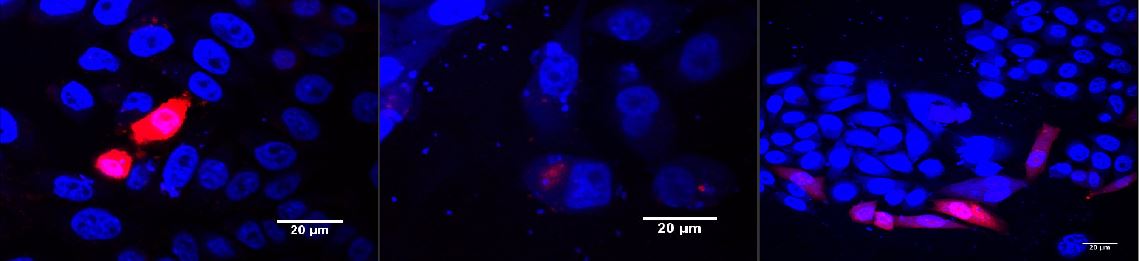
Confocal images of HEK293T cells transduced for receptor localization
HEK293T cells were transfected with mCAT-1-mCherry (p14rz_005). 4x10^5 cells/ ml were incubated with PEI transfection mix and receptor DNA (1,5 µg/ml) for 5 hours at 37°C and washed by centrifugation (900 RPM, 2 min, 22°C) afterwards. The pellet was resuspend in completed growth medium and 200 µl cell suspension (1,5 x 10^5 cells/ ml) were seeded on a 24 well plate. Plates were prepared with cover slips covered with gelantine before. After 24 hours of incubation cells were fixed with PFA for confocal microscopy.
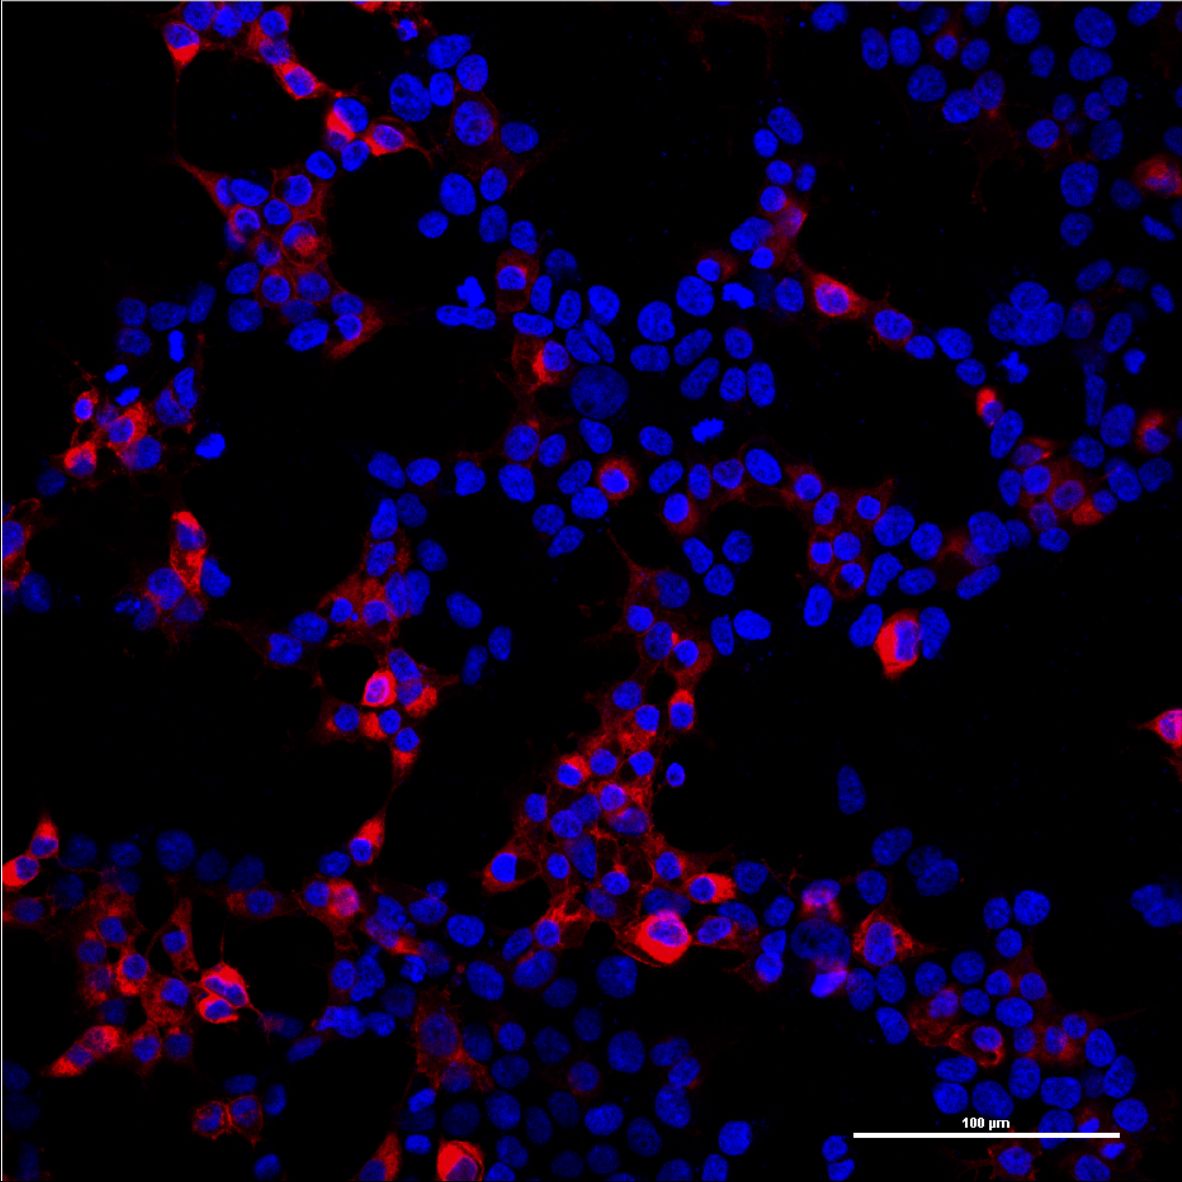
Figure 1: Overview image of HEK-293T cells transfected with mCAT-1-mCherry (p14rz_005).
Confocal pictures were taken with a 20x plan apo objective. Nuclear staining (DAPI) is shown in blue and the mCAT-1-mCherry in red.

Figure 2: HEK-293T cells transfected with mCAT-1-mCherry (p14rz_005).
Confocal pictures were taken with an 100x oil immersion objective (NA 1.40). Nuclear staining (DAPI) is shown in blue and the mCAT-1-mCherry in red.
2014/09/26
Transfection/ Virus production (stained virus)
Phoenix cells were stained with DiD, a membrane staining dye.
- Resuspension of 2 µl dye (5mM) in 5 ml OptiMEM
- Removing of medium from five 100mm Pheonix plates and addition of 1 ml staining solution per well
- Incubation for 15 min at 37°C
- Washing of plates two times with DMEM (incubation time between each washing step was at least 10 min
- Transfection of cells with pMIG-mKO, pMIG-BFP2, pMIG-EGFP and pMIG-mKate
- Medium changing after 24 h of incubation at 37°C and refill with 4 ml new DMEM
- Harvest after 48 h and 72 h post transfection
2014/09/28
Virusintegration time in mouse cells
NIH3t3 cells (mouse fibroblasts) were infected with MuLV IRES EGFP at different time points. Directly after the latest infection the cells were splitted on new plates. After 48 h cells were analyzed via FACS.


Figure 3: Integration time of our viral vector into murine cells.
Murine cells were infected with MuLV EGFP and washed at distinct time points.
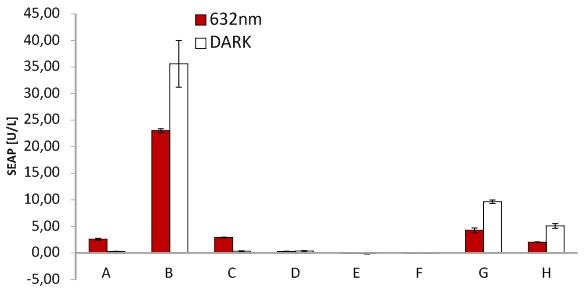
QR-code on 24W plate (with virus)
For testing the functionality of our system and the functionality of the virus with SEAP, cells were transfected with the blue light system plus light inducible receptor (labled with mCherry) and later infected with MuLV SEAP or MuLV CMV SEAP. Both viruses were compared. In addition, cells were infected with MuLV EGFP as control. Several negative controls were added as well as unilluminated cells expressing the light system for testing leaky expression. Cells were incubated in dark.
- Transfection of cells with eather the blue light system plus receptor (PKM292, PKM297, ls003) or the receptor (rz006 p2a mCherry).
- Cells were transfected via PEI in suspension (3 x 10^5 cells/ml, 100 µl transfection mix/ml, 1,5 µg DNA/ml). Cells were incubated for 5 h at 37°C before centrifugation (900 RPM, 3 min, 24°C). Cells were resuspended with fresh DMEM to a final concentration of 1,5 x 10^5 cells/ml) and seeded (0,5 ml/well).
- Cells were incubated for 24 h at 37°C and the illuminated with blue light for 1 h (not the dark control).
- Cells were infected with 250 µl virus supernatant (+0,5 µl Polybrene) per well. Medium was changed after 4 h of incubation at 37°C.
- After 24 h and after 48 h of incubation 200 µl supernatant was taken and used for SEAP assay as described before.

Since, SEAP is already produced by Phoenix cells during generation of viral particles, SEAP was detected in every negative control.

Blue light induced receptor.
HEK cells were transfected with the blue light system (PKM292 and PKM297) and the light induced receptor (p14ls_003). The receptor was labeled with mCherry. Cells were infected with MuLV EGFP afterwards; (left) incubation in the dark, (middle) after illumination with blue light, (right) cells expressing the light induced receptor were infected with MuLV.
Transduction of mouse cells on cover slips, different colours
Mouse cells (on 25 cm coverslips, covered with polylysine) were infected with MuLV-mKO, MuLV-EGFP, MuLV-BFP2, MuLV-mKate (half DMEM, half virus supernatant) and incubated at 37°C for 48 h. Medium was changed after 16 h of incubation. Afterward cells were analyzed via fluorescence microscopy.
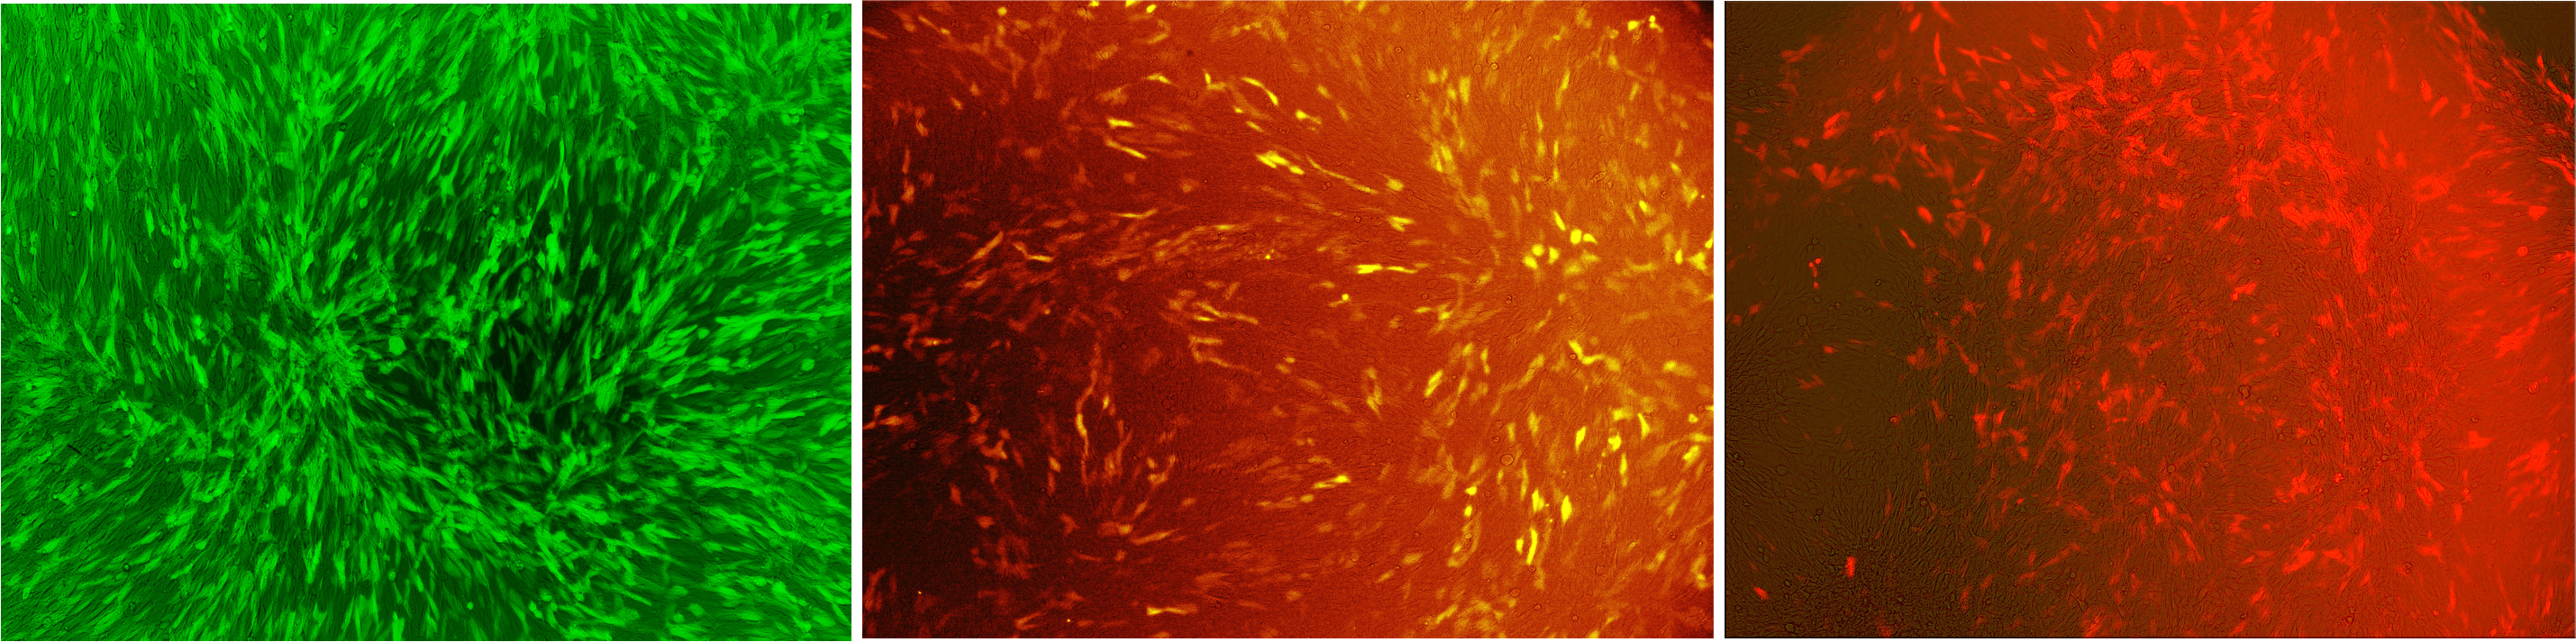
Figure 1: Murine cells infected with our viral vector
The vector contained different fluorescent markers; (A) EGFP; (B) mKO; (C) mKate that were stably integrated into the genomeLabjournal
2014/09/29
QR-code with virus on 96W plate
- Cells were transfected in suspension with the blue light system plus receptor (PKM292, PKM297, ls003, 3 x 10^5 cells/ml, 100 µl transfection mix/ml, 1.5 µg DNA/ml). Cells were incubated for 5 h at 37°C before centrifugation (900 RPM, 3 min, 24°C). Cells were resuspended with fresh DMEM to a final concentration of 1.5 x 10^5 cells/ml and seeded (0,1 ml/well).
- After 15 h of incubation cells were illuminated with blue light for 1 h.
- Cells were incubated for 24 h and afterwards infected with MuLV CMV SEAP. Medium was changed after 4 h of infection.
- After 24 h the supernatant was analyzed via SEAP assay as described before.
Viral Vectors - October
2014/10/10
Generation of QR code on 384W plates
- Cells were transfected in suspension with the blue light system using SEAP as reporter (PKM292, PKM297, PKM084, 3 x 10^5 cells/ml, 100 µl transfection mix/ml, 1.5 µg DNA/ml). Cells were incubated for 5 h at 37°C before centrifugation (900 RPM, 3 min, 24°C). Cells were resuspended with fresh DMEM to a final concentration of 2 x 10^5 cells/ml and seeded (20 µl/well).
- After 24 h of incubation cells were illuminated with blue light for 5 h.
- After 24 h the supernatant was analyzed via SEAP assay as described before.
- Wells that contained SEAP changed their colour to yellow

Figure 4: Generation of a QR code on a 384 well plate.
HEK293 cells were transfected with the blue light system (PKM292, PKM297) and light induced SEAP as reporter (PKM084). Single wells were covered with a photo mask to prevent cell from light exposure using a photo mask for a QR code (made by iGEM Team Aachen 2014). 24 hours after illumination with blue light a SEAP assay was performed leading to colour changing of wells containing SEAP. Only a part of the plate was used. (A) Photo mask for QR code generation, (B) Picture of the 384W plate after the SEAP assay, (C) the same plate with contrast of the colours increased at a computer.
2014/10/12
Confocal images of HEK293T cells transduced with MuLV EGFP
HEK293T cells were transfected with mCAT-1-mCherry (p14rz_005). 4x10^5 cells/ ml were incubated with PEI transfection mix and receptor DNA (1,5 µg/ml) for 5 hours at 37°C and washed by centrifugation (900 RPM, 2 min, 22°C) afterwards. The pellet was resuspend in completed growth medium and 200 µl cell suspension (1,5 x 10^5 cells/ ml) were seeded on a 24 well plate. Plates were prepared with cover slips covered with gelantine before. After 24 hours of incubation cells were transduced with MuLV EGFP. Cells were fixed with PFA for confocal microscopy 48 hours after transduction.
Figure 3: Blue light induced receptor in HEK-293T
HEK cells were transfected with the blue light system (PKM292 and PKM297) and the light induced receptor (p14ls_003). The receptor was labeled with mCherry that was cleaved during expression, thus remaining in the cytoplasm. Cells were infected with MuLV EGFP afterwards. (A) Overlay of all three channels, (B) DAPI stained nuclei, (C) EGFP expression in infected cells, (D) mCherry expression. Objective plan apo 60x, NA 1.40.
Light-System
Light System - June
2014/06/16
Transfection Red light system in CHO cells
We transfected the lightsystem (pKM022) + mCherry (pKM078) & lightsystem (pkMpKM022) + receptor (pMW:SLC7A1)
- we used 4 x 100 mm dishes: 2 x for 660 nm and 2 x for 740 nm illumination (one of each for negative control)
- transfection with red light system (pKM022) and receptor (SLC7A1) or light induced mCherry (pKM078)
- transfection mix was incubated for 20 min and 1 ml added to each dish
- medium was changed after 4-5h
- cells incubated for 20 h
2014/06/17
PCB addition
- 50 mg PCB was dissolved in 2 ml DMSO - every step was performed in the dark!
- c(PCB) = 4.39x10^-5 M = 43,9 mM
- 14,08 µl PCB solution was diluted in 40 ml DMEM
- c(PCB, diluted) = 15 mM
- the culture medium of the transfected cells was replaced by 10 ml prewarmed PCB-DMEM solution
- Three plates were placed for one hour in the 660 nm lightbox (negative control, pKM078, pMW)
- Three plates were placed for one hour in the 740 nm lightbox (negative control, pKM078, pMW)
- after illuminations the lightboxes were incubated at 37 °C for 23 h
2014/06/18
Lysis of cells with RIPA buffer
- For samples transfected with the receptor cells were lysed with RIPA buffer
- Cells were washed with ice-cold PBS
- Cells were lysed with 4,43 ml ice-cold RIPA buffer (completed with phosphatase inhibitor mix) and incubated for 10 min
- Cells were detached from the plate with a inverted pipette tip and transferred into Eppis
- Eppis were vortexed and incubated on ice for 10 min
- Eppis were centrifuged for 5 min at 10.000 x g
- 60 µl direct-lysate with were mixed with 15 µl 5x SDS-Dye and heated for 10 min at 85 °C
- Lysates were stored at - 24 °C
Fixation with PFA
- Cells transfected with pKM078 (mCherry) illuminated at 740 nm, 600 nm; negative control lighted at 660 nm were washed with 30 ml ice-cold PBS
- 3 ml ice-cold PFA-Solution (4%) was added and 10 min incubated on ice
- PFA was replaced with 7 ml PBS and stored in the freezer
Experiment did not work.
2014/06/22
Transfection Red light system in CHO cells
- for each transfection condition an 1.5 ml eppi was prepared with:
- 50 µl Opti-MEM
- plasmid DNA (0.75 µg in total)
- both were mixed by vortexing
- 2.5 µl PEI solution was added
- mixture was directly vortexed for 10 sec
- the solution was incubated at room temperature for 15 min
- the precipitate (50 µl per well) was carefully added to the CHO cells
- the mixture was incubated in the cell incubator
- after 5 h: the medium was changed to prewarmed DMEM
- the CHO cells were incubated for 20 h
- 3 sample mixtures were prepared and the medium in the wells with 0.5 ml of one of the mixtures replaced:
- 10 ml DMEM - for samples 1,4,5 and 6
- 3.5 ml DMEM + 1.3 µl PCB solution - samples 3 and 7
- 3.5 ml DMEM + 1.3 µl DMSO - samples 2
- (DMSO was diluted 1:8000 in methanol:HCL (95:5 vol/vol))
- A 6W plate was prepared:
- 1st well: negative control
- 2nd well: transfection control - pEGFP_C1 (3 µg)
- 3rd well: transfection control - pEGFP_C1 (3 µg)
- 4th well: SLC7A1 (3 µg)
- 5th well: SLC7A1 (3 µg)
- 6th well: SLC7A1 (2 µg)
- cells were washed with 0.5 ml PBS
- 200 µl RIPA buffer was added to the well
- cells were scraped off and transferred into a tube
- cells were incubated on ice on 10 min
- the mix was vortexed and incubated on ice for 10 min
- lysates were centrifuged for 5 min at 10.000 x g
- 170 µl direct-lysate of each sample was added to 42.5 µl 5x SDS loading-dye
- samples were incubated for 10 min at 95°C lysates were stored at -26°C
- 2x 24 well plates were trancfected, one plate with cover slips and one plates without cover slips
- 24 well plate with cover slips:
- 5 wells: 0.5 µg pKM022 + 0.25 µg pKM078 + PCB
- 5 wells: 0.5 µg pKM022 + 0.25 µg pKM078 - pCB
- 5 wells: 0.5 µg pSAM200 + 0.25 µg pKM078
- 3 wells: 0.5 µg EGFP_C1 + 0.25 µg pKM078
- 3 wells: 0.75 µg EGFP_C1
- 3 wells: negatve control
- 24 well plate without cover slips:
- 5 wells: 0.5 µg pKM022 + 0.25 µg pKM006 + PCB
- 5 wells: 0.5 µg pKM022 + 0.25 µg pKM006 - pCB
- 5 wells: 0.5 µg pSAM200 + 0.25 µg pKM006
- 3 wells: 0.5 µg EGFP_C1 + 0.25 µg pKM006
- 3 wells: 0.75 µg EGFP_C1
- 3 wells: negatve control
- transfection mastermixes were incubated for 15 min
- after 5h: medium exchange in both 24 well plates
- after 21h: medium was changed (0.5 ml per well)
- 5 wells (0.5 µg pKM022 + 0.25 µg pKM006 + PCB): DMEM medium supplemented with 15 µM PCB
- 5 wells (0.5 µg pKM022 + 0.25 µg pKM078 + PCB): DMEM medium supplemented with 15 µM PCB
- 5 wells (0.5 µg pKM022 + 0.25 µg pKM006 - PCB): DMEM medium supplemented with DMSO
- 5 wells (0.5 µg pKM022 + 0.25 µg pKM006 - PCB): DMEM medium supplemented with DMSO
- in all other wells: medium was changed to prewarmed DMEM medium
- both 24 well plates were illuminated for 24 h in the 660 nm lightbox at 37°C
- intensity of our LED band light box: ca. 6 µmol/(m^2*s)
- intensity of both light boxes from other laboratory (AG Weber): 20 µmol/(m^2*s)
- transfection scheme in 24 well:
- medium was changed 5h after transfection
- Two solution-mixes were prepared:
- 1) 2x (15 µl our PCB solution + 37.5 ml DMEM)
- 2) 2.8 µl Weber's BCB solution + 7 ml DMEM)
- the medium in all wells was aspirated
- 0.5 ml solution-mix 1 was added to wells labeled with A, B, D, F, G, H
- 0.5 ml solution-mix 2 was added to wells labelled with C
- plates were first incubated in the dark for 1h then illuminated for 24h
- 2.25 g homoarginine + 0.048 g MgCl2 diluted in 250 ml ddH2O
- 105 ml diethanolamine was added
- pH value was set to 9.8 with HCL solution
- filled up to 500 ml with ddH2O
- 96 well plates were sealed and incubaed at 65°C for 45 min
- 1 min centrifuged at 1258 g
- 100 µl SEAP buffer was prepared in each well of a 96 (flat-bottom) well plate
- of the centrifguged plates 80 µl supernatant per well were added to the the 100 µl SEAP buffer
- each well was completed with 20 µl pNPP (substrate)
- spectroscopic measurement every minute for 1 hour at 405 nm
- medium was changed afetr 5h
- PCB was added 20h after medium exchange
- incubation for 1h in the dark
- 1st plate was incubated for 24h at 660 nm illumination in our LED band box
- 2nd plate was incubated for 24h in the dark
- 200 µl supernatant were transferred in a 96W plate for performing a SEAP assay.
- some plates were fixed with PFA for microscopy, and stained with DAPi
- pKM297: VP16-PDZb (in two fold excess tranfected)
- pKM292: Gal4BD, LOV (in two fold excess tranfected)
- pKM084: SEAP, reporter (1x transfected)
- pMIG-IRES-GFP: junk
- C1_EGFP: reansfection control
- the medium was changed 5h after trasfection (48 µl), first incubated for 20h in the dark and then incubated for 5h, 2.5h and 1h:
- 1st plate in our LED band box at 465 nm
- 2nd plate in the dark
- a SEAP assay was performed after 24 hours of incubation
- transfection of the red-light system
- 3x 24 well plates with:
- 3x 24 well plates with:
- medium was changed after 5 hours
- PCB was added after 20 hours
- mastermixes:
- 40 ml DMEM + 14.5 µl PCB
- 32 ml HTS + 11.5 µl PCN
- incubation for 1h in the dark
- for each of the 3 plates with the mCherry reporter one plate was incubated in the dark, one plate at 740 nm and one plate at 660 nm illumination for 24 hours
- for each of the 3 plates with the SEAP reporter one plate was incubated oin the dark, one at 740 nm illumination and one at 660 nm illumination for 24 hours
- 200 µl supernatant of each well were transferred into a 96W plate for performing a SEAP-assay
- the medium was changed 5 hours after trasfection and incubated for 20h in the dark
- 1st plate: incubation in our LED band box at 465 nm for 5 hours
- 2nd plate incubation in the dark
- a SEAP assay was performed 24 hours after illumination
| pKM078/pKM006 | pKM022 | pSAM200 | pMIG | Opti-MEM (to 200 µl) | PEI | ||
| 1) mCherry for leaky expression | 58 µl pKM078 | / | / | 5.2 µl | 136,8 µl | 10 µl | |
| 2) pKM078 -PCB | 58 µl | 4.5 µl | / | 1.7 µl | 135.8 µl | 10 µl | |
| 3) pKM078 +PCB | 58 µl | 4.5 µl | / | 1.7 µl | 135.8 µl | 10 µl | |
| 4) constitutive control | 58 µl | / | 19 µl | 1.7 µl | 138.4 µl | 10 µl | |
| 5) transfection control | / | / | / | 7 µl | 193 µl | 10 µl | |
| 6) SEAP for leaky expression | 1.3 µl pKM006 | / | / | 5.2 µl | 193.5 µl | 10 µl | |
| 7) pKM 006 +PCB | 1.3 µl | 4.5 µl | / | 1.7 µl | 194.2 µl | 10 µl |
2014/06/23
PCB addidtion
To activate the red light system PCB was added after 20 hours of incubation
2014/06/29
Transfection of receptor (SLC7A1) in CHO cells)
Cells were lysed with RIPA buffer 24 hours after incubation at 37°C
transfection of the red light system into CHO cells
2014/06/30
PCB addition
Cells were lysed with RIPA buffer after 24 hours. Lysates were incubated with SDS loading dye for 10 min at 95°C and stored at -24°C.
Light System - July
2014/07/07
Measurement of LED band
2014/07/08
Transfection of red light system in CHO cells/ comparison of different light boxes
| A: 0.5 µg pKM022 + 0.25 µg pKM006 | A: 0.5 µg pKM022 + 0.25 µg pKM006 | A: 0.5 µg pKM022 + 0.25 µg pKM006 | B: 0.5 µg pSAM200 + 0.25 µg pKM006 | B: 0.5 µg pSAM200 + 0.25 µg pKM006 | B: 0.5 µg pSAM200 + 0.25 µg pKM006 |
| C: 0.5 µg pKM022 + 0.25 µg pKM006 | C: 0.5 µg pKM022 + 0.25 µg pKM006 | C: 0.5 µg pKM022 + 0.25 µg pKM006 | D: 0.5 µg empty vector + 0.25 µg pKM006 | D: 0.5 µg empty vector + 0.25 µg pKM006 | D: 0.5 µg empty vector + 0.25 µg pKM006 |
| E: 0.75 µg pMIG | E: 0.75 µg pMIG | E: 0.75 µg pMIG | F: 0.5 µg pKM022 + 0.25 µg078 (on cover slides) | F: 0.5 µg pKM022 + 0.25 µg078 (on cover slides) | F: 0.5 µg pKM022 + 0.25 µg078 (on cover slides) |
| G: pHB362 + pKM082 | G: pHB362 + pKM082 | G: pHB362 + pKM082 | H: pHB362 + pKM082 | H: pHB362 + pKM082 | H: pHB362 + pKM082 |
2014/07/09
PCB addition
To activate the red light system PCB was added after 20 hours of incubation
After 24 hours of illumination 200 µl supernatant of samples A, B, C, D, E, G, H was transferred in 96W plates. The plate was stored at -24°C before measurement with SEAP-assay. Samples F were fixed with PFA and stored at 4°C.
2014/07/11
Preparation of SEAP buffer
SEAP assay Red light system/ comparison different light boxes
SEAP assay with illuminated CHO cells transfected with the red light system, box of our lab. A: pKM022 + pKM006; B: pSAM200 + pKM006; C: pKM022 + pKM006; D: empty vector + pKM006; E: transfection control; F: pKM022 + pKM078 (on cover slides);G: pHB362 + pKM082; H: pHB362 + pKM082
SEAP assay with illuminated CHO cells transfected with the red light system, box of other lab. A: pKM022 + pKM006; B: pSAM200 + pKM006; C: pKM022 + pKM006; D: empty vector + pKM006; E: transfection control; F: pKM022 + pKM078 (on cover slides);G: pHB362 + pKM082; H: pHB362 + pKM082

SEAP assay with illuminated CHO cells transfected with the red light system, comparison of two different light boxes. A: pKM022 + pKM006; B: pSAM200 + pKM006; C: pKM022 + pKM006; D: empty vector + pKM006; E: transfection control; F: pKM022 + pKM078 (on cover slides);G: pHB362 + pKM082; H: pHB362 + pKM082
2014/07/11
Transfection of CHO cells with the red light system.
| 1: 0.5 µg pKM022 + 0.25 µg pKM006 | 1: 0.5 µg pKM022 + 0.25 µg pKM006 | 1: 0.5 µg pKM022 + 0.25 µg pKM006 | 2: 0.5 µg pSAM200 + 0.25 µg pKM006 | 2: 0.5 µg pSAM200 + 0.25 µg pKM006 | 2: 0.5 µg pSAM200 + 0.25 µg pKM006 |
| 4: 0.75 µg pMIG-IRE-GFP | 4: 0.75 µg pMIG-IRES-GFP | 4: 0.75 µg pMIG-IRES-GFP | 3: 0.5 µg pMIG-IRES-GFP + 0.25 µg pKM006 | 3: 0.5 µg pMIG-IRES-GFP + 0.25 µg pKM006 | 3: 0.5 µg pMIG-IRES-GFP + 0.25 µg pKM006 |
| 5: 0.5 µg pKM022 + 0.25 µg pKM078 (on cs) | 5: 0.5 µg pKM022 + 0.25 µg pKM078 (on cs) | 5: 0.5 µg pKM022 + 0.25 µg pKM078 (on cs) | 6: 0.5 µg pMIG-IRES-GFP + 0.25 µg pKM078 (on cs) | 6: 0.5 µg pMIG-IRES-GFP + 0.25 µg pKM078 (on cs) | 6: 0.5 µg pMIG-IRES-GFP + 0.25 µg pKM078 (on cs) |
| 7: 0.5 µg pSAM200 + 0.25 µg pKM078 (on cs) | 7: 0.5 µg pSAM200 + 0.25 µg pKM078 (on cs) | 7: 0.5 µg pSAM200 + 0.25 µg pKM078 (on cs) | 8: 0.5 µg pKM022 + 0.25 µg pKM006 + SLC7A1 (on cs) | 8: 0.5 µg pKM022 + 0.25 µg pKM006 + SLC7A1 (on cs) | 8: 0.5 µg pKM022 + 0.25 µg pKM006 + SLC7A1 (on cs) |
CHO cells transfected with PKM022 and p14rz_002 after illumination (A); dark control (B); positiv control (PSAM200 and p14rz_002) (C)
2014/07/15
Transfection of CHO and HEK cells with the blue light system.
| pKM297 (2x) + pKM292 (2x) + pKM084 (1x) (CHO) | pKM297 (2x) + pKM292 (2x) + pKM084 (1x) (CHO) | pKM297 (2x) + pKM292 (2x) + pKM084 (1x) (CHO) | pKM297 (2x) + pKM292 (2x) + pKM084 (1x) (HEK) | pKM297 (2x) + pKM292 (2x) + pKM084 (1x) (HEK) | pKM297 (2x) + pKM292 (2x) + pKM084 (1x) (HEK) |
| pKM297 (2x) + pKM084 (1x) + pMIG-IRES-GFP (2x) (CHO) | pKM297 (2x) + pKM084 (1x) + pMIG-IRES-GFP (2x) (CHO) | pKM297 (2x) + pKM084 (1x) + pMIG-IRES-GFP (2x) (CHO) | pKM297 (2x) + pKM084 (1x) + pMIG-IRES-GFP (2x) (HEK) | pKM297 (2x) + pKM084 (1x) + pMIG-IRES-GFP (2x) (HEK) | pKM297 (2x) + pKM084 (1x) + pMIG-IRES-GFP (2x) (HEK) |
| pKM292 (2x) + pKM084 (1x) + pMIG-IRES-GFP (2x) (CHO) | pKM292 (2x) + pKM084 (1x) + pMIG-IRES-GFP (2x) (CHO) | pKM292 (2x) + pKM084 (1x) + pMIG-IRES-GFP (2x) (CHO) | pKM292 (2x) + pKM084 (1x) + pMIG-IRES-GFP (2x) (HEK) | pKM292 (2x) + pKM084 (1x) + pMIG-IRES-GFP (2x) (HEK) | pKM292 (2x) + pKM084 (1x) + pMIG-IRES-GFP (2x) (HEK) |
| C1_EGFP (CHO) | C1_EGFP (CHO) | C1_EGFP (CHO) | C1_EGFP (HEK) | C1_EGFP (HEK) | C1_EGFP (HEK) |

HEK cells transfected with the blue light system (PKM292, PKM297 and PKM084) and illuminated for different durations. A SEAP assay was performed afterwards.
2014/07/17
Transfection of different CHO cell lines with the red light system.
| DMEM CHO: 0.5 µg pKM022 + 0.25 µg pKM078 | DMEM CHO: 0.5 µg pKM022 + 0.25 µg pKM078 | DMEM CHO: 0.5 µg pKM022 + 0.25 µg pKM078 | DMEM CHO: 0.5 µg pMIG-IRES-GFP + 0.25 µg pKM078 | DMEM CHO: 0.5 µg pMIG-IRES-GFP + 0.25 µg pKM078 | DMEM CHO: 0.5 µg pMIG-IRES-GFP + 0.25 µg pKM078 |
| DMEM CHO: 0.5 µg pSAM200 + 0.25 µg pKM078 | DMEM CHO: 0.5 µg pSAM200 + 0.25 µg pKM078 | DMEM CHO: 0.5 µg pSAM200 + 0.25 µg pKM078 | DMEM CHO: 0.75 µg pMIG-IRES-GFP | DMEM CHO: 0.75 µg pMIG-IRES-GFP | DMEM CHO: negative control |
| HTS CHO-K1: 0.5 µg pKM022 + 0.25 µg pKM078 | HTS CHO-K1: 0.5 µg pKM022 + 0.25 µg pKM078 | HTS CHO-K1: 0.5 µg pKM022 + 0.25 µg pKM078 | HTS CHO-K1: 0.5 µg pMIG-IRES-GFP + 0.25 µg pKM078 | HTS CHO-K1: 0.5 µg pMIG-IRES-GFP + 0.25 µg pKM078 | HTS CHO-K1: 0.5 µg pMIG-IRES-GFP + 0.25 µg pKM078 |
| HTS CHO-K1: 0.5 µg pSAM200 + 0.25 µg pKM078 | HTS CHO-K1: 0.5 µg pSAM200 + 0.25 µg pKM078 | HTS CHO-K1: 0.5 µg pSAM200 + 0.25 µg pKM078 | HTS CHO-K1: 0.75 µg pMIG-IRES-GFP | HTS CHO-K1: 0.75 µg pMIG-IRES-GFP | HTS CHO-K1: negative control |
| DMEM CHO: 0.5 µg pKM022 + 0.25 µg pKM006 | DMEM CHO: 0.5 µg pKM022 + 0.25 µg pKM006 | DMEM CHO: 0.5 µg pKM022 + 0.25 µg pKM006 | DMEM CHO: 0.5 µg pMIG-IRES-GFP + 0.25 µg pKM006 | DMEM CHO: 0.5 µg pMIG-IRES-GFP + 0.25 µg pKM006 | DMEM CHO: 0.5 µg pMIG-IRES-GFP + 0.25 µg pKM006 |
| DMEM CHO: 0.5 µg pSAM200 + 0.25 µg pKM006 | DMEM CHO: 0.5 µg pSAM200 + 0.25 µg pKM006 | DMEM CHO: 0.5 µg pSAM200 + 0.25 µg pKM006 | DMEM CHO: 0.75 µg pMIG-IRES-GFP | DMEM CHO: 0.75 µg pMIG-IRES-GFP | DMEM CHO: negative control |
| HTS CHO-K1: 0.5 µg pKM022 + 0.25 µg pKM006 | HTS CHO-K1: 0.5 µg pKM022 + 0.25 µg pKM006 | HTS CHO-K1: 0.5 µg pKM022 + 0.25 µg pKM006 | HTS CHO-K1: 0.5 µg pMIG-IRES-GFP + 0.25 µg pKM006 | HTS CHO-K1: 0.5 µg pMIG-IRES-GFP + 0.25 µg pKM006 | HTS CHO-K1: 0.5 µg pMIG-IRES-GFP + 0.25 µg pKM006 |
| HTS CHO-K1: 0.5 µg pSAM200 + 0.25 µg pKM006 | HTS CHO-K1: 0.5 µg pSAM200 + 0.25 µg pKM006 | HTS CHO-K1: 0.5 µg pSAM200 + 0.25 µg pKM006 | HTS CHO-K1: 0.75 µg pMIG-IRES-GFP | HTS CHO-K1: 0.75 µg pMIG-IRES-GFP | HTS CHO-K1: negative control |

SEAP assay performed with two different CHO cell lines. CHO 2 grow in completed DMEM medium and CHO K1 in completed HTS medium.
2014/07/22
Transfection of blue light system in HEK cells
| pKM 292 + pKM 297 + pKM084 | pKM 292 + pKM 297 + pKM084 | pKM 292 + pKM 297 + pKM084 | - | - | - |
| pKM297 + pKM084 + junk | pKM297 + pKM084 + junk | pKM297 + pKM084 + junk | - | - | - |
| pKM292 + pKM084 + junk | pKM292 + pKM084 + junk | pKM292 + pKM084 + junk | - | - | - |
| pMIG_IRES_GFP | pMIG_IRES_GFP | pMIG_IRES_GFP | - | - | - |

SEAP assay performed with HEK cells transfected with the blue light system (PKM292 and PKM297) with seap as a reporter gene (PKM084).
Light System - August
2014/08/02
Pattern Generation
Transfecting HEK293T cells with:
all plasmids in a concentration of 500 µg/µl
positive control (1 x 6 cm plate):
|
Construct |
DNA [µl] |
PEI [µl] |
OptiMEM [µl] |
|
pKM297 |
- |
14.4 |
336.0 |
|
pKM292 |
- |
||
|
pEZ422 |
4.8 |
||
|
Ls003 |
4.8 |
negative control (1 x 6 cm plate):
|
Construct |
DNA [µl] |
PEI [µl] |
OptiMEM [µl] |
|
pKM297 |
- |
- |
- |
|
pKM292 |
- |
||
|
pEZ422 |
- |
||
|
Ls003 |
- |
experiment (5 x 6 cm plates)
|
Construct |
DNA [µl] |
PEI [µl] |
OptiMEM [µl] |
|
pKM297 |
16.0 |
72.0 |
1680.0 |
|
pKM292 |
16.0 |
||
|
pEZ422 |
- |
||
|
Ls003 |
16.0 |
Medium was changed 5 h post transfection
All further steps were performed under dark conditions to prevent accidental activation of the light system.
Plates were put into light-boxes 24 h post transfection
Plates were irradiated for:
|
Plate |
Duration |
|
1 |
5h |
|
2 |
5h |
|
3 |
5h |
|
4 |
5h |
|
5 (dark control) |
5h |
We were not able to detect a pattern when irradiating for 5 h.
Dark control showed no fluorecent cells.
Positive control showed fluorecent cells.
2014/08/10
Pattern generation with blue light system
Transfecting HEK293T cells with:
all plasmids in a concentration of 500 µg/µl
positive control (1 x 6 cm plate):
|
Construct |
DNA [µl] |
PEI [µl] |
OptiMEM [µl] |
|
pKM297 |
- |
14.4 |
336.0 |
|
pKM292 |
- |
||
|
pEZ422 |
4.8 |
||
|
Ls003 |
4.8 |
negative control (1 x 6 cm plate):
|
Construct |
DNA [µl] |
PEI [µl] |
OptiMEM [µl] |
|
pKM297 |
- |
- |
- |
|
pKM292 |
- |
||
|
pEZ422 |
- |
||
|
Ls003 |
- |
experiment (5 x 6 cm plates)
|
Construct |
DNA [µl] |
PEI [µl] |
OptiMEM [µl] |
|
pKM297 |
16.0 |
72.0 |
1680.0 |
|
pKM292 |
16.0 |
||
|
pEZ422 |
- |
||
|
Ls003 |
16.0 |
Medium was changed 5 h post transfection
All further steps were performed under dark conditions to prevent accidental activation of the light system.
Plates were put into light-boxes 24 h post transfection
Plates were irradiated for:
|
Plate |
Duration |
|
1 |
30 min |
|
2 |
1 h |
|
3 |
1/1/2 h |
|
4 |
2 h |
|
5 (dark control) |
2 h |
We were not able to detect a pattern when irradiating for the stated timepoints.
Dark control showed no fluorecent cells.
Positive control showed fluorecent cells.
2014/08/15
Pattern generation with blue light system
Transfecting HEK293T cells with:
all plasmids in a concentration of 500 µg/µl
positive control (1 x 6 cm plate):
|
Construct |
DNA [µl] |
PEI [µl] |
OptiMEM [µl] |
|
pKM297 |
- |
14.4 |
336.0 |
|
pKM292 |
- |
||
|
pEZ422 |
4.8 |
||
|
Ls003 |
4.8 |
negative control (1 x 6 cm plate):
|
Construct |
DNA [µl] |
PEI [µl] |
OptiMEM [µl] |
|
pKM297 |
- |
- |
- |
|
pKM292 |
- |
||
|
pEZ422 |
- |
||
|
Ls003 |
- |
experiment (5 x 6 cm plates)
|
Construct |
DNA [µl] |
PEI [µl] |
OptiMEM [µl] |
|
pKM297 |
16.0 |
72.0 |
1680.0 |
|
pKM292 |
16.0 |
||
|
pEZ422 |
- |
||
|
Ls003 |
16.0 |
Medium was changed 5 h post transfection
All further steps were performed under dark conditions to prevent accidental activation of the light system.
Plates were put into light-boxes 24 h post transfection
Plates were irradiated for:
|
Plate |
Duration |
|
1 |
1 min |
|
2 |
10 min |
|
3 |
15 min |
|
4 |
Pulsed - 1 sec/29 sec (for 10 min) |
|
5 (dark control) |
15 min |
We detected fluorecence but no pattern.
Dark control showed fluorecent cells.
Positive control showed fluorecent cells.
2014/08/21
Pattern generation with blue light system
Transfecting HEK293T cells with:
all plasmids in a concentration of 500 µg/µl
positive control (1 x 6 cm plate):
|
Construct |
DNA [µl] |
PEI [µl] |
OptiMEM [µl] |
|
pKM297 |
- |
14.4 |
336.0 |
|
pKM292 |
- |
||
|
pEZ422 |
4.8 |
||
|
Ls003 |
4.8 |
negative control (1 x 6 cm plate):
|
Construct |
DNA [µl] |
PEI [µl] |
OptiMEM [µl] |
|
pKM297 |
- |
- |
- |
|
pKM292 |
- |
||
|
pEZ422 |
- |
||
|
Ls003 |
- |
experiment (5 x 6 cm plates)
|
Construct |
DNA [µl] |
PEI [µl] |
OptiMEM [µl] |
|
pKM297 |
8.0 |
72.0 |
1680.0 |
|
pKM292 |
16.0 |
||
|
pEZ422 |
- |
||
|
Ls003 |
8.0 |
Medium was changed 5 h post transfection
All further steps were performed under dark conditions to prevent accidental activation of the light system.
Plates were put into light-boxes 24 h post transfection
Plates were irradiated for:
|
Plate |
Duration |
|
1 |
1 min |
|
2 |
10 min |
|
3 |
15 min |
|
4 |
Pulsed - 1 sec/29 sec (for 10 min) |
|
5 (dark control) |
15 min |
We detected fluorecence but no pattern.
Dark control showed fluorecent cells.
Positive control showed fluorecent cells.
2014/08/30
Pattern generation with blue light system
Transfecting HEK293T cells with:
all plasmids in a concentration of 500 µg/µl
positive control (1 x 6 cm plate):
|
Construct |
DNA [µl] |
PEI [µl] |
OptiMEM [µl] |
|
pKM297 |
- |
14.4 |
336.0 |
|
pKM292 |
- |
||
|
pEZ422 |
4.8 |
||
|
Ls003 |
4.8 |
negative control (1 x 6 cm plate):
|
Construct |
DNA [µl] |
PEI [µl] |
OptiMEM [µl] |
|
pKM297 |
- |
- |
- |
|
pKM292 |
- |
||
|
pEZ422 |
- |
||
|
Ls003 |
- |
experiment (5 x 6 cm plates)
|
Construct |
DNA [µl] |
PEI [µl] |
OptiMEM [µl] |
|
pKM297 |
16.0 |
72.0 |
1680.0 |
|
pKM292 |
16.0 |
||
|
pEZ422 |
- |
||
|
Ls003 |
16.0 |
Medium was changed 5 h post transfection
All further steps were performed under dark conditions to prevent accidental activation of the light system.
Plates were put into light-boxes 24 h post transfection
Plates were irradiated for:
|
Plate |
Duration |
|
1 |
1 min |
|
2 |
10 min |
|
3 |
15 min |
|
4 |
Pulsed - 1 sec/29 sec (for 10 min) |
|
5 (dark control) |
15 min |
We detected no fluorecence.
Dark control showed no fluorecent cells.
Positive control showed fluorecent cells.
Light System - September
2014/09/04
Pattern generation with blue light system
Transfecting HEK293T cells with:
all plasmids in a concentration of 500 µg/µl
positive control (1 x 6 cm plate):
|
Construct |
DNA [µl] |
PEI [µl] |
OptiMEM [µl] |
|
pKM297 |
- |
14.4 |
336.0 |
|
pKM292 |
- |
||
|
pEZ422 |
4.8 |
||
|
Ls003 |
4.8 |
negative control (1 x 6 cm plate):
|
Construct |
DNA [µl] |
PEI [µl] |
OptiMEM [µl] |
|
pKM297 |
- |
- |
- |
|
pKM292 |
- |
||
|
pEZ422 |
- |
||
|
Ls003 |
- |
experiment (5 x 6 cm plates)
|
Construct |
DNA [µl] |
PEI [µl] |
OptiMEM [µl] |
|
pKM297 |
16.0 |
72.0 |
1680.0 |
|
pKM292 |
16.0 |
||
|
pEZ422 |
- |
||
|
Ls003 |
16.0 |
Medium was changed 5 h post transfection
All further steps were performed under dark conditions to prevent accidental activation of the light system.
Plates were put into light-boxes 24 h post transfection
Plates were irradiated for:
|
Plate |
Duration |
|
1 |
1 min |
|
2 |
10 min |
|
3 |
15 min |
|
4 |
Pulsed - 1 sec/29 sec (for 10 min) |
|
5 (dark control) |
15 min |
We detected no fluorecence.
Dark control showed no fluorecent cells.
Positive control showed fluorecent cells.
2014/09/09
Kinetik of the blue light induced receptor
HEK293 cells were transfected using PEI with the blue light system (PKM292 and PKM297) and the light induced receptor (p14ls_003). 24 hours after transfection cells were illuminated for 5 hours with blue light. At distinct time points (after 10h, 12h, 15h, 18h and 24h) cells were analysed with fluorescence microscopy and lysed with RIPA buffer for analysis with Western blot.

Kinetik of the blue light induced receptor.
HEK cells were transfected with the blue light system (PKM292 and PKM297) and the light induced receptor (p14ls_003, mCherry labeled receptor). Pictures were taken after 12h, 15h, 18h and 24h.
Pattern generation with blue light system
Transfecting HEK293T cells with:
all plasmids in a concentration of 500 µg/µl
positive control (1 x 6 cm plate):
|
Construct |
DNA [µl] |
PEI [µl] |
OptiMEM [µl] |
|
pKM297 |
- |
14.4 |
336.0 |
|
pKM292 |
- |
||
|
pEZ422 |
4.8 |
||
|
Ls003 |
4.8 |
negative control (1 x 6 cm plate):
|
Construct |
DNA [µl] |
PEI [µl] |
OptiMEM [µl] |
|
pKM297 |
- |
- |
- |
|
pKM292 |
- |
||
|
pEZ422 |
- |
||
|
Ls003 |
- |
experiment (5 x 6 cm plates)
|
Construct |
DNA [µl] |
PEI [µl] |
OptiMEM [µl] |
|
pKM297 |
16.0 |
72.0 |
1680.0 |
|
pKM292 |
16.0 |
||
|
pEZ422 |
- |
||
|
Ls003 |
16.0 |
Medium was changed 5 h post transfection
All further steps were performed under dark conditions to prevent accidental activation of the light system.
Plates were put into light-boxes 24 h post transfection
Plates were irradiated for:
|
Plate |
Duration |
|
1 |
1 min |
|
2 |
10 min |
|
3 |
15 min |
|
4 |
Pulsed - 1 sec/29 sec (for 10 min) |
|
5 (dark control) |
15 min |
We detected no fluorecence.
Dark control showed no fluorecent cells.
Positive control showed fluorecent cells.
2014/09/22
Pattern generation with blue light system
Transfecting HEK293T cells with:
all plasmids in a concentration of 500 µg/µl
positive control (1 x 6 cm plate):
|
Construct |
DNA [µl] |
PEI [µl] |
OptiMEM [µl] |
|
pKM297 |
- |
14.4 |
336.0 |
|
pKM292 |
- |
||
|
pEZ422 |
4.8 |
||
|
Ls003 |
4.8 |
negative control (1 x 6 cm plate):
|
Construct |
DNA [µl] |
PEI [µl] |
OptiMEM [µl] |
|
pKM297 |
- |
- |
- |
|
pKM292 |
- |
||
|
pEZ422 |
- |
||
|
Ls003 |
- |
experiment (5 x 6 cm plates)
|
Construct |
DNA [µl] |
PEI [µl] |
OptiMEM [µl] |
|
pKM297 |
16.0 |
72.0 |
1680.0 |
|
pKM292 |
16.0 |
||
|
pEZ422 |
- |
||
|
Ls003 |
16.0 |
Medium was changed 5 h post transfection
All further steps were performed under dark conditions to prevent accidental activation of the light system.
Plates were put into light-boxes 24 h post transfection
Plates were irradiated for:
|
Plate |
Duration |
|
1 |
30 min |
|
2 |
1 h |
|
3 |
1/1/2 h |
|
4 |
2 h |
|
5 (dark control) |
2 h |
We detected fluorecence in all experiments.
2014/09/26
Pattern generation with blue light system
Transfecting HEK293T cells with:
all plasmids in a concentration of 500 µg/µl
positive control (1 x 6 cm plate):
|
Construct |
DNA [µl] |
PEI [µl] |
OptiMEM [µl] |
|
pKM297 |
- |
14.4 |
336.0 |
|
pKM292 |
- |
||
|
pEZ422 |
4.8 |
||
|
Ls003 |
4.8 |
negative control (1 x 6 cm plate):
|
Construct |
DNA [µl] |
PEI [µl] |
OptiMEM [µl] |
|
pKM297 |
- |
- |
- |
|
pKM292 |
- |
||
|
pEZ422 |
- |
||
|
Ls003 |
- |
experiment (5 x 6 cm plates)
|
Construct |
DNA [µl] |
PEI [µl] |
OptiMEM [µl] |
|
pKM297 |
16.0 |
72.0 |
1680.0 |
|
pKM292 |
16.0 |
||
|
pEZ422 |
- |
||
|
Ls003 |
16.0 |
Medium was changed 5 h post transfection
All further steps were performed under dark conditions to prevent accidental activation of the light system.
Plates were put into light-boxes 24 h post transfection
Plates were irradiated for:
|
Plate |
Duration |
|
1 |
1 min |
|
2 |
5 min |
|
3 |
10 min |
|
4 |
15 min |
|
5 (dark control) |
15 min |
We detected fluorecence in all experiments.

The light induced receptor was induced by light scatter.
HEK293T cells were transfected with the light system and the light induced receptor (p14ls_003) labeled with mCherry. Cells were illuminated using a photo mask that covered parts of the cell culture and prevented them from light exposure. However, the receptor expression was activated also outside of the pattern.