|
|
| (20 intermediate revisions not shown) |
| Line 2: |
Line 2: |
| | <html> | | <html> |
| | <div id="main-content"> | | <div id="main-content"> |
| - | <h>Stephen curve model</h> | + | <h>Stephan curve model</h> |
| | + | |
| | <h1>Purpose</h1> | | <h1>Purpose</h1> |
| - | <p>1. To quantize and prove the effectiveness of our product on “Stephan curve”, a crucial curve for dental decay assessment which shows pH drop in mouth after ingestion.<br> 2. To figure out the effective duration of our product and display it in term of Stephan curve.</p> | + | <div class='abstract mdl'> |
| - | <h1>Introduction</h1> | + | <ul> |
| - | <p>Stephan curve illustrates the change in oral pH within few minutes in response to a cariogenic challenge, which is mainly caused by the bacterial metabolism of sugar-rich food. As we have mentioned, oral pH plays important role in caries assessment, since the solubility and demineralization[1] of the tooth is pH dependent[2]. The longer time oral pH is below “critical pH 5.5”, the more likely dental plaque is to take place. Therefore, the cariogenicity is measured as the area delimited by the Critical pH and the Stephan Curve[3].<br><br> | + | <li>To quantize and prove the effectiveness of our product on “Stephan curve”, a crucial curve for dental decay assessment which shows pH drop in mouth after ingestion.</li> |
| - | In our <a href='/Team:NYMU-Taipei/modeling/m2'><b>competition model</b></a>, we have shown how the population shift would cause the change of pH value. As population shift in oral cavity is a long term process, the model we built and the data we fit in competition model are in the view of large time scale (few days). Therefore, the model only provides information about how our product affects the final pH result from bacterial metabolism, that is, the minimum pH value in Stephan curve. However, dentistry experts gave us suggestions that besides from the raising of minimum pH, showing how our product influence Stephan curve to dentists and the public may be more persuasive.<br> | + | <li>To figure out the effective duration of our product and display it in term of Stephan curve.</li> |
| - | Here we try to use the bacteria population derived in competition model to fit the general Stephan curve proposed by RM Stephan[4]. Studies have shown that in short time scale, the change of pH is proportional to the amount of bacteria, which correlates to our growth & pH model. Moreover, there are also some driving forces such as salivary[5], water, or oxygen content that would buffer and rebound the pH value. Therefore, we build a model for Stephan curve simulation with the consideration of bacteria amount and a upward driving force.<br><br> | + | </ul> |
| - | Although the aim of our project is to provide a long term oral care for everyone, there are still some concerns about the effective duration of our product. Both the flux of salivary and drinks would reduce the amount of phage we apply in oral cavity, as well as the M102 phage resistance result from selection. Therefore, we do literature search to figure out the probability of phage loss [6] and S. mutans resistance, and estimate the effective duration of our product via the change of Stephan curve. | + | </div> |
| | + | <div class='cont-panel mdl-panel'> |
| | + | <div href='#2c1-1'><p>Introduction</p></div> |
| | + | <div href='#2c1-2'><p>Equations</p></div> |
| | + | <div href='#2c1-3'><p>Result</p></div> |
| | + | <div href='#2c1-4'><p>Reference</p></div> |
| | + | <div style="display:inline-block; width: 640px; height: 0.1px; border: none; margin: 0px"></div> |
| | + | </div> |
| | + | <div class='article modeling indent'> |
| | + | <h1 id='2c1-1'>Introduction</h1> |
| | + | <p>Stephan curve illustrates the change in oral pH within few minutes in response to a cariogenic challenge, which is mainly caused by the bacterial metabolism of sugar-rich food. As we have mentioned, oral pH plays important role in caries assessment, since the solubility and demineralization[1] of the tooth is pH dependent[2]. The longer time oral pH is below “critical pH 5.5”, the more likely dental plaque is to take place. Therefore, the cariogenicity is measured as the area delimited by the Critical pH and the Stephan Curve[3].</p><p> |
| | + | In our <a href='/Team:NYMU-Taipei/modeling/m2'><b>competition model</b></a>, we have shown how the population shift would cause the change of pH value. As population shift in oral cavity is a long term process, the model we built and the data we fit in competition model are in the view of large time scale (few days). Therefore, the model only provides information about how our product affects the final pH result from bacterial metabolism, that is, the minimum pH value in Stephan curve. However, dentistry experts gave us suggestions that besides from the raising of minimum pH, <b>showing how our product influence Stephan curve to dentists and the public may be more persuasive.</b></p> |
| | + | <img src="/wiki/images/a/a1/NYMU14_stephen_data.png" style="display: block;width: 500px;margin: 0 auto;"><p style=" text-align: center; ">Figure 1: Data[4] referred to as the Stephan Curve, describing the impact of food and bacteria plague on the oral pH.</p> |
| | + | <p> |
| | + | Here we try to use the bacteria population derived in competition model to fit the general Stephan curve proposed by RM Stephan[4]. Studies have shown that in short time scale, the change of pH is proportional to the amount of bacteria, which correlates to our growth & pH model. Moreover, there are also some driving forces such as salivary[5], water, or oxygen content that would buffer and rebound the pH value. Therefore, we build a model for Stephan curve simulation with the consideration of bacteria amount and a upward driving force.</p><p> |
| | + | <!-- |
| | + | Although the aim of our project is to provide a long term oral care for everyone, there are still some concerns about the effective duration of our product. Both the flux of salivary and drinks would reduce the amount of phage we apply in oral cavity, as well as the M102 phage resistance result from selection. Therefore, we do literature search to figure out the probability of phage loss [6] and S. mutans resistance, and estimate the effective duration of our product. |
| | + | --> |
| | </p> | | </p> |
| - | <h1>Models and mathematic equations</h1> | + | <h1 id='2c1-2'>Models and mathematic equations</h1> |
| - | <p>Three well known growth models (Logistic, Gompertz, and Richartz)are used in this work. Characteristic model parameters (such as lag phase (λ), maximal growth rate (µ-max slope), stationary phase (A-max growth value)) are derived from our experimental data. Bootstrap and cross-validation techniques are used for estimating confidence intervals of | + | <p>There are some possible factors that results in Stephen curve, such as the amount of resources (eg. glocuse) bacteria can use, the metabolism of bacteria, the saliva flow, buffer effect……</p><p> |
| - | all derived parameters.<br><br>
| + | The initial drop in pH is due to the microbes that are able to metabolize glucose, and generate acidic productions. After the glucose is gradually taken by bacteria, glycolysis and acid production is slowed down, and so does pH drop. The lowest pH is highly related to microbial composition, as we mentioned before.</p><p> |
| - | The aim is to integrate the experimental data into different growth models and to compare the models using statistical methods (AIC and maximum likelihood were used). We believe, and many scientists do, that model selection is the most important part in model-experiment based research-<i>The right data with the right model</i>.</p><br> | + | As for the rise of pH, it’s mainly due to acid product diffusing out and saliva flow. Saliva act as a buffer and its bicarbonate can neutralize the acids. It’s a very important factor that can lessen the low pH condition.</p><p> |
| - | <p>
| + | Based on the above and the Stephen curve data, we simulate the Stephen curve by an estimated equation:</p><p> |
| - | <b>Logistic Model:</b>
| + | $$\frac{dpH}{dt}=\sum(x_i vpH_i) \frac{a}{t} + b$$</p> |
| - | $$\begin{align} | + | <p>The term $x_i$ and $vpH_i$ is the microbial composition and the acid producing ability of each species. The term $\frac{a}{t}$ describes the slowing of pH drop by time. The term $b$ is the pH increasing factor, such as saliva buffer and the diffusing of acid products. |
| - | y(t)&=\frac{A}{1+\exp\left(\frac{4\mu}{A}(\lambda-t)+2\right)}
| + | |
| - | \end{align}$$
| + | |
| - | <b>Gompertz Model:</b> | + | |
| - | $$\begin{align} | + | |
| - | y(t)&=A.\exp\left[-\exp\left(\frac{\mu.\exp(1)}{A}(\lambda-t)+1\right)\right]
| + | |
| - | \end{align}$$
| + | |
| - | <b>Richartz Model:</b>
| + | |
| - | \begin{align}
| + | |
| - | y(t)&=A.\left[1+\nu\exp\left(1+\nu+\frac{\mu}{A}(1+\nu)^{1+1/\nu}(\lambda-t)\right)\right]^{-1/\nu}
| + | |
| - | \end{align}
| + | |
| - | $\nu$ is a shape parameter (in the richartz model only)
| + | |
| | </p> | | </p> |
| - | <h1>pH model</h1> | + | <h1 id='2c1-3'>Result and model validation</h1> |
| - | <p>Existed model is | + | <p>We applied the above modeled Stephen curve equation and use parameter fitting method[7] to fit unknown parameter $a,b$ and get the simulated result, compared with real data, as later <b>we wanted to see how changing microbial composition would affect the pH in oral cavity.</b></p> |
| - | $$\begin{align}
| + | <img src="/wiki/images/f/f0/NYMU14_m4_data_fit.png" style="width: 500px; margin: 0 auto; display: block;"><p style=" text-align: center; ">Figure 2: Experimental data and simulated Stephen curve.</p> |
| - | \frac{dpH}{dP}&=k(pH-pH_{min})
| + | <p>The result of our competition model showed that if the population size of S. mutans is 72% of its original size, it could lead to a higher pH level. Base on this reason, we altered the microbial composition. In figure 3, the <span style="color:blue;">blue line</span> is the Stephen curve from original composition. The <span style="color:red;">red line</span> is the Stephen curve from the altered ecology, the balance from restricting the number of S. mutans to 72% of original.</p> |
| - | \end{align}$$
| + | <img src='/wiki/images/b/bc/NYMU14_m4_comparepH.png' style="width: 500px; margin: 0 auto; display: block;"><p style=" text-align: center; ">Figure 3: Stephen curve from original and altered ecology.</p> |
| - | However, this model is not appropriate for our experimental data; we used linear regression model instead.
| + | <p>The result showed that altered ecology can leads to a better condition for our oral cavity since the area of pH under 5.5 is less.</p> |
| - | $$pH=\alpha + \beta OD +\epsilon$$
| + | <h1 id='2c1-4'>Reference</h1> |
| - | where $\epsilon$ is a random error or noice (which helps to capture a measurement error and other unknown factors). And it is assumed to be Gaussian (normal distribution function), $\epsilon = N(\theta,\sigma^{2})$, with mean $\theta$ and constant variance $\sigma^{2}$. $\alpha$ and $\beta$ are model parameters.
| + | <ol> |
| - | </p>
| + | <li>Gibbons, R. and J. Houte, Dental caries. Annual review of medicine, 1975. 26(1): p. 121-136.</li> |
| - | <h1>Result and model validation</h1>
| + | <li>Leach, S., Some notes on the solubility of enamel and dentine in acid. Archives of oral biology, 1960. 1(3): p. 218-232.</li> |
| - | <img src="/wiki/images/a/af/NYMU14_model1_simulGrowth.png" style="display: block;width: 500px;margin: 0 auto;"><p style=" text-align: center; ">Figure 1: Simulation results of the growth curve</p><br> | + | <li>Stephan Curves: The Basics. Available from: http://www.ncl.ac.uk/dental/oralbiol/oralenv/tutorials/stephancurves1.htm.</li> |
| - | <p>Our experimental data are implemented in the three proposed models. AIC is used to measure the performance of the models and the result shows that Logistic and Richartz models are approximately the same, but slightly different from Gompertz. However, using 95% confidence interval all of them are appropriate to fit the given data.<br><br> | + | <li>Stephan, R.M., Intra-oral hydrogen-ion concentrations associated with dental caries activity. Journal of Dental Research, 1944. 23(4): p. 257-266.</li> |
| - | <img src="/wiki/images/5/52/NYMU14_model1_modelValidation.png" style="display: block;width: 500px;margin: 0 auto;"><p style=" text-align: center; ">Figure 2: Shows validation test(t*) for the fitted model</p><br> | + | <li>Edgar, W. and S. Higham, Role of saliva in caries models. Advances in dental research, 1995. 9(3): p. 235-238.</li> |
| - | <p>The validation test (plot of the residuals), as Figure 2, shows that the simulation result obtained from bootstrap samples is suitable to estimate the model parameters.<br><br> | + | <li>Van Houte, J. and D. Green, Relationship between the concentration of bacteria in saliva and the colonization of teeth in humans. Infection and immunity, 1974. 9(4): p. 624-630.</li> |
| - | Using our experimental data as initials samples, we applied Bootsrap statistical to sample empirical data. The simulated result is presented as Figure (1). And, the estimated model parameters (mu(µ), lamda(λ), A) are summarized as Table 1.
| + | </ol> |
| - | $$\text{Table 1: Estimated Model Parameter}$$
| + | |
| - | </p> | + | |
| - | <pre> | + | |
| - | -------------------------------------------
| + | |
| - | mu lamda A
| + | |
| - | ===========================================
| + | |
| - | Lower 0.294 16.041 1.155
| + | |
| - | Mean 0.384 16.456 1.187
| + | |
| - | Upper 0.474 16.871 1.220
| + | |
| - | Std 0.046 0.212 0.016
| + | |
| - | ------------------------------------------- | + | |
| - | Integral value: 16.622
| + | |
| - | -------------------------------------------
| + | |
| - | </pre> | + | |
| - | <p> | + | |
| - | From the result on table $1$, the $lower$ and $upper$ values are the estimated confidence intervals of the corresponding parameters. $Std$-standard deviation) and $mean$-average values are obtained from the bootstrap samples. These results are used in the proposed three growth models. After the approprate models are selected (in our case, the three proposed models are equally approprate), the parameters are taken as an intial values for the interaction model; which is used to study the growth of S.mutant in the presence of other species(see <a href='/Team:NYMU-Taipei/modeling/m2'><b>competition model</b></a>).
| + | |
| - | </p> | + | |
| - | <p>$$\text{Table 2: Analysis of Regression Model}$$</p> | + | |
| - | <pre>
| + | |
| - | ==============================================================
| + | |
| - | Estimated parametrs: | Statistical Tests:
| + | |
| - | Intercept (alpha)=7.6074 | R-squared= 0.9135
| + | |
| - | OD (beta)=-2.0365 | p-value=6.228e-14
| + | |
| - | --------------------------------------------------------------
| + | |
| - | F-statistic=254.6
| + | |
| - | ===============================================================
| + | |
| - | </pre> | + | |
| - | <p>Using the table 2 result, the pH model can be estimated as: | + | |
| - | $$pH=7.61 - 2.04 OD$$
| + | |
| - | There is a strong linear correlation between pH and OD (R=0.9135, F=254.5, P.value $<$0.05). The coefficient value indicates that for every additional unit in OD we can expect pH to decrease by an average of 2.04. For examples: if the OD=1, pH is expected to be (pH=7.61 - 2.04(1))=5.57. The red fitted line graphically shows the same information.</p><br>
| + | |
| - | <img src='/wiki/images/2/25/NYMU14_model1_FittedModels.png' style="display: block;width: 700px;margin: 0 auto;"><p style=" text-align: center; ">Figure 3: Shows model comparison-the shaded regions indicate a 95% confiden interval of the model fits (bold lines)</p><br>
| + | |
| - | <p>If we move left or right along the x-axis by an amount that represents a one unit change in OD, the fitted line falls by 2.04 units. If the fitted line was flat (a slope coefficient of zero), the expected value for pH would not change no matter how far up and down the line you go. So, the low p-value ($\leq$ 0.05) suggests that the slope is not zero, which in turn suggests that changes in the predictor variable(OD) are associated with changes in the response variable (pH). <i>R-squared</i> is a statistical measure of how close the data are to the fitted regression line. It is also known as the coefficient of determination. It is the percentage of the response variable variation that is explained by a linear model. In this case, R-square =0.9135 shows that 91.35% of the pH variation is explained by OD, and the remain 8.65 can be explained by other factors that are not considered in the regression model. </p> | + | |
| - | <img src="/wiki/images/6/61/NYMU14_model1_ciODph.png" style="display: block;width: 500px;margin: 0 auto;"><p style=" text-align: center; ">Figure 4: ph vs OD with 95% confident interval</p><br>
| + | |
| - | <img src="/wiki/images/1/11/NYMU14_model1_regression.png" style="display: block;width: 500px;margin: 0 auto;"><p style=" text-align: center; ">Figure 5: Model Fit</p><br>
| + | |
| - | <img src="/wiki/images/4/43/NYMU14_model1_residuals.png" style="display: block;width: 500px;margin: 0 auto;"><p style=" text-align: center; ">Figure 6: Validation Test</p><br>
| + | |
| - | <h1>Conclusion</h1> | + | |
| - | <h1>Reference</h1>
| + | |
| - | | + | |
| | </div> | | </div> |
| | + | </div> |
| | </html> | | </html> |
| | {{:Team:NYMU-Taipei/NYMU14_Footer}} | | {{:Team:NYMU-Taipei/NYMU14_Footer}} |
Stephan curve model
Purpose
- To quantize and prove the effectiveness of our product on “Stephan curve”, a crucial curve for dental decay assessment which shows pH drop in mouth after ingestion.
- To figure out the effective duration of our product and display it in term of Stephan curve.
Introduction
Stephan curve illustrates the change in oral pH within few minutes in response to a cariogenic challenge, which is mainly caused by the bacterial metabolism of sugar-rich food. As we have mentioned, oral pH plays important role in caries assessment, since the solubility and demineralization[1] of the tooth is pH dependent[2]. The longer time oral pH is below “critical pH 5.5”, the more likely dental plaque is to take place. Therefore, the cariogenicity is measured as the area delimited by the Critical pH and the Stephan Curve[3].
In our competition model, we have shown how the population shift would cause the change of pH value. As population shift in oral cavity is a long term process, the model we built and the data we fit in competition model are in the view of large time scale (few days). Therefore, the model only provides information about how our product affects the final pH result from bacterial metabolism, that is, the minimum pH value in Stephan curve. However, dentistry experts gave us suggestions that besides from the raising of minimum pH, showing how our product influence Stephan curve to dentists and the public may be more persuasive.
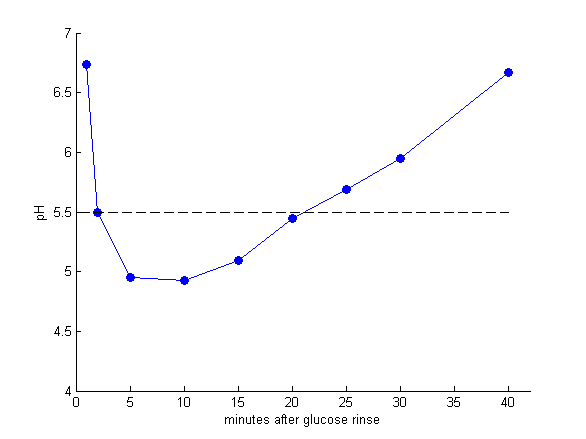
Figure 1: Data[4] referred to as the Stephan Curve, describing the impact of food and bacteria plague on the oral pH.
Here we try to use the bacteria population derived in competition model to fit the general Stephan curve proposed by RM Stephan[4]. Studies have shown that in short time scale, the change of pH is proportional to the amount of bacteria, which correlates to our growth & pH model. Moreover, there are also some driving forces such as salivary[5], water, or oxygen content that would buffer and rebound the pH value. Therefore, we build a model for Stephan curve simulation with the consideration of bacteria amount and a upward driving force.
Models and mathematic equations
There are some possible factors that results in Stephen curve, such as the amount of resources (eg. glocuse) bacteria can use, the metabolism of bacteria, the saliva flow, buffer effect……
The initial drop in pH is due to the microbes that are able to metabolize glucose, and generate acidic productions. After the glucose is gradually taken by bacteria, glycolysis and acid production is slowed down, and so does pH drop. The lowest pH is highly related to microbial composition, as we mentioned before.
As for the rise of pH, it’s mainly due to acid product diffusing out and saliva flow. Saliva act as a buffer and its bicarbonate can neutralize the acids. It’s a very important factor that can lessen the low pH condition.
Based on the above and the Stephen curve data, we simulate the Stephen curve by an estimated equation:
$$\frac{dpH}{dt}=\sum(x_i vpH_i) \frac{a}{t} + b$$
The term $x_i$ and $vpH_i$ is the microbial composition and the acid producing ability of each species. The term $\frac{a}{t}$ describes the slowing of pH drop by time. The term $b$ is the pH increasing factor, such as saliva buffer and the diffusing of acid products.
Result and model validation
We applied the above modeled Stephen curve equation and use parameter fitting method[7] to fit unknown parameter $a,b$ and get the simulated result, compared with real data, as later we wanted to see how changing microbial composition would affect the pH in oral cavity.
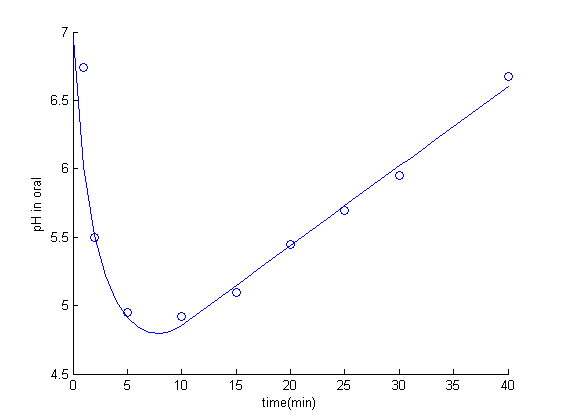
Figure 2: Experimental data and simulated Stephen curve.
The result of our competition model showed that if the population size of S. mutans is 72% of its original size, it could lead to a higher pH level. Base on this reason, we altered the microbial composition. In figure 3, the blue line is the Stephen curve from original composition. The red line is the Stephen curve from the altered ecology, the balance from restricting the number of S. mutans to 72% of original.
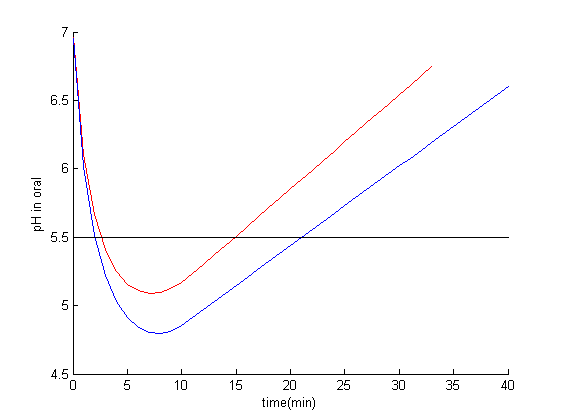
Figure 3: Stephen curve from original and altered ecology.
The result showed that altered ecology can leads to a better condition for our oral cavity since the area of pH under 5.5 is less.
Reference
- Gibbons, R. and J. Houte, Dental caries. Annual review of medicine, 1975. 26(1): p. 121-136.
- Leach, S., Some notes on the solubility of enamel and dentine in acid. Archives of oral biology, 1960. 1(3): p. 218-232.
- Stephan Curves: The Basics. Available from: http://www.ncl.ac.uk/dental/oralbiol/oralenv/tutorials/stephancurves1.htm.
- Stephan, R.M., Intra-oral hydrogen-ion concentrations associated with dental caries activity. Journal of Dental Research, 1944. 23(4): p. 257-266.
- Edgar, W. and S. Higham, Role of saliva in caries models. Advances in dental research, 1995. 9(3): p. 235-238.
- Van Houte, J. and D. Green, Relationship between the concentration of bacteria in saliva and the colonization of teeth in humans. Infection and immunity, 1974. 9(4): p. 624-630.
 "
"