"
"


Background
Dental caries is defined as demineralization of tooth enamel[1]. Because tooth enamel solubility is pH dependent[2], acid production in plaque area is believed to be crucial for caries development. In 1940, Stephan has discovered that the longer time pH value of oral cavity is below “critical pH 5.5”, the more susceptible tooth enamel is. Therefore, NYMU team plans to prevent tooth caries via eliminating S. mutans, the main cariogenic bacteria that produce most of the acid[3].
However, studies have shown that when S. mutans no longer adapts to the environment, or the amount of S. mutans decreased to an extent, other species will become dominant instead[4] . Thus, there is concern that if we kill S. mutans excessively, other bacteria population would grow, and cause caries or do other harm to the oral cavity. Due to the limitation of our lab, we cannot do experiment in vitro or in multi-species culture to verify the saying. We then use modelling, the competition model, to demonstrate the reason why we cannot kill all S. mutans, and find the optimize amount of S. mutans elimination to prevent caries without concerning other cariogenic bacteria.
In our competition model, we choose to use Lotka–Volterra competition model, which based on logistic equation, for it fits very well with our experimental data on S. mutans growth curve. We choose four species that can produce acid and occupy high proportion in our oral cavity as the subjects of modeling, which are S. mutans, S. sobrinus, S. mitis[5], and Neisseria mucosa[6]. To validate our model more realistically and precisely, we use 16S rRNA gene sequencing data from a paper published in 2012, which samples from 36 human[7] , to find out how bacteria compete in oral cavity. Moreover, we use experimental data from literature to know how populations shift effect oral pH value. Then we can find out the optimal S. mutans population that would maximize oral pH value, and therefore prevent caries from happening.
Models and mathematic equations
Competitive Lotka–Volterra equation presents the competition between two or more species for limiting resources[8].
$$\frac{dx_i}{dt}=r_i x_i (1-\frac{\sum\limits_{j=1}^N a_{ij} x_j}{K_i})$$
The model is based on logistic growth equation.$$\frac{dx}{dt}=r x (1-\frac{x}{K})$$
The $(1-\frac{x}{K})$ term means growth rate is limited by intraspecific competition, while x is population size and K is the maximum population size[9]. The matrix a$(\begin{bmatrix} a_{11} & a_{12} & \cdots & a_{1N}\\a_{21} & a_{22} & \cdots & a_{2N}\\ \vdots & \vdots & \ddots & \vdots\\a_{N1} & a_{N2} & \cdots & a_{NN} \end{bmatrix})$ represent the interspecies interaction. $a_{12}$ represents the effect species 2 has on the population of species 1. For example, if species 1 is a strong competitor, $a_{21}, a_{31}, a_{41}$...would have greater value, which turns out to negatively influence other species by reducing population sizes.
We choose Lotka–Volterra competition model because it demonstrate multispecies competition clearly, and its basis, logistic growth curve, fits well with our experimental data(see growth & pH model).
As for stimulating the change of pH value due to population shift, we obtain the acidogenicity of each four species from literature[5] due to the limitation of operating multiple bacteria species in our lab. As we have shown in the growth & pH model, the S. mutans population and the pH value is in positive linear correlation. As a result, it is reasonable for us to assume that pH value can be modelled in a linear function of the species population size, which coefficient depends on the acidogenicity of that species.In mathematic equations, it can be shown as $pH = B\sum(p_i x_i)$, where $x_i$ is the population size of each species, $p_i$ is its acid producing ability, $B$ is a regulating parameter.
Result and model validation
With the bacteria competition data and the ideal model, we can do the parameter fitting for the model. Since we can only know the competition result within time from the data, we want to find out how bacteria interaction with other species and related parameters. That is, in our model, fitting out the, growth rate (r) and maximum population size (K) for each species, and interaction matrix A.
We tried three method to do the data fitting. Finally, we applied Genetic Algorithm [10] , since we get the best result from it among other two algorithms, including trust-region-reflective algorithm [11] and Nelder-Mead simplex algorithm[12].
Figure 1 is the result of our data fitting. The population size is relative, not absolutely, so the y-axis in the data is biologically-meaningless. Color dots are data from previous research, and lines are the modeling result.
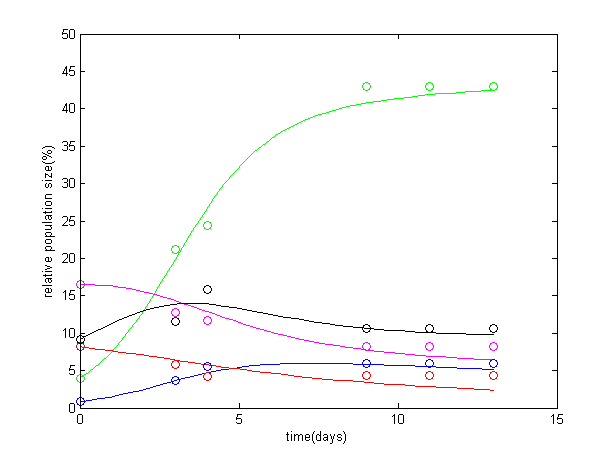
Figure 1: Parameter fitting result of bacteria competition.
There exist some minor error, but the result nearly could demonstrate the competition result. The dominant caries pathogen in our oral cavity is S. mutans (green). Though Veillonella (black) won’t produce acid, it also accounts a high percentage and would have certain impact on the ecology balance, so we take this species into our simulation. Neisseria mucosa (red) and S. mitis (pink) are also major pathogen in our oral cavity, but their population also decline due to the competition. Population of S. sobrinus (blue) doesn’t drop very obviously.
Different species of bacteria has different acid producing ability resulted by metabolism. We use the pH in our oral as the main factor of judging dental decay level. Also, changing one species in the oral ecology can lead to distinct balance of the ecosystem. Thus result in change of the pH level.After we know the competition process of these species, the next step is to know how to control the S. mutans.
By setting a killing threshold, suppressing the population when it reaches the threshold, we can demonstrate the balance of the ecology (as shown in Figure 2) and calculate the corresponding minimum pH level (as shown in Figure 3). Thus, we can know the proper amount to control S. mutans. In our result, controlling the population to approximately 72% (180/250) can result in a highest minimum pH level.
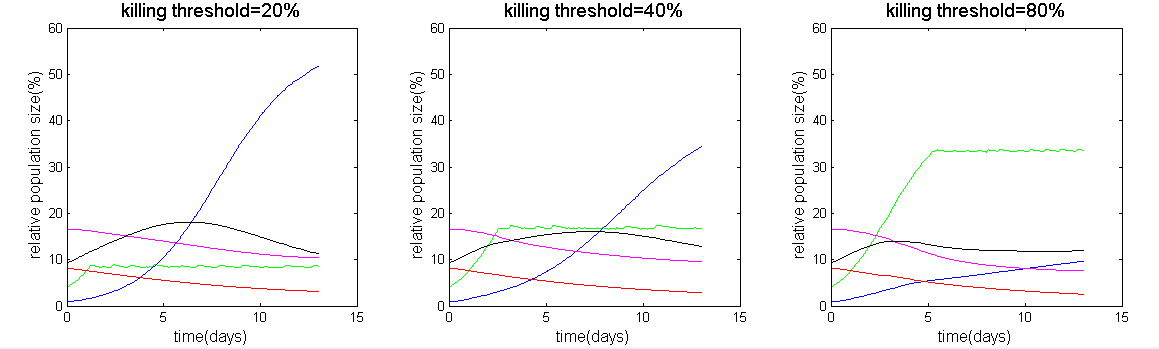
Figure 2: Different killing threshold of S. mutans original population size and the ecosystem.

Figure 3: pH level of setting different killing threshold
In figure 2, we can see that if we eliminating too many S. mutans, it would give rise to the S. sobrinus, which is also a species that has a great acid producing ability. In figure 3, in each different threshold, we can calculate the minimum pH level, and we can find out which threshold has the maximum minimum pH level, which represent less harm to our teeth.