"
"


Introduction
Stephan curve illustrates the change in oral pH within few minutes in response to a cariogenic challenge, which is mainly caused by the bacterial metabolism of sugar-rich food. As we have mentioned, oral pH plays important role in caries assessment, since the solubility and demineralization[1] of the tooth is pH dependent[2]. The longer time oral pH is below “critical pH 5.5”, the more likely dental plaque is to take place. Therefore, the cariogenicity is measured as the area delimited by the Critical pH and the Stephan Curve[3].
In our competition model, we have shown how the population shift would cause the change of pH value. As population shift in oral cavity is a long term process, the model we built and the data we fit in competition model are in the view of large time scale (few days). Therefore, the model only provides information about how our product affects the final pH result from bacterial metabolism, that is, the minimum pH value in Stephan curve. However, dentistry experts gave us suggestions that besides from the raising of minimum pH, showing how our product influence Stephan curve to dentists and the public may be more persuasive.
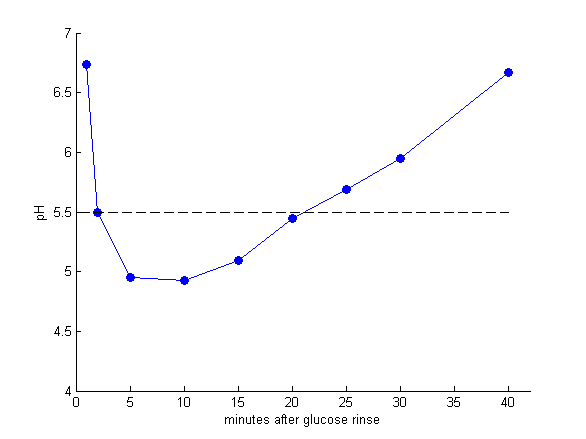
Figure 1: Data[4] referred to as the Stephan Curve, describing the impact of food and bacteria plague on the oral pH.
Here we try to use the bacteria population derived in competition model to fit the general Stephan curve proposed by RM Stephan[4]. Studies have shown that in short time scale, the change of pH is proportional to the amount of bacteria, which correlates to our growth & pH model. Moreover, there are also some driving forces such as salivary[5], water, or oxygen content that would buffer and rebound the pH value. Therefore, we build a model for Stephan curve simulation with the consideration of bacteria amount and a upward driving force.
Models and mathematic equations
There are some possible factors that results in Stephen curve, such as the amount of resources (eg. glocuse) bacteria can use, the metabolism of bacteria, the saliva flow, buffer effect……
The initial drop in pH is due to the microbes that are able to metabolize glucose, and generate acidic productions. After the glucose is gradually taken by bacteria, glycolysis and acid production is slowed down, and so does pH drop. The lowest pH is highly related to microbial composition, as we mentioned before.
As for the rise of pH, it’s mainly due to acid product diffusing out and saliva flow. Saliva act as a buffer and its bicarbonate can neutralize the acids. It’s a very important factor that can lessen the low pH condition.
Based on the above and the Stephen curve data, we simulate the Stephen curve by an estimated equation:
$$\frac{dpH}{dt}=\sum(x_i vpH_i) \frac{a}{t} + b$$
The term $x_i$ and $vpH_i$ is the microbial composition and the acid producing ability of each species. The term $\frac{a}{t}$ describes the slowing of pH drop by time. The term $b$ is the pH increasing factor, such as saliva buffer and the diffusing of acid products.
Result and model validation
We applied the above modeled Stephen curve equation and use parameter fitting method[7] to fit unknown parameter $a,b$ and get the simulated result, compared with real data, as later we wanted to see how changing microbial composition would affect the pH in oral cavity.
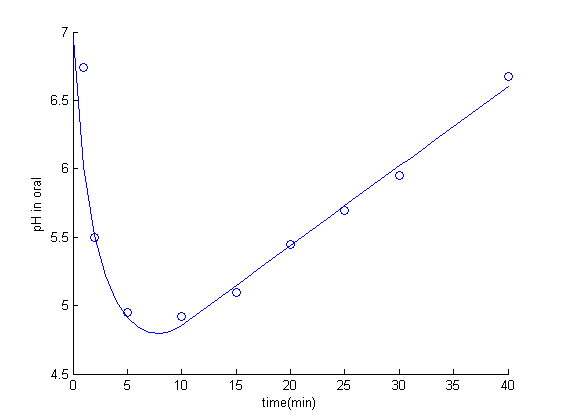
Figure 2: Experimental data and simulated Stephen curve.
The result of our competition model showed that if the population size of S. mutans is 72% of its original size, it could lead to a higher pH level. Base on this reason, we altered the microbial composition. In figure 3, the blue line is the Stephen curve from original composition. The red line is the Stephen curve from the altered ecology, the balance from restricting the number of S. mutans to 72% of original.
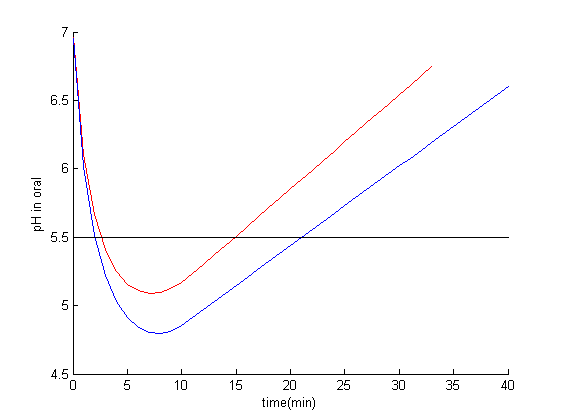
Figure 3: Stephen curve from original and altered ecology.
The result showed that altered ecology can leads to a better condition for our oral cavity since the area of pH under 5.5 is less.
Reference
- Gibbons, R. and J. Houte, Dental caries. Annual review of medicine, 1975. 26(1): p. 121-136.
- Leach, S., Some notes on the solubility of enamel and dentine in acid. Archives of oral biology, 1960. 1(3): p. 218-232.
- Stephan Curves: The Basics. Available from: http://www.ncl.ac.uk/dental/oralbiol/oralenv/tutorials/stephancurves1.htm.
- Stephan, R.M., Intra-oral hydrogen-ion concentrations associated with dental caries activity. Journal of Dental Research, 1944. 23(4): p. 257-266.
- Edgar, W. and S. Higham, Role of saliva in caries models. Advances in dental research, 1995. 9(3): p. 235-238.
- Van Houte, J. and D. Green, Relationship between the concentration of bacteria in saliva and the colonization of teeth in humans. Infection and immunity, 1974. 9(4): p. 624-630.