Team:KIT-Kyoto/Modeling
From 2014.igem.org
Lovetaylor (Talk | contribs) |
|||
| (12 intermediate revisions not shown) | |||
| Line 68: | Line 68: | ||
<h3>Expression in <em>E. coli</em></h3> | <h3>Expression in <em>E. coli</em></h3> | ||
<p class="sentence"> | <p class="sentence"> | ||
| - | The device expresses only when BL21(DE3) strain is used | + | The device expresses only when BL21(DE3) strain is used as the host. In this device, each monoperpene synthetic gene is under the control of <em>tac</em> promoter, so the expression of each monoterpene synthase gene is induced by adding IPTG. By changing the dose of IPTG and the timing of addition, the monoterpene volume changes and the intensity of scent also changes. |
<br>However, <em>E. coli</em> does not have enzyme to synthesize geranyl pyrophosphate (GPP), a basal material for all monoterpene synthesis. So one has to directly add GPP to the medium or transfer the DMAPP transferase gene (ERG20). | <br>However, <em>E. coli</em> does not have enzyme to synthesize geranyl pyrophosphate (GPP), a basal material for all monoterpene synthesis. So one has to directly add GPP to the medium or transfer the DMAPP transferase gene (ERG20). | ||
</p> | </p> | ||
| Line 78: | Line 78: | ||
<div class="PDbox"> | <div class="PDbox"> | ||
| + | <h3>How the Pathways Function</h3> <!--はてなマークつけないのが正しい--> | ||
<p class="sentence"> | <p class="sentence"> | ||
| - | |||
| - | |||
In the two pathways we designed, the behaviors of insects on the plate can be controlled via the scents that can be regulated by the types of monoterpene synthases, the volume and the timing of IPTG addition and the location of colonies on the plate. In our pathways, yeast and <em>E. coli</em> cells become a conductor to orchestrate insects. | In the two pathways we designed, the behaviors of insects on the plate can be controlled via the scents that can be regulated by the types of monoterpene synthases, the volume and the timing of IPTG addition and the location of colonies on the plate. In our pathways, yeast and <em>E. coli</em> cells become a conductor to orchestrate insects. | ||
<br> | <br> | ||
| Line 102: | Line 101: | ||
<h3>Method</h3> | <h3>Method</h3> | ||
<p class="sentence"> | <p class="sentence"> | ||
| - | 200 larvae were placed at the center of an agar plate (2.0%, radius: 8cm). A piece of filter paper was placed on each end of the plate (Figure 1). 2.5µl of limonene was dropped on one side of the filter paper (Limonene) and cover the plate with a lid. Three minutes later, the number of larvae within a 3cm radius from the filter paper was counted (A or B). The concentrations of limonene are diluted by 20% and 10% with DMSO. The control is DMSO.< | + | 200 larvae were placed at the center of an agar plate (2.0%, radius: 8cm). A piece of filter paper was placed on each end of the plate (Figure 1). 2.5µl of limonene was dropped on one side of the filter paper (Limonene) and cover the plate with a lid. Three minutes later, the number of larvae within a 3cm radius from the filter paper was counted (A or B). The concentrations of limonene are diluted by 20% and 10% with DMSO. The control is DMSO. |
| - | + | </p> | |
| - | + | <p class="sentence"> | |
| + | The behavioral effects of incentives were measured by Response Index (RI). The RI is defined as (Ns-Nc)/(Ns+Nc), where Ns is the number of population attracted to limonene, and Nc is the number of population which moved to the control. | ||
| + | </p> | ||
| + | <p class="sentence"> | ||
| + | When all the population move into the radius with limonene, RI is 1 and when all the population move into the radius of control, RI is -1. Positive values mean positive chemotactic effect, and negative values mean negative chemotactic effect.<br> | ||
</p> | </p> | ||
</div> | </div> | ||
| Line 114: | Line 117: | ||
<h3>Result</h3> | <h3>Result</h3> | ||
<p class="sentence"> | <p class="sentence"> | ||
| + | <div class="bioassay"> | ||
<strong>Table 1. With Limonene 100%</strong> | <strong>Table 1. With Limonene 100%</strong> | ||
| - | <div | + | <div class="m_table"> |
<table class="materials"> | <table class="materials"> | ||
<tr> | <tr> | ||
<th>Trial</th> | <th>Trial</th> | ||
| - | <th>A<br>( | + | <th>A<br>(Limonene)</th> |
<th>B<br>(Control)</th> | <th>B<br>(Control)</th> | ||
<th>RI</th> | <th>RI</th> | ||
| Line 148: | Line 152: | ||
</tr> | </tr> | ||
</table> | </table> | ||
| + | </div> | ||
| + | <img src="/wiki/images/3/3b/Kit_Bioassay_fig2.png"> | ||
</div> | </div> | ||
<br> | <br> | ||
| + | <div class="bioassay"> | ||
<strong>Table 2. With Limonene 20%</strong> | <strong>Table 2. With Limonene 20%</strong> | ||
| - | <div | + | <div class="m_table"> |
<table class="materials"> | <table class="materials"> | ||
<tr> | <tr> | ||
<th>Trial</th> | <th>Trial</th> | ||
| - | <th>A<br>( | + | <th>A<br>(Limonene)</th> |
<th>B<br>(Control)</th> | <th>B<br>(Control)</th> | ||
<th>RI</th> | <th>RI</th> | ||
| Line 184: | Line 191: | ||
</tr> | </tr> | ||
</table> | </table> | ||
| + | </div> | ||
| + | <img src="/wiki/images/7/79/Kit_Bioassay_fig3.png"> | ||
</div> | </div> | ||
<br> | <br> | ||
| + | <div class="bioassay"> | ||
<strong>Table 3. With Limonene 10%</strong> | <strong>Table 3. With Limonene 10%</strong> | ||
| - | <div | + | <div class="m_table"> |
<table class="materials"> | <table class="materials"> | ||
<tr> | <tr> | ||
<th>Trial</th> | <th>Trial</th> | ||
| - | <th>A<br>( | + | <th>A<br>(Limonene)</th> |
<th>B<br>(Control)</th> | <th>B<br>(Control)</th> | ||
<th>RI</th> | <th>RI</th> | ||
| Line 220: | Line 230: | ||
</tr> | </tr> | ||
</table> | </table> | ||
| + | </div> | ||
| + | <img src="/wiki/images/1/13/Kit_Bioassay_fig4.png"> | ||
</div> | </div> | ||
<br> | <br> | ||
| Line 273: | Line 285: | ||
pd_s = pd_w/3*2; | pd_s = pd_w/3*2; | ||
$(".pdimg1 img").css({width:pd_w}); | $(".pdimg1 img").css({width:pd_w}); | ||
| - | $(".pdimg2 img,.pdimg3 img").css({width:pd_w1}); | + | $(".pdimg2 img,.pdimg3 img,.bioassay img").css({width:pd_w1}); |
$(".PDs1,.PDs2").css({width:pd_s}); | $(".PDs1,.PDs2").css({width:pd_s}); | ||
} | } | ||
| Line 279: | Line 291: | ||
var m_pdfix =function(){ | var m_pdfix =function(){ | ||
var mpd_w = $(".main-contents").width(); | var mpd_w = $(".main-contents").width(); | ||
| - | $(".pdimg1 img,.pdimg2 img,.pdimg3 img").css({width:mpd_w}); | + | $(".pdimg1 img,.pdimg2 img,.pdimg3 img,.bioassay img").css({width:mpd_w}); |
} | } | ||
$(function(){ | $(function(){ | ||
| Line 320: | Line 332: | ||
float:right; | float:right; | ||
} | } | ||
| - | + | .bioassay{ | |
| + | overflow:hidden; | ||
| + | } | ||
| + | .bioassay img,.bioassay table{ | ||
| + | float:left; | ||
| + | margin-left:20px; | ||
| + | } | ||
@media screen and (max-width: 568px) { | @media screen and (max-width: 568px) { | ||
| Line 329: | Line 347: | ||
.PDs1,.PDs2,.pdimg2,.pdimg3{ | .PDs1,.PDs2,.pdimg2,.pdimg3{ | ||
float:none; | float:none; | ||
| + | } | ||
| + | .bioassay img,.bioassay table{ | ||
| + | float:none; | ||
| + | margin-left:0px; | ||
} | } | ||
} | } | ||
Latest revision as of 20:56, 17 October 2014


Modeling
Parts & Device
Project Concept
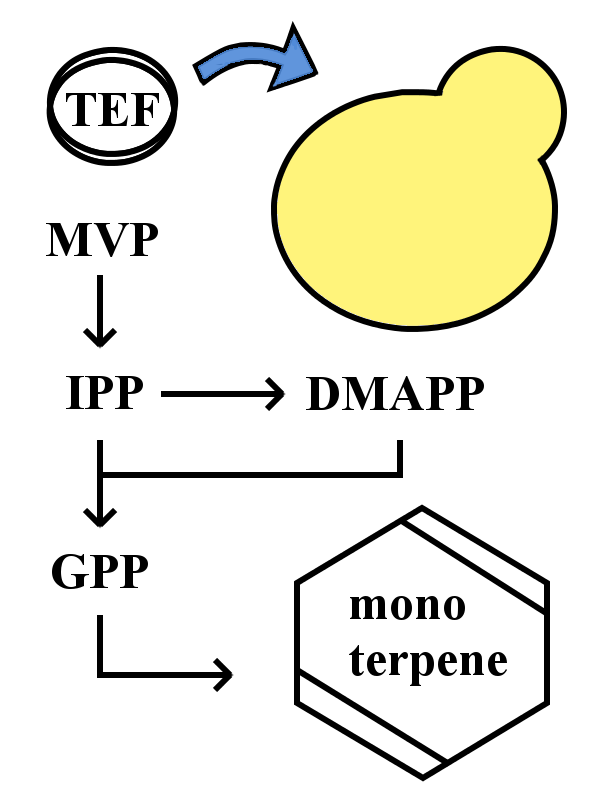
Two monoterpene synthetic systems were designed by combining two monoterpene synthetic enzyme genes which are already on the parts’ list, and γ-terpinene synthetic enzyme gene we submitted as well as two protein devices.
One device is E. coli IPTG-inducing γ-terpinene synthetic pathway, and the other is yeast-based γ-terpinene synthetic pathway.

Expression in S. cerevisiae
The device in this yeast-based monoterpene synthetic pathway uses the S. cerevisiae cells which constantly express monoterpene synthetic enzyme by introducing each gene of monoterpene synthetic enzymes at the downstream of TEF promoter. GPP is constitutively synthesized in yeast cells and its volume is enough for intracellular monoterpene synthesis. Thus a certain monoterpene is easily synthesized by transferring this device into yeast cells.
Expression in E. coli
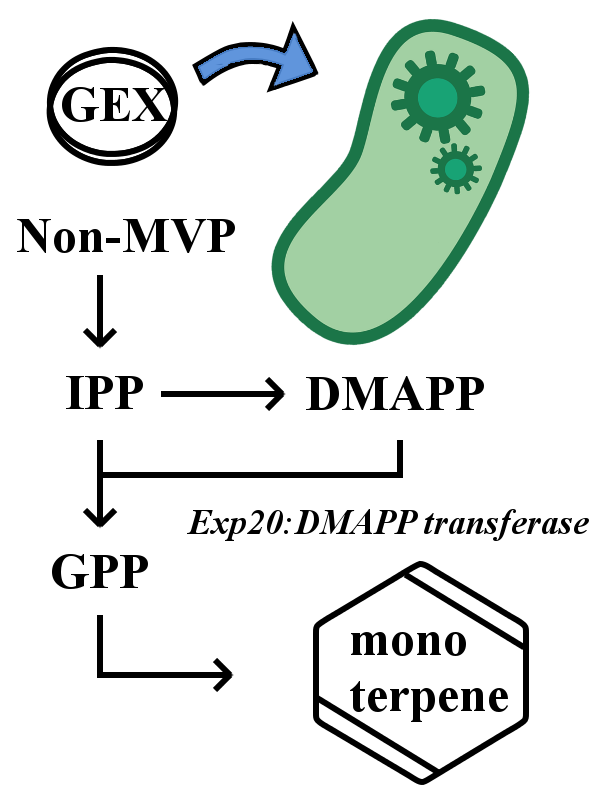
The device expresses only when BL21(DE3) strain is used as the host. In this device, each monoperpene synthetic gene is under the control of tac promoter, so the expression of each monoterpene synthase gene is induced by adding IPTG. By changing the dose of IPTG and the timing of addition, the monoterpene volume changes and the intensity of scent also changes.
However, E. coli does not have enzyme to synthesize geranyl pyrophosphate (GPP), a basal material for all monoterpene synthesis. So one has to directly add GPP to the medium or transfer the DMAPP transferase gene (ERG20).
How the Pathways Function
In the two pathways we designed, the behaviors of insects on the plate can be controlled via the scents that can be regulated by the types of monoterpene synthases, the volume and the timing of IPTG addition and the location of colonies on the plate. In our pathways, yeast and E. coli cells become a conductor to orchestrate insects.
Biological Assay
Purpose
To evaluate the effect of limonene on the behavior of Drosophila melanogaster.
Materials
The first-third instar larvae of Drosophila melanogaster Canton S (CS) as a wild type strain.
Method
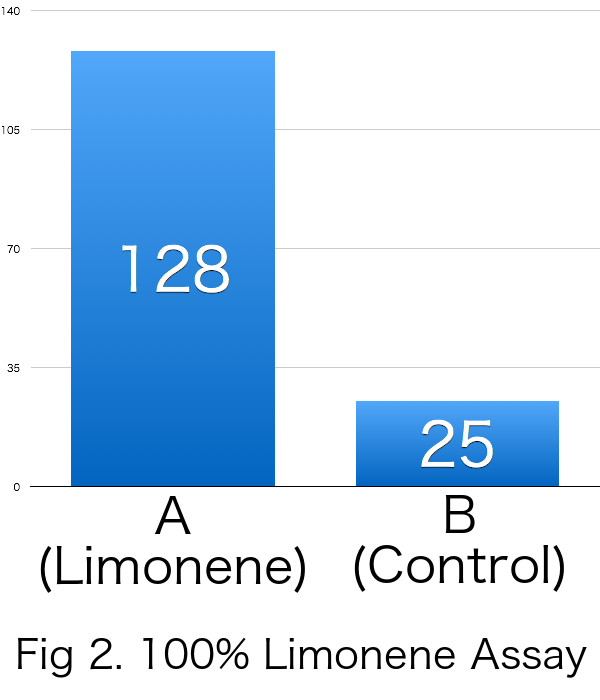
200 larvae were placed at the center of an agar plate (2.0%, radius: 8cm). A piece of filter paper was placed on each end of the plate (Figure 1). 2.5µl of limonene was dropped on one side of the filter paper (Limonene) and cover the plate with a lid. Three minutes later, the number of larvae within a 3cm radius from the filter paper was counted (A or B). The concentrations of limonene are diluted by 20% and 10% with DMSO. The control is DMSO.
The behavioral effects of incentives were measured by Response Index (RI). The RI is defined as (Ns-Nc)/(Ns+Nc), where Ns is the number of population attracted to limonene, and Nc is the number of population which moved to the control.
When all the population move into the radius with limonene, RI is 1 and when all the population move into the radius of control, RI is -1. Positive values mean positive chemotactic effect, and negative values mean negative chemotactic effect.

Result
| Trial | A (Limonene) |
B (Control) |
RI |
|---|---|---|---|
| 1st | 139 | 11 | 0.853 |
| 2nd | 116 | 52 | 0.381 |
| 3rd | 130 | 11 | 0.844 |
| Average | 128 | 25 | 0.678 |
| Trial | A (Limonene) |
B (Control) |
RI |
|---|---|---|---|
| 1st | 115 | 59 | 0.322 |
| 2nd | 96 | 71 | 0.149 |
| 3rd | 133 | 42 | 0.520 |
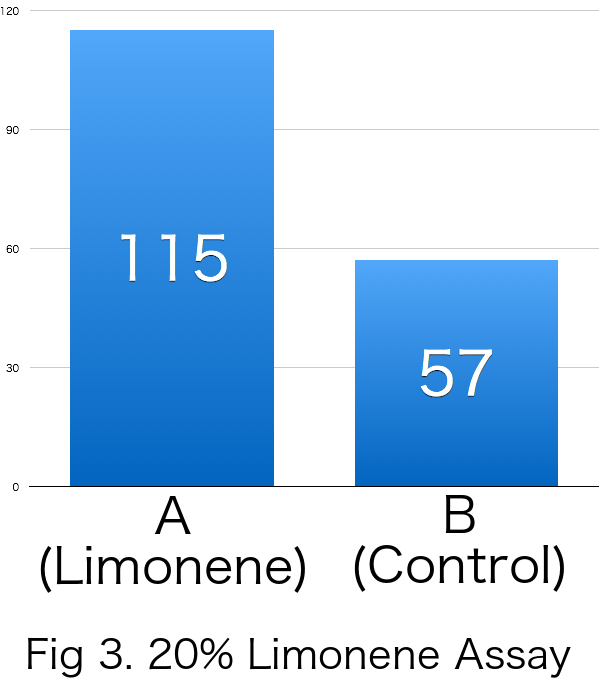
| Average | 115 | 57 | 0.333 |
| Trial | A (Limonene) |
B (Control) |
RI |
|---|---|---|---|
| 1st | 89 | 72 | 0.106 |
| 2nd | 98 | 59 | 0.248 |
| 3rd | 92 | 78 | 0.082 |
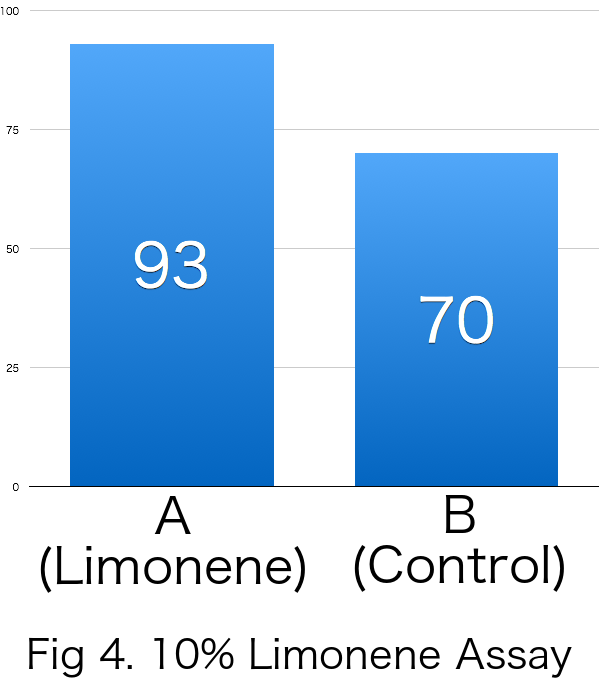
| Average | 93 | 70 | 0.143 |
Discussion
Because RI was over 0 in all the trials, it was revealed that limonene attracts Drosophila melanogaster. Furthermore, it was suggested that the effects of incentives were increased relative to the concentration of limonene.
Reference
Shimoyama, N. (2014). TJB 200000764.
[online] Biol.tsukuba.ac.jp. Available at:
http://www.biol.tsukuba.ac.jp/tjb/Vol3No2/TJB200402200000764.html [Accessed 25 Aug. 2014].
 "
"
