"
"
Team:Oxford/how much can we degrade
From 2014.igem.org
(Difference between revisions)
| Line 104: | Line 104: | ||
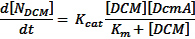
<li>d[Ndcm]/dt = rate of DCM molecule degradation (s-1)</li> | <li>d[Ndcm]/dt = rate of DCM molecule degradation (s-1)</li> | ||
| - | <li> | + | <li>kcat = dcmA turnover rate (= 0.6 s-1 for DM4)</li> |
<li>[DCM] = DCM concentration (= 0.02M for our system)</li> | <li>[DCM] = DCM concentration (= 0.02M for our system)</li> | ||
<li>[DcmA] = Number of DcmA molecules per cell (87576) <a href="https://2014.igem.org/Team:Oxford/what_are_microcompartments?#hide4"> | <li>[DcmA] = Number of DcmA molecules per cell (87576) <a href="https://2014.igem.org/Team:Oxford/what_are_microcompartments?#hide4"> | ||
| Line 478: | Line 478: | ||
<div class="row"> | <div class="row"> | ||
<a href="#show6" class="show modelling-row" id="show6"><div class="modelling"> | <a href="#show6" class="show modelling-row" id="show6"><div class="modelling"> | ||
| - | <h1white>How does the | + | <h1white>How does the kcat of the system affect the output?</h1white> |
<img src="https://static.igem.org/mediawiki/2014/4/4d/Oxford_plus-sign-clip-art.png" style="float:right;position:relative; width:2%;" /> | <img src="https://static.igem.org/mediawiki/2014/4/4d/Oxford_plus-sign-clip-art.png" style="float:right;position:relative; width:2%;" /> | ||
</div></a> | </div></a> | ||
<a href="#hide6" class="hide" id="hide6"><div class="modelling"> | <a href="#hide6" class="hide" id="hide6"><div class="modelling"> | ||
| - | <h1white>How does the | + | <h1white>How does the kcat of the system affect the output?</h1white></div></a> |
<div class="list"> | <div class="list"> | ||
<div class="white_news_block2"> | <div class="white_news_block2"> | ||
| Line 490: | Line 490: | ||
<br><br> | <br><br> | ||
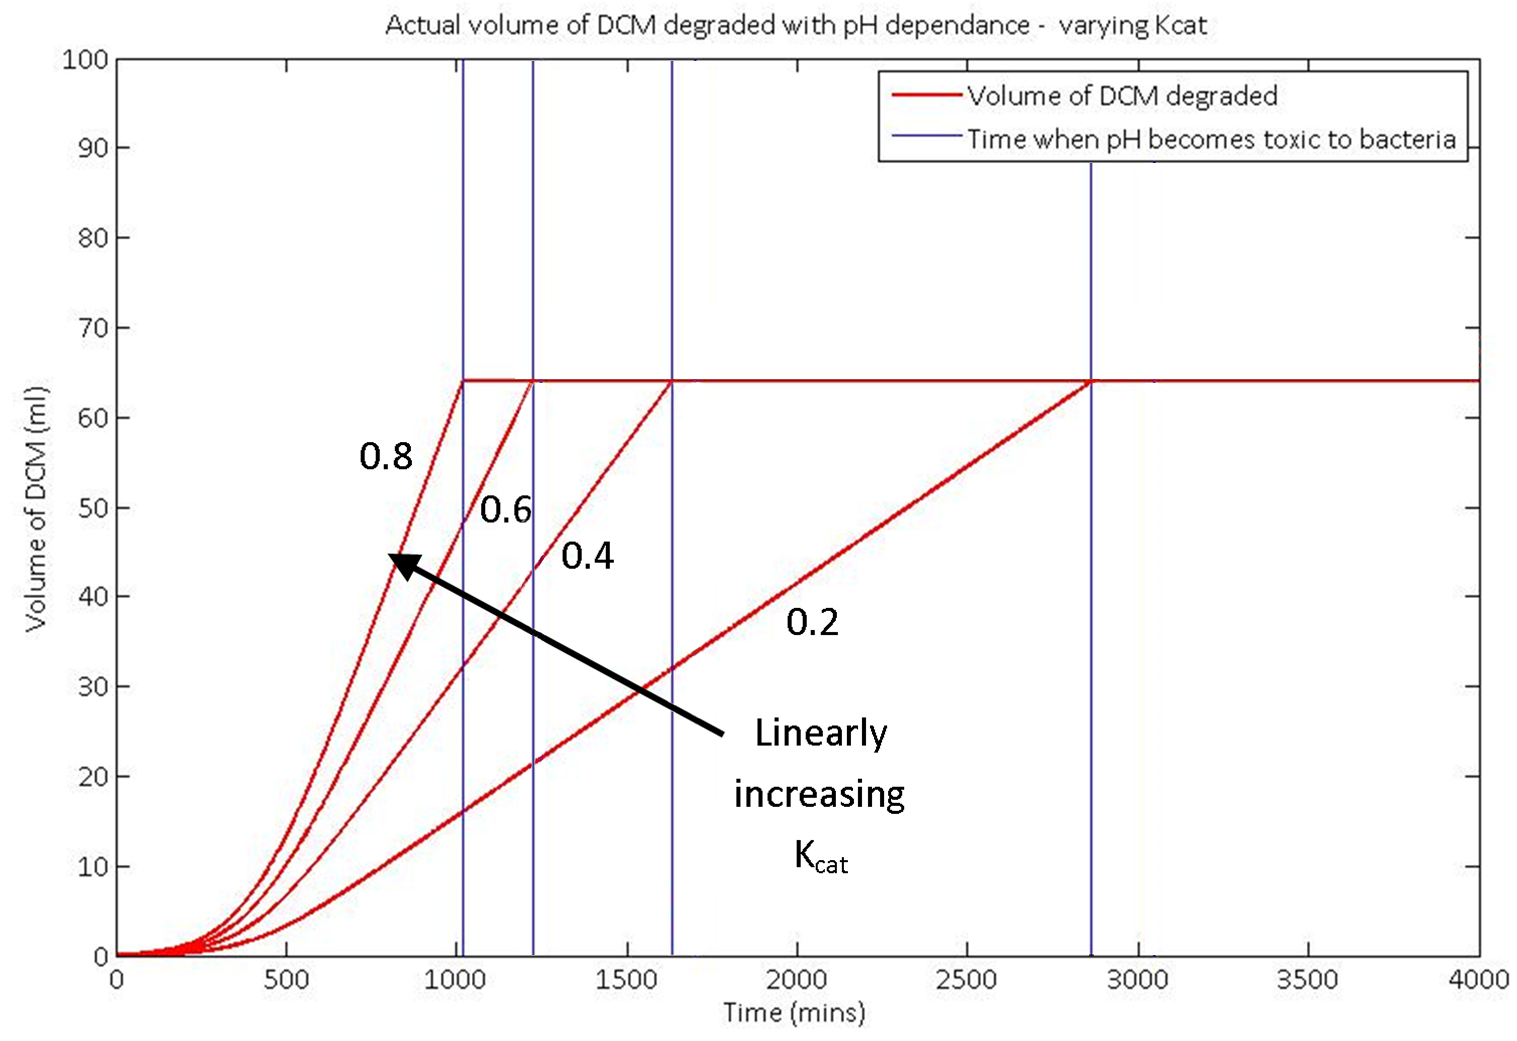
We used our model to predict the response of the system to a change in the kcat value of the DCM degradation enzyme, dcmA. | We used our model to predict the response of the system to a change in the kcat value of the DCM degradation enzyme, dcmA. | ||
| - | Increasing the value of | + | Increasing the value of kcat by a significant amount is unrealistic in the length of our project. However, in future work, the kcat could potentially be substantially improved. |
<br><br> | <br><br> | ||
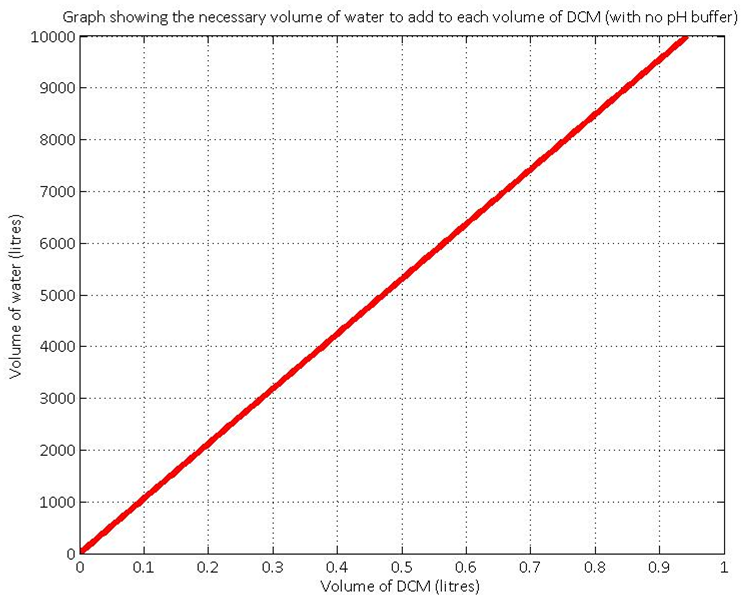
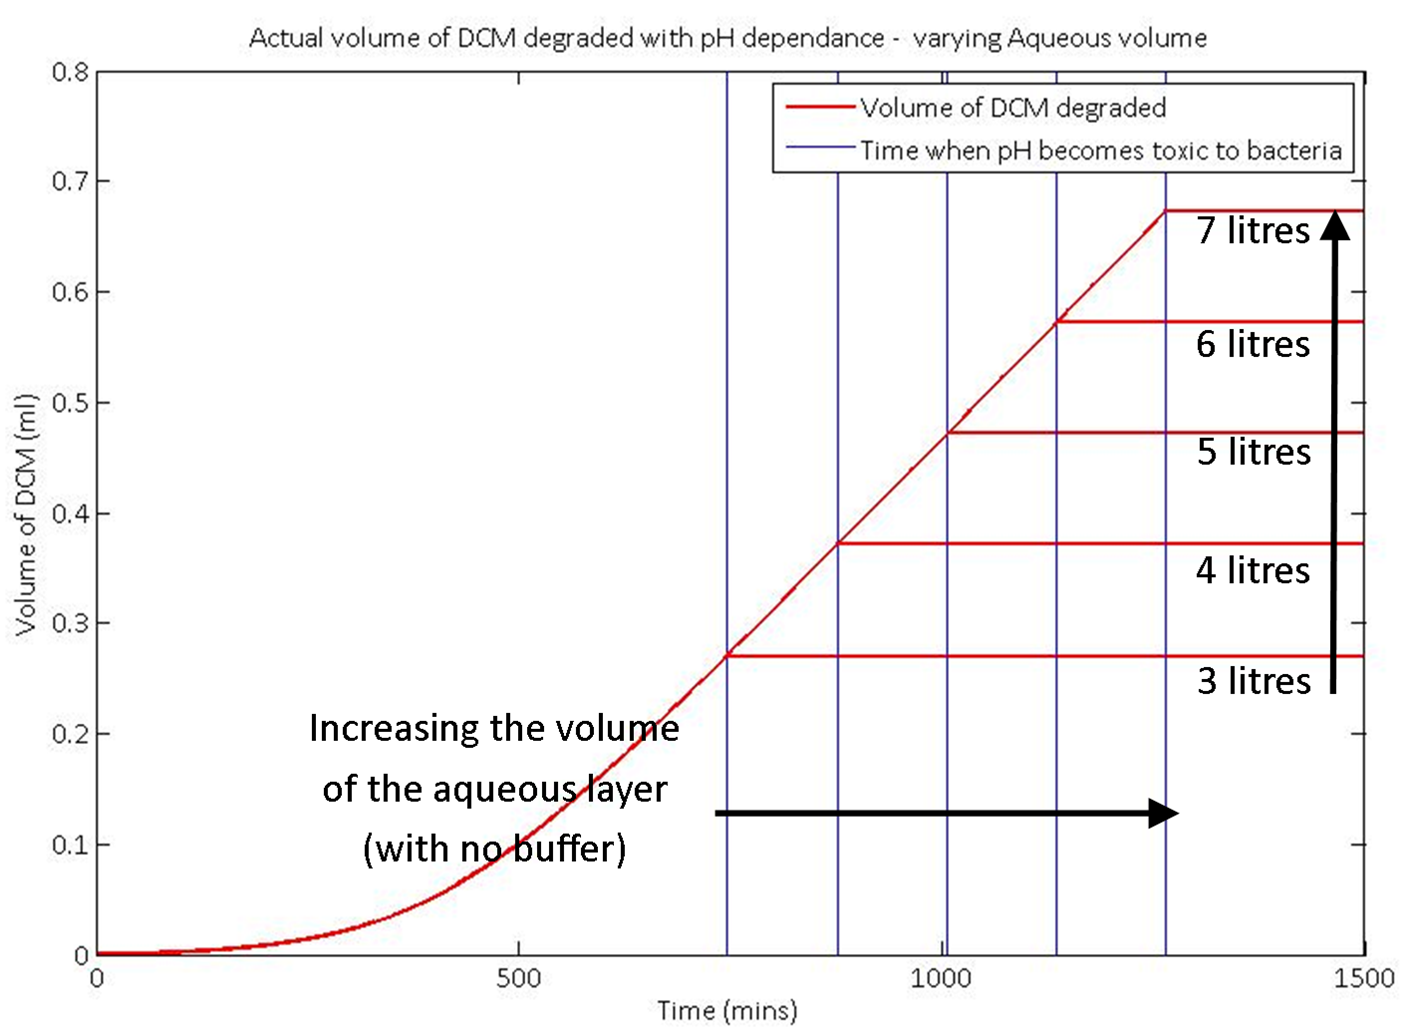
In the graph shown here, the total volume degraded doesn't change. This is because the amount of HCl that the system requires to reach a toxic pH level is constant, as we are not varying the volume of the aqueous layer. To increase the total amount of DCM degraded, we simply need to add more water or a pH buffer to the system. | In the graph shown here, the total volume degraded doesn't change. This is because the amount of HCl that the system requires to reach a toxic pH level is constant, as we are not varying the volume of the aqueous layer. To increase the total amount of DCM degraded, we simply need to add more water or a pH buffer to the system. | ||
Revision as of 00:00, 18 October 2014


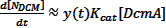
 Multiplying this by our population function, the total rate of DCM degradation is given as:
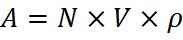
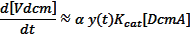
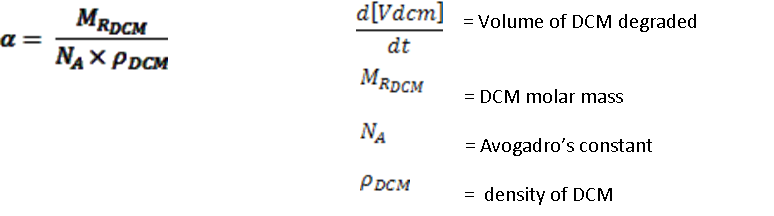
 Turning this into a more recognisable value (a volume) gives the total rate of DCM degradation as:
 Where:
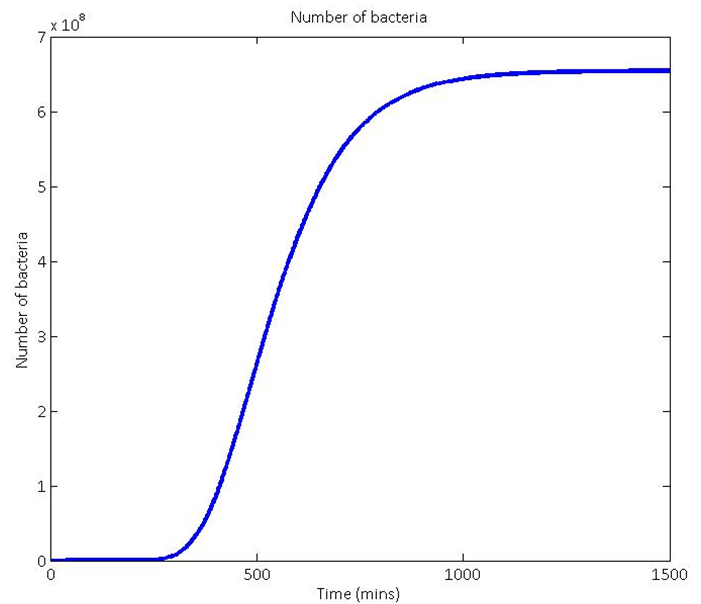
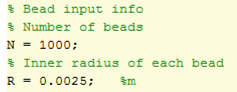
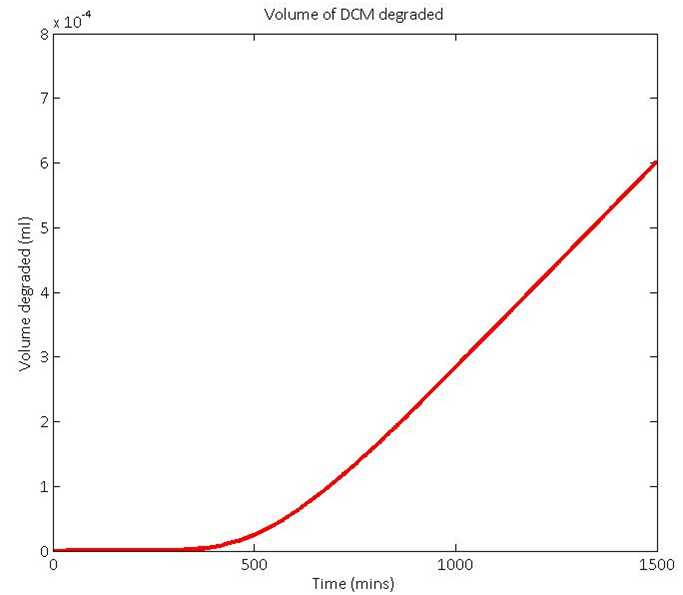
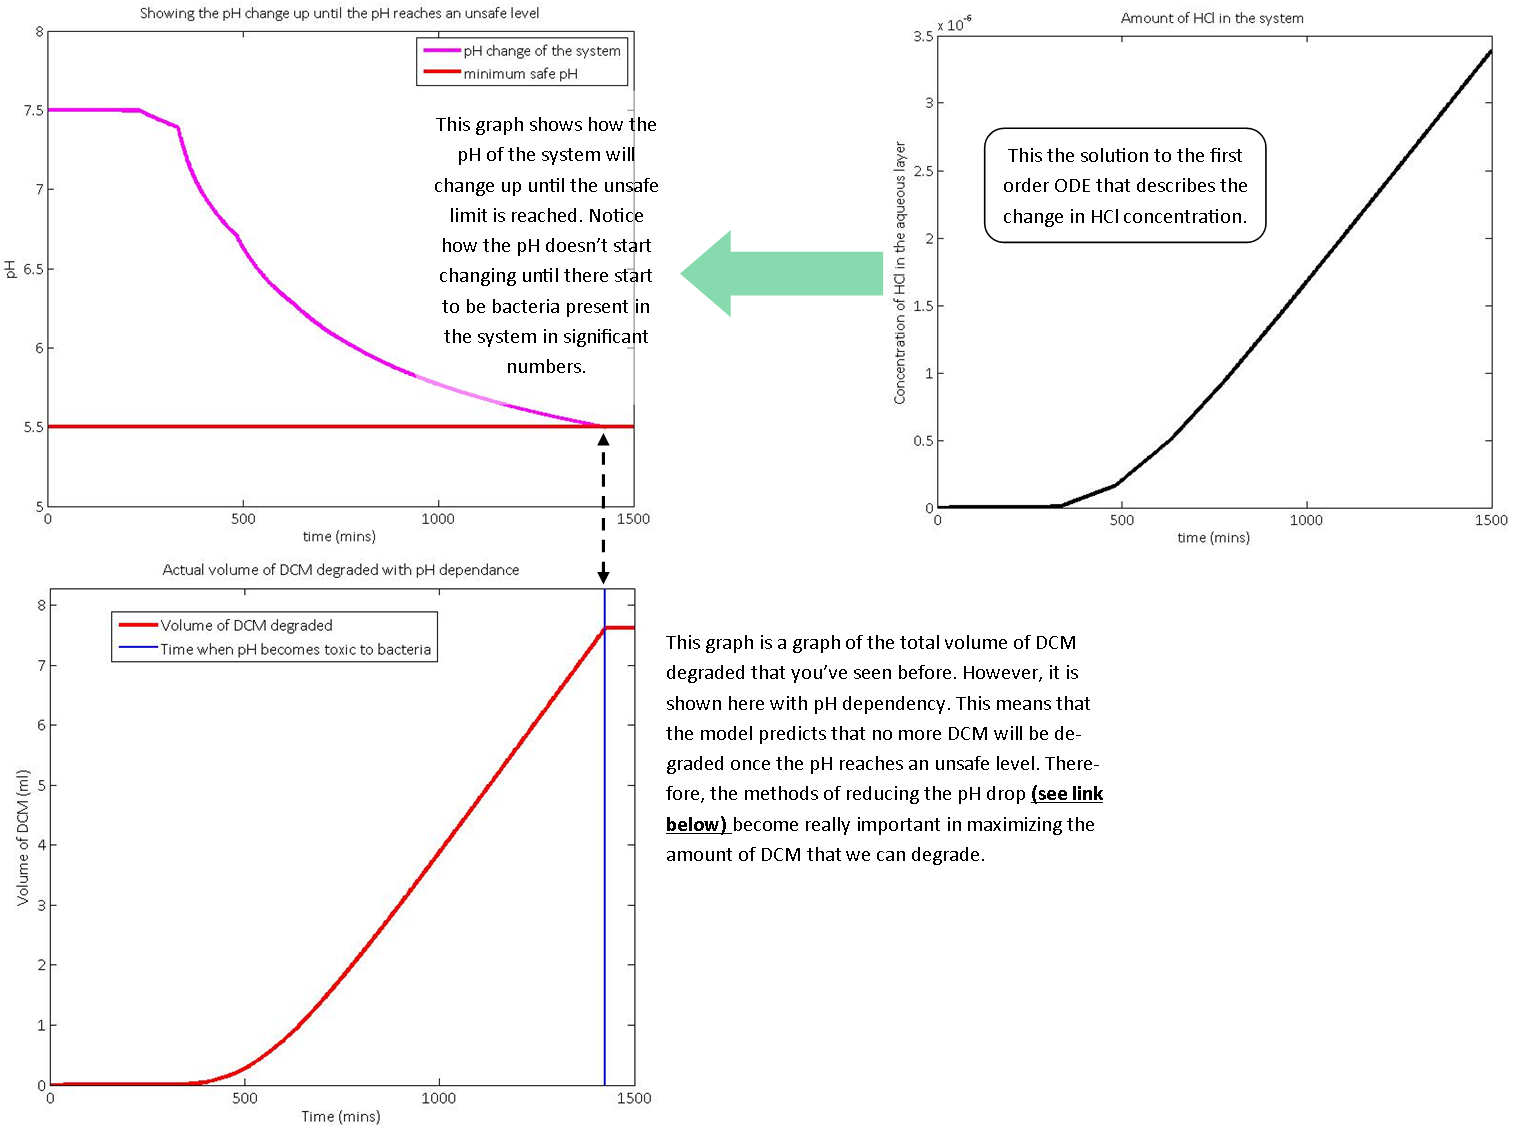
 When all of these calculations were modelled in Matlab with the input conditions shown above, the total volume of DCM that we would predict the native bacteria DM4 to degrade in 24 hours is shown by the red line below. This is before you account for the possible toxicity of the pH drop. This is taken into account in the sections below.
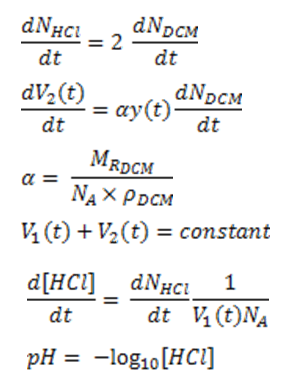
 There is a resulting pH change because of the accumulation of HCl. Because we are dealing with an organic system which cannot tolerate pH<6, we must track the anticipated HCl production and resulting pH change.
The following relationships were used:
There is a resulting pH change because of the accumulation of HCl. Because we are dealing with an organic system which cannot tolerate pH<6, we must track the anticipated HCl production and resulting pH change.
The following relationships were used:

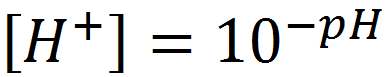
 By definition:
 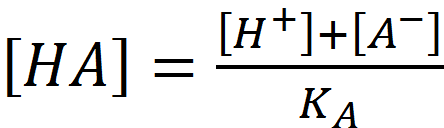 Combining (1.2) and (1.3):
 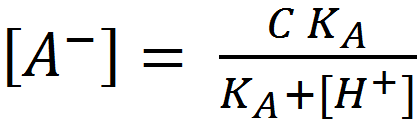 Combining this with (1.1) and the water auto-ionisation constant definition, K_W=[H^+ ][〖OH〗^-], give the moles of strong acid added:
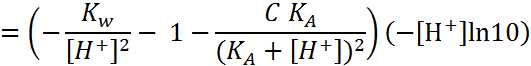
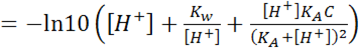
 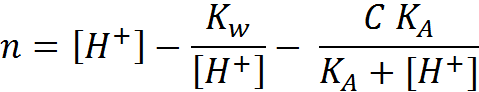 Differentiating with respect to the pH gives the buffer capacity:
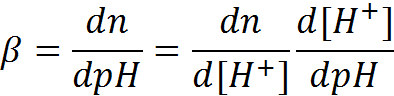
 Which can be generalized for multi-buffer systems:
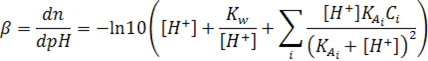
 gives:
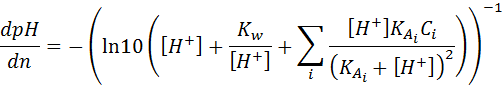
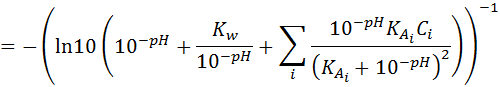 For a single buffer system:
 Numerically solving this ODE in MATLAB, for pH(n, C) and hence pH(t, C) gives:
Upon solving the equation in Matlab, it was clear that only a relatively low concentration (0.05 M) of buffer was needed to significantly reduce the pH change of the solution:
Numerically solving this ODE in MATLAB, for pH(n, C) and hence pH(t, C) gives:
Upon solving the equation in Matlab, it was clear that only a relatively low concentration (0.05 M) of buffer was needed to significantly reduce the pH change of the solution:
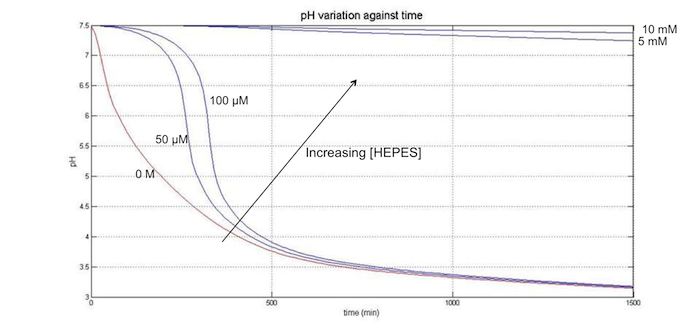 where the red line is C=0M.
 The graph here is for non specific inputs and is for demonstration purposes only. It shows well how the model responds to changing the input values.
 The graph here is for non specific inputs and is for demonstration purposes only. It shows well how the model responds to changing the input values.
 As you can see, using systems with the parameters shown above would increase the amount of product obtained from the same number of bacteria by orders of magnitude and would therefore be highly beneficial to a bioremediation system.
Future work could definitely involve modelling these reactions and investigating the potential benefits before the wet lab work begins.
As you can see, using systems with the parameters shown above would increase the amount of product obtained from the same number of bacteria by orders of magnitude and would therefore be highly beneficial to a bioremediation system.
Future work could definitely involve modelling these reactions and investigating the potential benefits before the wet lab work begins.