Team:Oxford/codon optimisation
From 2014.igem.org


Introduction: Codon Optimisation
In our quest to optimise the process of DCM breakdown, the first step was to move the genes we were interested in into well-characterised host strains. The source bacterium Methylobacterium extorquens DM4 proved very difficult to grow in the lab, and took its leisurely time once it did decide to grow. It's also not a particularly well-studied bacterium, unlike E. coli and P. putida, which we decided to work with. This section explains the concept of codon optimisation, why we used it, and how we did so.
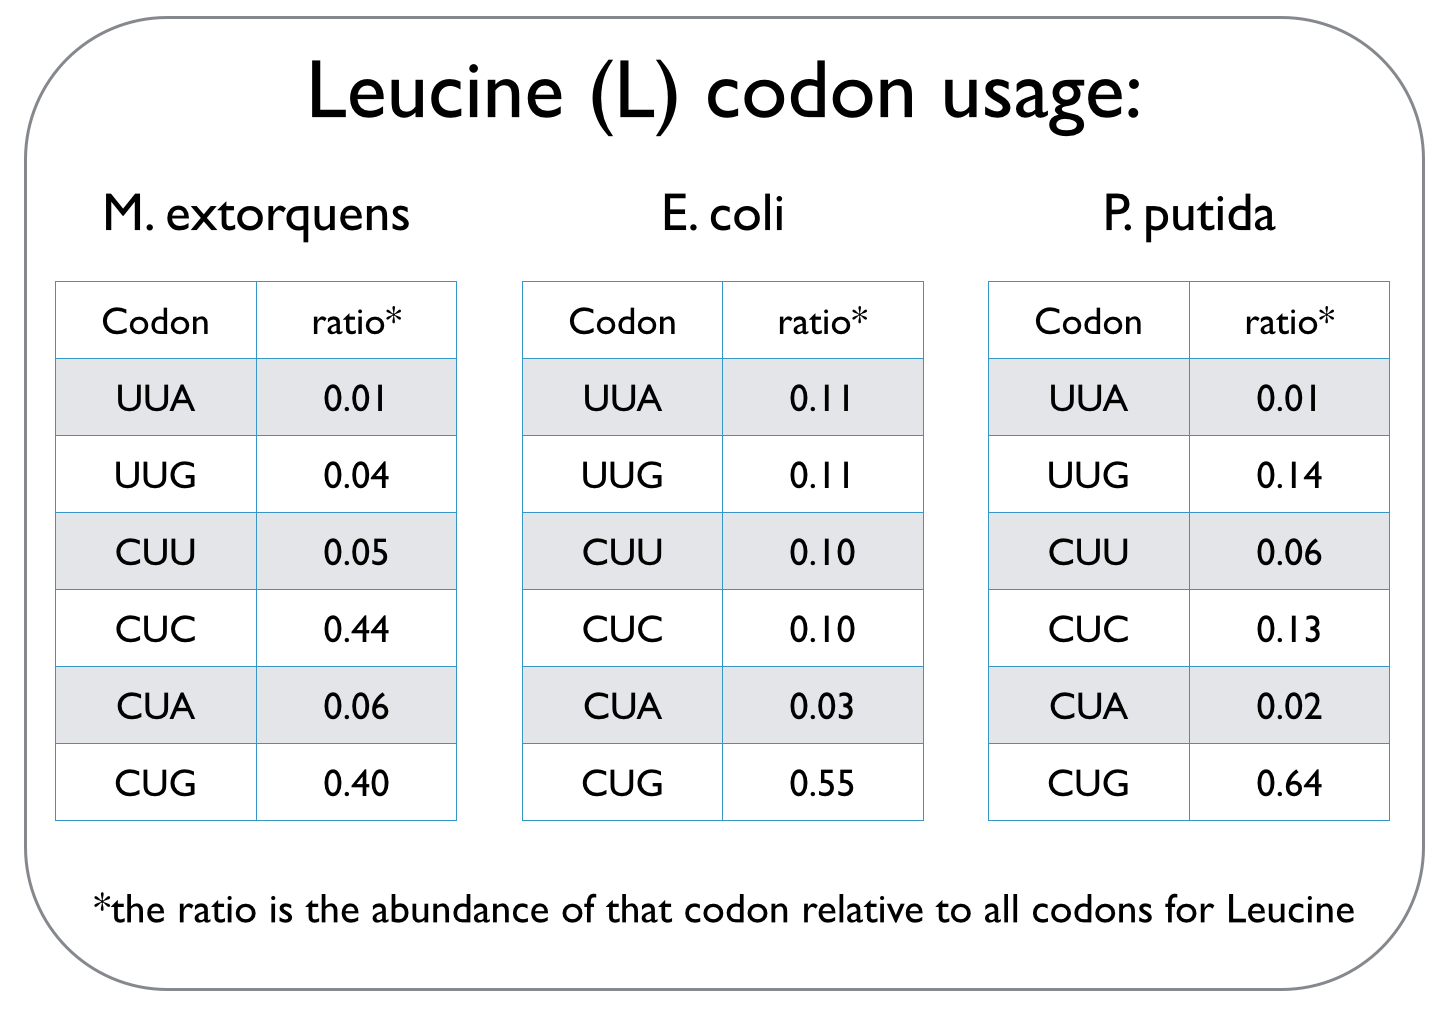
Cells use codons, which are composed of three consecutive nucleotides, to read the genetic code and translate it into proteins. This genetic code can not only vary between species, but it is also degenerate, meaning that several codons may specify a particular amino acid. Different species have unique codon usage biases, implying that they prefer particular codons over other codons that define the same amino acid. An excerpt of a codon usage frequency table is given for the three strains we worked with to highlight different codon biases.

Since we are expressing the dcmA enzyme from M. extorquens in E. coli and P. putida, we used an online tool to optimise the sequence of dcmA so that it can be translated by our host strains. To ensure that dcmA is not over-produced and therefore a strain on the metabolic capacity of the cell, codon usage was only optimised to ~70%.

Since we are expressing the dcmA enzyme from M. extorquens in E. coli and P. putida, we used an online tool to optimise the sequence of dcmA so that it can be translated by our host strains. To ensure that dcmA is not over-produced and therefore a strain on the metabolic capacity of the cell, codon usage was only optimised to ~70%.

Using the pRSFDuet vector and codon-optimised dcmA as the insert, we expressed dcmA fused to sfGFP in E.coli. The fused protein has a total molecular weight of 61.84 kDa. We managed to show this using western blots as indicated in part A of the figure below:

As shown in this figure, we have induced expression of dcmA-sfGFP with 0, 0.1 and 1 mM concentrations of IPTG (the inserts in pRSFDuet are under lac-control). Part B of this figure indicates OD and fluorescence readings of the three samples, showing how sfGPF (and thus expression levels of dcmA) increase at higher IPTG concentrations.

As shown in this figure, we have induced expression of dcmA-sfGFP with 0, 0.1 and 1 mM concentrations of IPTG (the inserts in pRSFDuet are under lac-control). Part B of this figure indicates OD and fluorescence readings of the three samples, showing how sfGPF (and thus expression levels of dcmA) increase at higher IPTG concentrations.


Retrieved from "http://2014.igem.org/Team:Oxford/codon_optimisation"
 "
"


