 "
"
Team:Glasgow/Modeling
From 2014.igem.org
 |
 |
|
 |

|
Firstly, we created a very basic 2D model of a flagella propelled bacterium. This was heavily based on the “random walk” model we mentioned previously, only we introduced a small degree of order, based on a more extensive and all-encompassing model created by Dillon, Fauci and Gaver in 1995.(link to paper?)DOI: 10.1006/jtbi.1995.0251
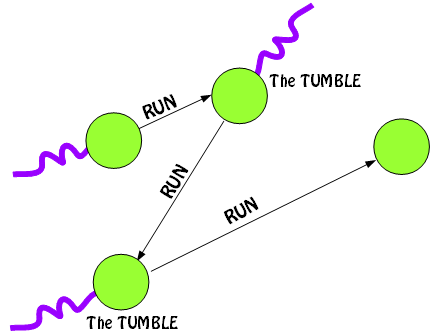
Figure 1: Basic Run and Tumble
- Tumbling is instantaneous
- Chemotaxic gradient is not a factor
- An E.coil cell can be represented as a sphere
- Speed is constant (20ms-1)
The movement of a bacteria through a medium is described thus:
1. The bacteria is moving at a random angle at a certain speed.
2. After a certain time (the “run” time), the bacteria reorientates itself (the “tumble”),
and sets off at a different angle. This run time can be influenced by the chemotaxic gradient,
if present.
The images below describe how the run times are influenced: if the bacteria is on a path towards the "food", it is unlikely to change direction.
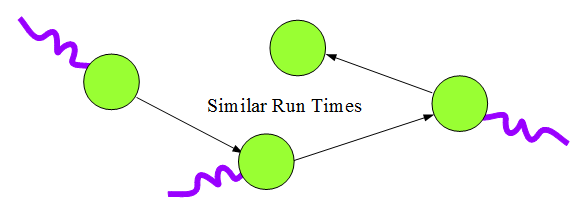
Figure 2: Bacterial movement with no chemotaxic gradient
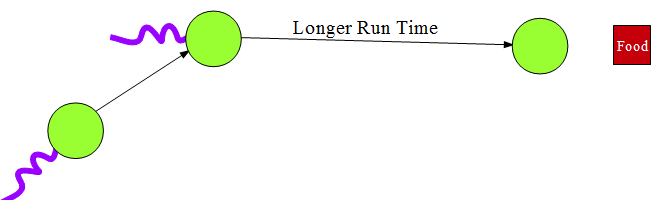
Figure 3:Alteration of bacterial random walk with chemotaxic gradient present
Based on the previous research, we decided that the tumble angle would be picked each time from a normal distribution, having a mean of 68 degrees and a standard deviation of 36. This angle would be either added or subtracted from the previous position. The speed was set at a constant 20us-1 (chemotaxis was not a factor). Given angle, speed, and time, new x and y coordinates are calculated, and a line plotted to show the path. This process could be repeated for any number of steps to show the theoretical path of a bacterium.
Figure 5: Giff displaying path of 10 bacteria
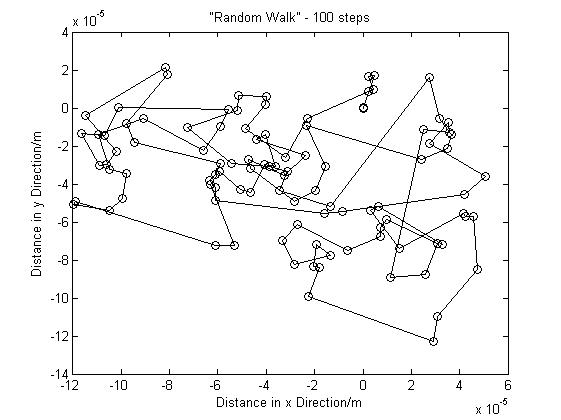
Figure 4: a 100 step Random Walk Simulation
This is the result of a MATLAB simulation using the angle and run time distributions stated above. Of course, every run was entirely random. The gif shows the path of 10 different bacterium, and how they move out from a central point. Each makes 300 steps. Roughly, the gif is 10x faster than normal movement (assuming the mean run time is 1 second).
The simulation we'd created did, of course, have a significant element of randomness. Below is an example of a run that provided us with a random (but strangely familiar) bacterial path.
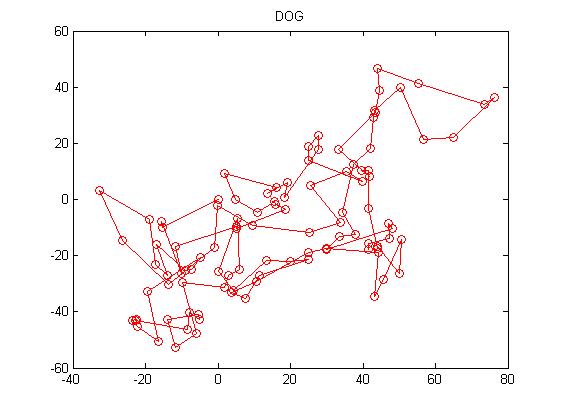
Figure 6: "Random Dog"
Having obtained a reasonable working model of a bacteria's natural movement, we could now investigate the effect of the buoyancy provided by the gas vesicles we'd be introducing. With this information, we could make informed decisions about the direction of the project.
| Intro | Bacterial Buoyancy |