 "
"
Team:Freiburg/Content/Results/Receptor
From 2014.igem.org
| (18 intermediate revisions not shown) | |||
| Line 6: | Line 6: | ||
<body> | <body> | ||
<section id="Receptor"> | <section id="Receptor"> | ||
| + | <div class="row category-row"> | ||
| + | <div class="col-sm-6"> | ||
| + | <div class="container-fluid" style="float: left"> | ||
| + | <div style="position: relative; float: right; margin-top: 4px;"> | ||
| + | <a href="https://2014.igem.org/Team:Freiburg/Results/Vector">Go back to The Vector</div> | ||
| + | <div style="position: relative; float: left;"> <img class="img-no-border" style="max-width: 50px; margin-top:5px;" src=" https://static.igem.org/mediawiki/2014/4/44/Freiburg2014_Navigation_Arrow_rv.png"> <!-- Pfeil rv--></a></div> | ||
| + | </div> | ||
| + | </div> | ||
| + | <div class="col-sm-6"> | ||
| + | <div class="container-fluid" style="float: right"> | ||
| + | <div style="position: relative; float: left; margin-top: 4px;"> | ||
| + | <a href="https://2014.igem.org/Team:Freiburg/Results/Light_system">See the Results of our Ligth Systems</div> | ||
| + | <div style="position: relative; float: right;"> <img class="img-no-border" style="max-width: 50px; margin-top:5px;" src=" https://static.igem.org/mediawiki/2014/9/95/Freibur2014_pfeilrechts.png"> <!-- Pfeil fw--></a></div> | ||
| + | </div> | ||
| + | </div> | ||
| + | </div> | ||
<h1>The Receptor</h1> | <h1>The Receptor</h1> | ||
| Line 40: | Line 56: | ||
<figcaption> | <figcaption> | ||
<p class="header"> | <p class="header"> | ||
| - | Figure 1: Overview image of | + | Figure 1: Overview image of HEK-293T cells transfected with mCAT-1-mCherry (p14rz_005). |
</p> | </p> | ||
<p class="desc"> | <p class="desc"> | ||
Confocal pictures were taken with a 20x plan apo objective. Nuclear staining (DAPI) is | Confocal pictures were taken with a 20x plan apo objective. Nuclear staining (DAPI) is | ||
| - | shown in blue and the mCAT-1-mCherry in red. | + | shown in blue and the mCAT-1-mCherry in red.<a href="https://2014.igem.org/Team:Freiburg/Notebook/Labjournal#MirjaHarms_Localization">Labjournal</a></p> |
</p> | </p> | ||
</figcaption> | </figcaption> | ||
| Line 56: | Line 72: | ||
<figcaption> | <figcaption> | ||
<p class="header"> | <p class="header"> | ||
| - | Figure 2: | + | Figure 2: HEK-293T cells transfected with mCAT-1-mCherry (p14rz_005). |
</p> | </p> | ||
<p class="desc"> | <p class="desc"> | ||
| Line 67: | Line 83: | ||
</div> | </div> | ||
| - | <h2 id="Results-Receptor-ReceptorFunctionality">Receptor Functionality</h2> | + | <h2 id="Results-Receptor-ReceptorFunctionality">Receptor Functionality and Virus Specificity</h2> |
| + | |||
| + | <p> | ||
| + | Transduction of genes into murine cell lines that naturally express the mCAT-1 | ||
| + | receptor occurred with an efficiency of over 80%. For our system we needed functional | ||
| + | expression of the receptor in non-murine cell lines, i.e. the receptor has to serve | ||
| + | as an entry site for the virus, and the virus has to efficiently deliver its cargo | ||
| + | into the target cell. We tested the functionality of the mCAT-1 receptor by expressing | ||
| + | it in HEK-293T cells and subsequent infection with the virus containing EGFP as a cargo. | ||
| + | The presence of green fluorescent cells in the infected cultures of different non-murine | ||
| + | cell lines indicated that the receptor was not only expressed but can also be used | ||
| + | as an entry site by the virus. | ||
| + | </p> | ||
| + | |||
| + | <p> | ||
| + | During our project we generated receptor constructs which were labeled with fluorescent | ||
| + | protein (for microscopy) or the HA tag (for Western blotting). Since we didn't know | ||
| + | whether the tags have an impact on viral infection capabilities, we tested them for | ||
| + | their functionality, confirming that all receptor constructs lead to viral infection | ||
| + | when expressed in non-murine cell lines (Fig. 3). For making the receptor visible for | ||
| + | fluorescent microscopy and analysis by flow cytometry, we used the mCherry tag | ||
| + | (constructs p14rz_005 and p14rz_006). | ||
| + | </p> | ||
| + | |||
| + | <figure class="fig-full-width"> | ||
| + | <a href="https://static.igem.org/mediawiki/2014/9/9d/Freiburg2014_Results_HEK_verschiedene_receptoren.jpg"> | ||
| + | <img class="img-no-pad" | ||
| + | src="https://static.igem.org/mediawiki/2014/9/9d/Freiburg2014_Results_HEK_verschiedene_receptoren.jpg"> | ||
| + | </a> | ||
| + | <figcaption> | ||
| + | <p class="header"> | ||
| + | Figure 3: HEK-293T cells transfected with different receptor constructs | ||
| + | and infected with MuLV-EGFP afterwards. | ||
| + | </p> | ||
| + | <p class="desc"> | ||
| + | Cells transfected with (A) mCAT-1, (B) mCAT-1-HA and (C) mCAT-1-HA-mCherry (red). | ||
| + | Cells were transduced with MuLV-EGFP after 24 h. Pictures were taken after 48 h. | ||
| + | EGFP fluorescence is shown in green. <a href="https://2014.igem.org/Team:Freiburg/Notebook/Labjournal#MirjaHarms_differnt_kinds_of_receptors">Labjournal</a> | ||
| + | </p> | ||
| + | </figcaption> | ||
| + | </figure> | ||
| + | |||
<div class="row category-row"> | <div class="row category-row"> | ||
<div class="col-sm-6"> | <div class="col-sm-6"> | ||
<p> | <p> | ||
| - | + | Owing to the limited resolution and sensitivity of the cell culture microscope used | |
| - | + | for the images in Fig. 3, it was not clear whether the cells expressing the receptor | |
| - | + | were the same cells that were transduced by the virus and expressed EGFP (Fig. 3C). | |
| - | + | Therefore we obtained higher qualtiy images with a confocal microscope (Fig. 4). The | |
| - | + | cells were transfected with the mCAT-1-mCherry construct, 24h later infected by | |
| - | + | the virus containing EGFP, and imaged 48h later. We found many cells that expressed | |
| - | + | EGFP in the cytoplasm and the mCAT-1 receptor on the plasma membrane, whereas we did not | |
| - | + | find cells that expressed EGFP but not the receptor, suggesting that | |
| - | + | mCAT-1 expression is required for infection of the cells by the MuLV. | |
</p> | </p> | ||
<p> | <p> | ||
| - | + | We also noticed that mCAT-1-mCherry was less present after transduction with | |
| - | + | the viral particles. Possible explanations are that the receptor is internalized | |
| - | + | after infection by a mechanism initiated by the virus, or that the expression | |
| - | + | rate of the receptor decreases after infection. Since the particles can only | |
| - | + | transfer their cargo into dividing cells, we often found pairs of cells that were | |
| - | + | infected by the viral vector or observed high expression of the receptor in | |
| - | + | cells next to targeted cells. | |
| - | + | ||
| - | + | ||
| - | + | ||
</p> | </p> | ||
| + | <p> | ||
| + | We were wondering whether receptor expression is indeed required for virus entry into the cell. | ||
| + | Although we observed by confocal microscopy that many cells that expressed EGFP | ||
| + | also expressed the receptor, we set out to correlate the expression levels of receptor and | ||
| + | EGFP, i.e. the cargo of the virus. Therefore we used FACS analysis to quantify | ||
| + | the levels of mCherry and EGFP fluorescence in all cells (Fig. 5). Although many cells that expressed | ||
| + | the receptor were not transduced with EGFP, we found that all cells that expressed EGFP | ||
| + | also expressed the receptor (Fig. 5, top right quadrant). Only a negligible number | ||
| + | of cells showed EGFP expression but low mCherry fluorescence (Fig. 5, top left quadrant). | ||
| + | This requirement for the presence of the receptor to allow efficient virus entry indicated | ||
| + | that the MuLV is indeed highly specific for the mCAT-1 receptor. | ||
| + | </p> | ||
| + | <video src="https://static.igem.org/mediawiki/2014/6/6b/Freiburg2014_confocal_HEK293T_mCAT1.mp4" type="video/mp4" width="480" height="360" autobuffer autoplay loop> | ||
| + | </video> | ||
</div> | </div> | ||
<div class="col-sm-6"> | <div class="col-sm-6"> | ||
| + | <figure> | ||
| + | <a href="https://static.igem.org/mediawiki/2014/b/b0/Freiburg2014_Receptor_08_plus_Virus_single_channels.png"> | ||
| + | <img class="img-no-pad" | ||
| + | src="https://static.igem.org/mediawiki/2014/b/b0/Freiburg2014_Receptor_08_plus_Virus_single_channels.png"> | ||
| + | </a> | ||
| + | <figcaption> | ||
| + | <p class="header"> | ||
| + | Figure 4: HEK-293T cells expressing mCAT-1-mCherry transduced with MuLV-GFP. | ||
| + | </p> | ||
| + | <p class="desc"> | ||
| + | (A) Overlay of all three channels, (B) DAPI, (C) EGFP and (D) mCAT-1-mCherry. | ||
| + | Objective plan apo 60x, NA 1.40. <a href="https://2014.igem.org/Team:Freiburg/Notebook/Labjournal#MirjaHarms_Localization_receptor_Virus">Labjournal</a> | ||
| + | </p> | ||
| + | </figcaption> | ||
| + | </figure> | ||
| + | |||
<figure> | <figure> | ||
<a href="https://static.igem.org/mediawiki/2014/2/25/Freiburg2014_Results_HEK_prz006_mulv_together.jpg"> | <a href="https://static.igem.org/mediawiki/2014/2/25/Freiburg2014_Results_HEK_prz006_mulv_together.jpg"> | ||
| Line 102: | Line 186: | ||
<figcaption> | <figcaption> | ||
<p class="header"> | <p class="header"> | ||
| - | Figure | + | Figure 5: FACS data of HEK-293T cells tranfected with the receptor and |
| - | + | infected with MuLV-EGFP. | |
</p> | </p> | ||
<p class="desc"> | <p class="desc"> | ||
| - | HEK-293T cells were transfected with the | + | HEK-293T cells were transfected with the mCAT-1-mCherry and infected with MuLV-EGFP. |
| - | + | Cells were analyzed by flow cytometry 48 h after infection. <a href="https://2014.igem.org/Team:Freiburg/Notebook/Labjournal#MirjaHarms_differnt_kinds_of_receptors">Labjournal</a> | |
| - | + | ||
</p> | </p> | ||
</figcaption> | </figcaption> | ||
| Line 114: | Line 197: | ||
</div> | </div> | ||
</div> | </div> | ||
| - | |||
| - | |||
| - | |||
| - | |||
| - | |||
| - | |||
| - | |||
| - | |||
| - | |||
| - | |||
| - | |||
| - | |||
| - | |||
| - | |||
| - | |||
| - | |||
| - | |||
| - | |||
| - | |||
| - | |||
| - | |||
| - | |||
| - | |||
| - | |||
| - | + | ||
| - | + | ||
| - | + | <h2 id="Results-Receptor-ReceptorExpression">Receptor Expression</h2> | |
| - | + | ||
| - | + | ||
| - | + | ||
| - | + | ||
| - | + | ||
| - | + | <p> | |
| + | To enable efficient infection of cells with the virus, the time point for viral infection should match the time the receptor needs for expression in target cells. In order to determine the expression time of mCAT-1 in HEK-293T cells, we transfected the cells with the HA-tagged mCAT-1. Cells transfected with receptor DNA were analyzed after different incubation times. We found that the expression of the receptor peaked at 24 h after transfection (Fig. 6). In later experiments we used this time point for viral infections. | ||
| + | </p> | ||
| + | <p> | ||
| + | Since the presence of mCAT-1 on the cell surface is a main factor for viral tranduction efficiency, we quantified the expression of the receptor after transfection of HEK-293T cells with different concentrations of receptor DNA by Western blotting. We found that the expression of the receptor in the cell increases with higher amounts of transfected DNA (Fig. 7). However, we did not use such high DNA concentrations for our later experiments because we found that non-murine cells transfected with high amounts of transfected DNA died, probably due to overexpression of the mCAT-1 receptor. | ||
| + | </p> | ||
| - | + | <div class="row category-row"> | |
| - | + | <div class="col-sm-6"> | |
| - | + | <figure> | |
| - | + | <img src="https://static.igem.org/mediawiki/2014/5/5b/Freiburg2014_Results_WB_receptorexpressiontime.jpg"> | |
| - | + | <figcaption> | |
| - | + | <p class="header"> | |
| - | + | Figure 6: Expression time of the receptor that was transfected into HEK-293T cells. | |
| - | + | </p> | |
| - | + | <p class="desc"> | |
| - | + | After transfection with mCAT-1-HA cells were lysed with RIPA buffer | |
| - | + | at distinct time points. A Western blot was performed using an anti-HA antibody. <a href="https://2014.igem.org/Team:Freiburg/Notebook/Labjournal#MirjaHarms_Expression_time_receptor">Labjournal</a> | |
| - | + | </p> | |
| - | + | </figcaption> | |
| - | + | </figure> | |
| - | + | </div> | |
| - | + | <div class="col-sm-6"> | |
| - | + | <figure> | |
| - | + | <img src="https://static.igem.org/mediawiki/2014/c/cc/Freiburg2014_Results_WB_receptorexpression_DNA_conc.jpg"> | |
| - | + | <figcaption> | |
| - | + | <p class="header"> | |
| - | + | Figure 7: Tranfection of HEK-293T cells with different receptor DNA concentrations. | |
| - | + | </p> | |
| - | + | <p class="desc"> | |
| - | + | Cells (on 35mm plates) were transfected with 0.6 µg to 5.4 µg plasmid p14rz_006 coding | |
| + | for mCAT-1-HA per well. Cells were lysed with RIPA buffer after 24 h of incubation and analyzed | ||
| + | by Western blotting. <a href="https://2014.igem.org/Team:Freiburg/Notebook/Labjournal#MirjaHarms_Expression_time_receptor">Labjournal</a> | ||
| + | </p> | ||
| + | </figcaption> | ||
| + | </figure> | ||
| + | </div> | ||
| + | </div> | ||
</section> | </section> | ||
| + | <div class="row category-row"> | ||
| + | <div class="col-sm-6"> | ||
| + | <div class="container-fluid" style="float: left"> | ||
| + | <div style="position: relative; float: right; margin-top: 4px;"> | ||
| + | <a href="https://2014.igem.org/Team:Freiburg/Results/Vector">Go back to The Vector</div> | ||
| + | <div style="position: relative; float: left;"> <img class="img-no-border" style="max-width: 50px; margin-top:5px;" src=" https://static.igem.org/mediawiki/2014/4/44/Freiburg2014_Navigation_Arrow_rv.png"> <!-- Pfeil rv--></a></div> | ||
| + | </div> | ||
| + | </div> | ||
| + | <div class="col-sm-6"> | ||
| + | <div class="container-fluid" style="float: right"> | ||
| + | <div style="position: relative; float: left; margin-top: 4px;"> | ||
| + | <a href="https://2014.igem.org/Team:Freiburg/Results/Light_system">See the Results of our Ligth Systems</div> | ||
| + | <div style="position: relative; float: right;"> <img class="img-no-border" style="max-width: 50px; margin-top:5px;" src=" https://static.igem.org/mediawiki/2014/9/95/Freibur2014_pfeilrechts.png"> <!-- Pfeil fw--></a></div> | ||
| + | </div> | ||
| + | </div> | ||
| + | </div> | ||
Latest revision as of 03:19, 18 October 2014

The Receptor
The specificity of our system is based on the murine CAT-1 receptor, which serves as the viral entry site of our viral vector into the target cells. We demonstrate that the virus can be used to stably integrate genes into the genome of murine cells. We also targeted other cell lines by expressing the gene for the murine CAT-1 receptor in these cells before viral transduction. Since mCAT-1 is naturally only present in murine cell lines, we use human cell lines for transfection of the receptor. Expression of a reporter suggests that only the cells expressing the mCAT-1 receptor are being infected by the viral particles, thus making particular gene transfer possible.
Subcellular Localization of the Receptor
Since the mCAT-1 receptor serves as the entry site of our viral vector, it is essential that it is expressed on the surface of target cells. In order to determine the localization of the mCAT-1 receptor, we labeled the C-terminus of the mCAT-1 with the fluorescent protein mCherry and transfected it into human embryonic kidney (HEK-293T) cells. After distinct time points cells were imaged with a confocal scanning laser microscope. The mCAT1-mCherry construct was found predominantly at the surface of the cells (Figs. 1, 2).
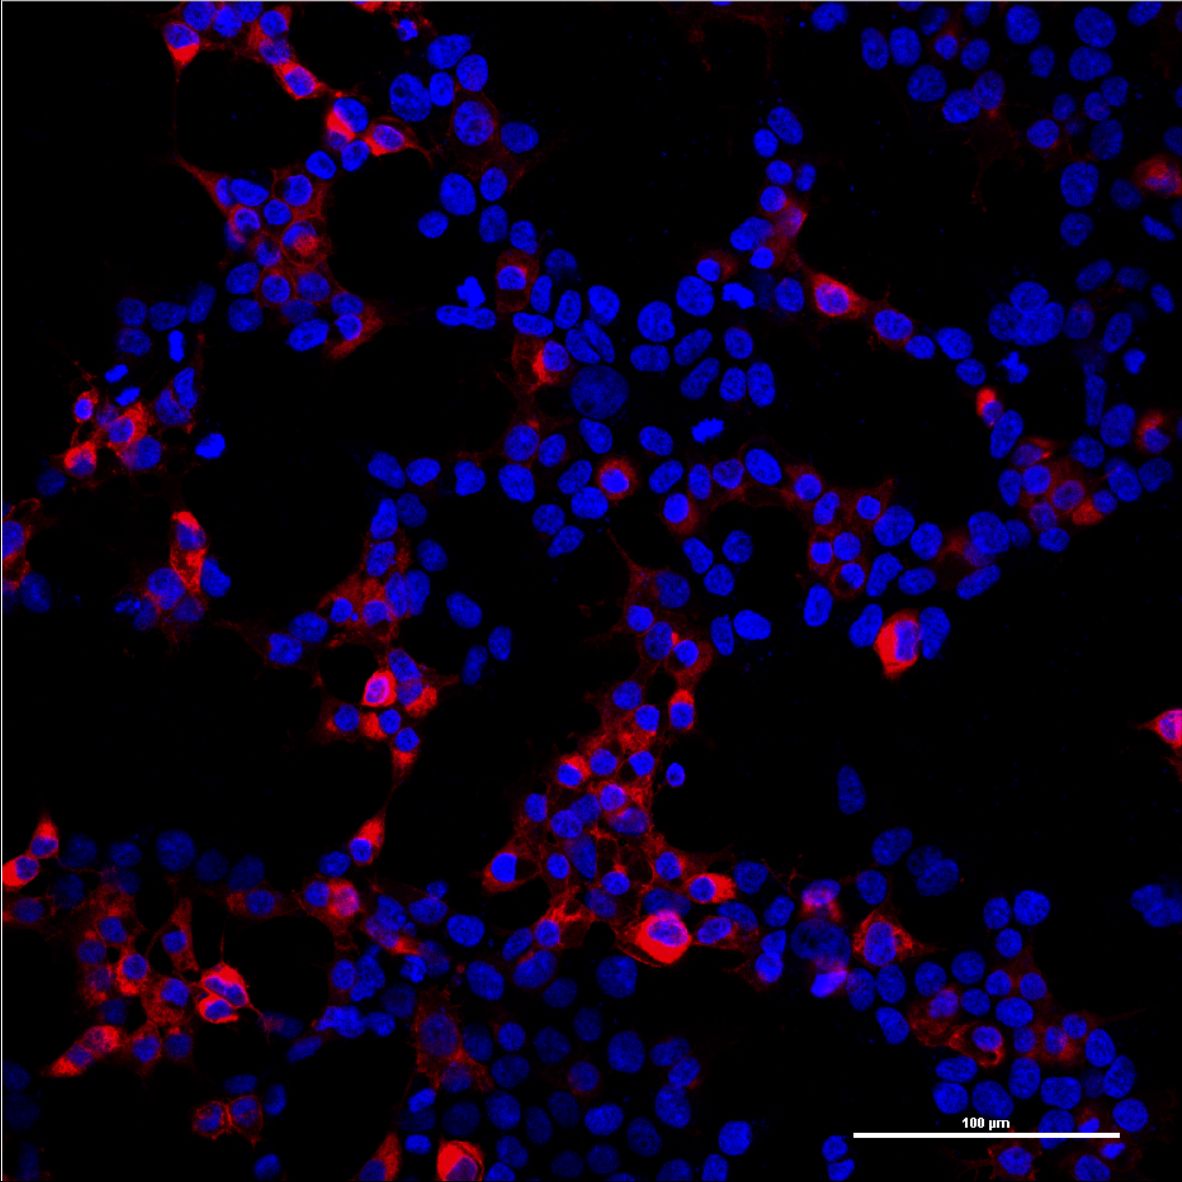
Figure 1: Overview image of HEK-293T cells transfected with mCAT-1-mCherry (p14rz_005).
Confocal pictures were taken with a 20x plan apo objective. Nuclear staining (DAPI) is shown in blue and the mCAT-1-mCherry in red.Labjournal

Figure 2: HEK-293T cells transfected with mCAT-1-mCherry (p14rz_005).
Confocal pictures were taken with an 100x oil immersion objective (NA 1.40). Nuclear staining (DAPI) is shown in blue and the mCAT-1-mCherry in red.
Receptor Functionality and Virus Specificity
Transduction of genes into murine cell lines that naturally express the mCAT-1 receptor occurred with an efficiency of over 80%. For our system we needed functional expression of the receptor in non-murine cell lines, i.e. the receptor has to serve as an entry site for the virus, and the virus has to efficiently deliver its cargo into the target cell. We tested the functionality of the mCAT-1 receptor by expressing it in HEK-293T cells and subsequent infection with the virus containing EGFP as a cargo. The presence of green fluorescent cells in the infected cultures of different non-murine cell lines indicated that the receptor was not only expressed but can also be used as an entry site by the virus.
During our project we generated receptor constructs which were labeled with fluorescent protein (for microscopy) or the HA tag (for Western blotting). Since we didn't know whether the tags have an impact on viral infection capabilities, we tested them for their functionality, confirming that all receptor constructs lead to viral infection when expressed in non-murine cell lines (Fig. 3). For making the receptor visible for fluorescent microscopy and analysis by flow cytometry, we used the mCherry tag (constructs p14rz_005 and p14rz_006).

Figure 3: HEK-293T cells transfected with different receptor constructs and infected with MuLV-EGFP afterwards.
Cells transfected with (A) mCAT-1, (B) mCAT-1-HA and (C) mCAT-1-HA-mCherry (red). Cells were transduced with MuLV-EGFP after 24 h. Pictures were taken after 48 h. EGFP fluorescence is shown in green. Labjournal
Owing to the limited resolution and sensitivity of the cell culture microscope used for the images in Fig. 3, it was not clear whether the cells expressing the receptor were the same cells that were transduced by the virus and expressed EGFP (Fig. 3C). Therefore we obtained higher qualtiy images with a confocal microscope (Fig. 4). The cells were transfected with the mCAT-1-mCherry construct, 24h later infected by the virus containing EGFP, and imaged 48h later. We found many cells that expressed EGFP in the cytoplasm and the mCAT-1 receptor on the plasma membrane, whereas we did not find cells that expressed EGFP but not the receptor, suggesting that mCAT-1 expression is required for infection of the cells by the MuLV.
We also noticed that mCAT-1-mCherry was less present after transduction with the viral particles. Possible explanations are that the receptor is internalized after infection by a mechanism initiated by the virus, or that the expression rate of the receptor decreases after infection. Since the particles can only transfer their cargo into dividing cells, we often found pairs of cells that were infected by the viral vector or observed high expression of the receptor in cells next to targeted cells.
We were wondering whether receptor expression is indeed required for virus entry into the cell. Although we observed by confocal microscopy that many cells that expressed EGFP also expressed the receptor, we set out to correlate the expression levels of receptor and EGFP, i.e. the cargo of the virus. Therefore we used FACS analysis to quantify the levels of mCherry and EGFP fluorescence in all cells (Fig. 5). Although many cells that expressed the receptor were not transduced with EGFP, we found that all cells that expressed EGFP also expressed the receptor (Fig. 5, top right quadrant). Only a negligible number of cells showed EGFP expression but low mCherry fluorescence (Fig. 5, top left quadrant). This requirement for the presence of the receptor to allow efficient virus entry indicated that the MuLV is indeed highly specific for the mCAT-1 receptor.

Figure 4: HEK-293T cells expressing mCAT-1-mCherry transduced with MuLV-GFP.
(A) Overlay of all three channels, (B) DAPI, (C) EGFP and (D) mCAT-1-mCherry. Objective plan apo 60x, NA 1.40. Labjournal
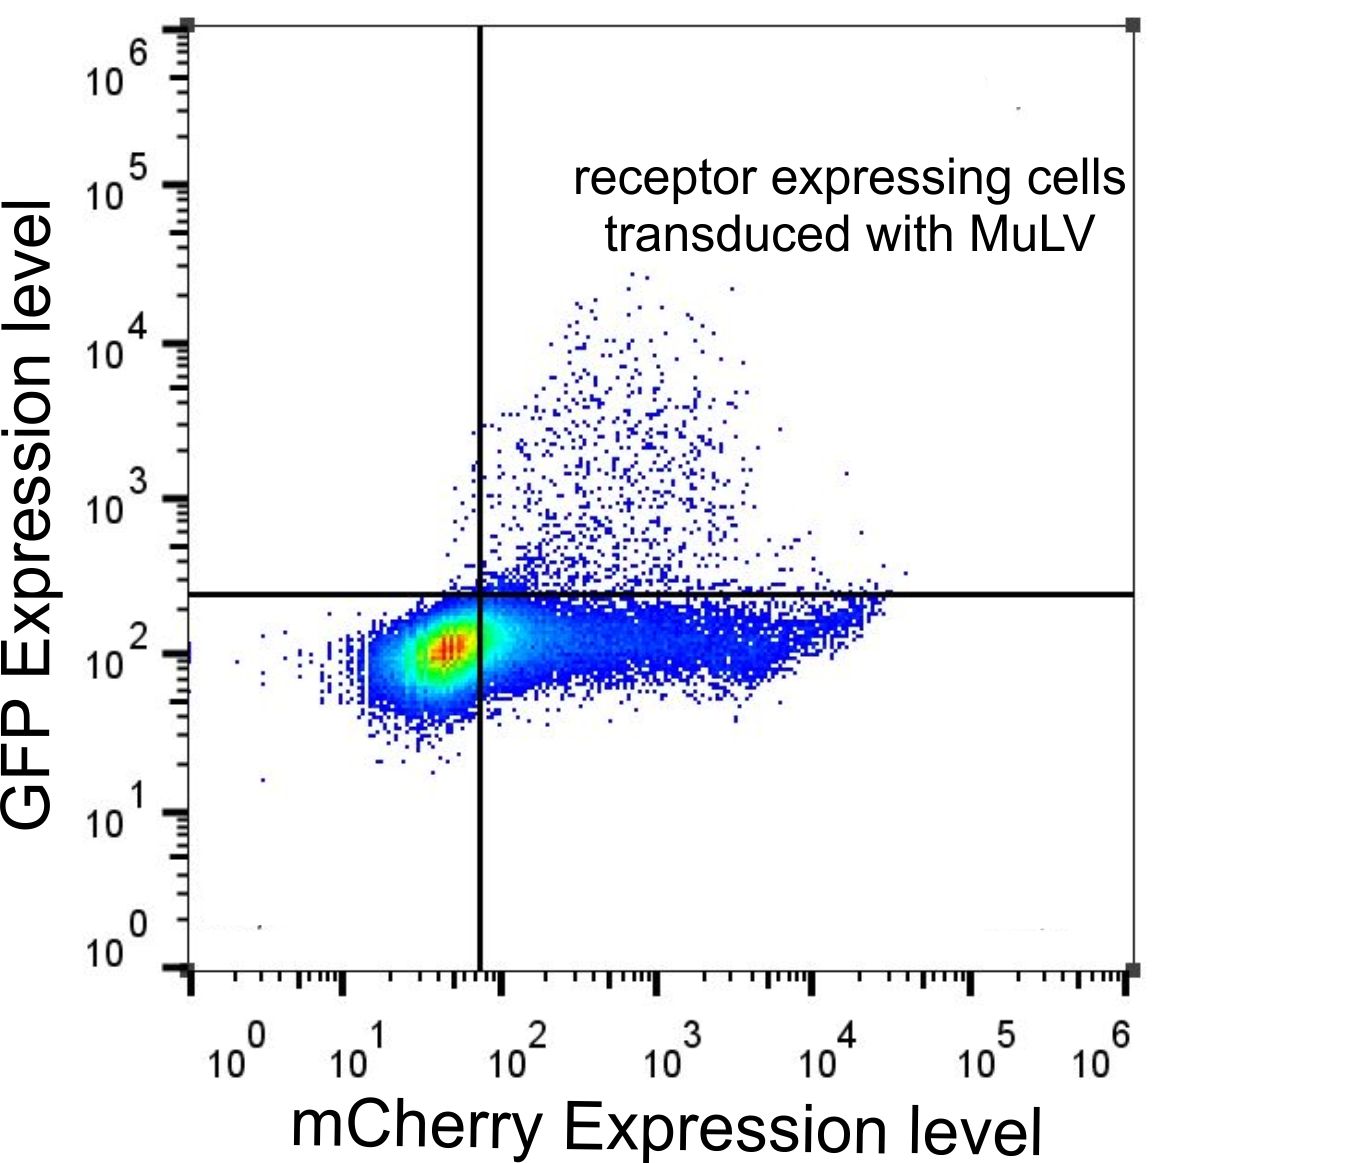
Figure 5: FACS data of HEK-293T cells tranfected with the receptor and infected with MuLV-EGFP.
HEK-293T cells were transfected with the mCAT-1-mCherry and infected with MuLV-EGFP. Cells were analyzed by flow cytometry 48 h after infection. Labjournal
Receptor Expression
To enable efficient infection of cells with the virus, the time point for viral infection should match the time the receptor needs for expression in target cells. In order to determine the expression time of mCAT-1 in HEK-293T cells, we transfected the cells with the HA-tagged mCAT-1. Cells transfected with receptor DNA were analyzed after different incubation times. We found that the expression of the receptor peaked at 24 h after transfection (Fig. 6). In later experiments we used this time point for viral infections.
Since the presence of mCAT-1 on the cell surface is a main factor for viral tranduction efficiency, we quantified the expression of the receptor after transfection of HEK-293T cells with different concentrations of receptor DNA by Western blotting. We found that the expression of the receptor in the cell increases with higher amounts of transfected DNA (Fig. 7). However, we did not use such high DNA concentrations for our later experiments because we found that non-murine cells transfected with high amounts of transfected DNA died, probably due to overexpression of the mCAT-1 receptor.

Figure 6: Expression time of the receptor that was transfected into HEK-293T cells.
After transfection with mCAT-1-HA cells were lysed with RIPA buffer at distinct time points. A Western blot was performed using an anti-HA antibody. Labjournal

Figure 7: Tranfection of HEK-293T cells with different receptor DNA concentrations.
Cells (on 35mm plates) were transfected with 0.6 µg to 5.4 µg plasmid p14rz_006 coding for mCAT-1-HA per well. Cells were lysed with RIPA buffer after 24 h of incubation and analyzed by Western blotting. Labjournal