Team:CU-Boulder/Notebook/Measurement
From 2014.igem.org
Interlab Measurement Study
Study Description
Different iGEM teams from around the world were offered the opportunity to participate in this study to obtain fluorescent measurements from three separate devices. Each device consisted of a specific plasmid that was to be expressed in bacterial cells. The parts for each device were provided to each team from the iGEM registry.
The first plasmid was already assembled and provided to teams with highly expressive constitutive promoter for the GFP in a low-copy plasmid, pSB3K3. The other two plasmids contained the same GFP gene, but were assembled onto the pSB1C3 plasmid. The first of these held the same constitutive promoter (J23101) as the first device. The third device contained a constitutively low-expressive promoter (J23115) to drive GFP expression (Table 1).
| Device | Constitutive Promoter | Plasmid |
|---|---|---|
| Device 1 | J23101 (High Expression) | pSB3K3 (Low-Copy) |
| Device 2 | J23101 (High Expression) | pSB3C1 |
| Device 3 | J23115 (Low Expression) | pSB3C1 |
Table 1: Overview of the three devices constructed for this study.
Device 1 plasmids were transformed into competent E. coli DH5? cells and plated under antibiotic selection for cells that had taken up the plasmid. Device 2 and device 3 were assembled using restriction digestion followed by ligation. To begin, the plasmid containing the GFP gene (E0240) was digested with XbaI and PstI. The plasmids with promoters were each digested with SpeI and PstI, resulting in a location to which the GFP fragment could be inserted. These products were ligated together and transformed into competent E. coli DH5? cells and plated under antibiotic selection. Colonies were taken for overnight cultures, and DNA from these cultures was isolated for analysis.
Biological triplicates were prepared as overnight cultures for all three devices and control samples. Fluorescence was measured from all samples in triplicate. First, samples were diluted as needed to obtain the same cell concentrations (by measuring OD) and then serial dilutions of samples were placed into a 96 well plate and measurements taken using a plate reader. Fluorescence values in RFU (relative fluorescent units) were compared and reported.
Results
As shown below (Data Table 1), for each of the devices, three biological replicates were measured (labeled #1, #2, and #3 for each device). Data shown includes actual measurements and derived quantities obtained by subtracting fluorescence measured from non-GFP expressing E. coli of the same strain on the same plate. Promoter J23115 for device #3 was used as distributed (containing mismatch). In addition, each sample underwent a serial dilution (concentrations listed as fractions across top of table).
| 1.00 | 0.67 | 0.44 | 0.3 | 0.2 | 13.4 | 0.09 | |
|---|---|---|---|---|---|---|---|
| Dev 1 #1 Actual | 1728 | 1450 | 1153 | 1024 | 899 | 881 | 838 |
| Calculated | 746 | 525 | 267 | 174 | 54 | 48 | 31 |
| Dev 1 #2 Actual | 1830 | 1413 | 1142 | 1010 | 921 | 841 | 861 |
| Calculated | 848 | 488 | 256 | 160 | 76 | 8 | 54 |
| Dev 1 #3 Actual | 1790 | 1446 | 1155 | 975 | 911 | 861 | 854 |
| Calculated | 808 | 521 | 269 | 125 | 66 | 28 | 47 |
| Dev 2 #1 Actual | 992 | 925 | 849 | 812 | 805 | 779 | 779 |
| Calculated | -76 | 22 | -5 | -9 | -2 | -15 | -9 |
| Dev 2 #2 Actual | 1083 | 924 | 820 | 813 | 791 | 776 | 761 |
| Calculated | 15 | 21 | -34 | -8 | -16 | -18 | -27 |
| Dev 2 #3 Actual | 1047 | 879 | 824 | 801 | 776 | 782 | 772 |
| Calculated | -21 | -24 | -30 | -20 | -31 | -12 | -16 |
| Dev 3 #1 Actual | 1142 | 995 | 895 | 831 | 804 | 809 | 798 |
| Calculated | 74 | 92 | 41 | 10 | -3 | 15 | 10 |
| Dev 3 #2 Actual | 1125 | 940 | 852 | 823 | 796 | 805 | 788 |
| Calculated | 57 | 37 | -2 | 2 | -11 | 11 | 0 |
| Dev 3 #3 Actual | 1035 | 951 | 888 | 837 | 824 | 812 | 797 |
| Calculated | -33 | 48 | 34 | 16 | 17 | 18 | 9 |
Data Table 1: Fluorescence data. For each of the devices, three biological replicates were measured (labeled #1, #2, and #3 for each device). Data shown includes actual measurements and derived quantities. Fractions across top of table represent sample concentration.
Conclusions
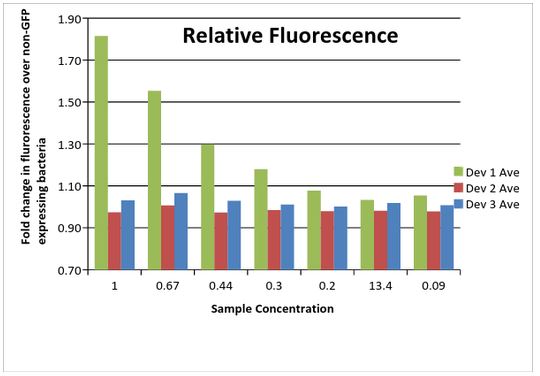
As shown below (Data Table 3), Device 1 showed a much higher amount of fluorescence compared to the other two devices. This is likely due to differences in the plasmid between the devices, with the low copy pSB3K3 performing much higher than the pSB1C3 plasmid. Device 2 and 3 were similar in fluorescence amounts. However, device 3 outperformed device 2, an unexpected result considering the promoter differences. It was later discovered that the J23115 promoter part used for device 3 contained two mismatched base pairs. Considering that the promoter sequence is only 35 bp in length, this could have a significant impact on expression of the GFP gene in this device.
Data Table 2: Fold change in fluorescence in samples compared to non-GFP expressing bacterial cells.
 "
"

