Team:Aachen/Project/2D Biosensor
From 2014.igem.org
AZimmermann (Talk | contribs) |
AZimmermann (Talk | contribs) |
||
| Line 103: | Line 103: | ||
<span class="anchor" id="biosensormolecularapproach"></span> | <span class="anchor" id="biosensormolecularapproach"></span> | ||
| - | For our biosensor, our team genetically modified ''E. coli'' cells to be able to elecit a '''fluorescent response to autoinducers''' produced by the pathogen ''Pseudomonas aeruginosa'' during quorum sensing. In the case of ''P. aeruginosa'', these autoinducers are N-3-oxo-dodecanoyl-L-homoserine lactone, or 3-oxo-C-12-HSL for short. The quorum sensing system of this pathogen contains the '''LasR activator''' which binds 3-oxo-C-12-HSL, and the '''LasI | + | For our biosensor, our team genetically modified ''E. coli'' cells to be able to elecit a '''fluorescent response to autoinducers''' produced by the pathogen ''Pseudomonas aeruginosa'' during quorum sensing. In the case of ''P. aeruginosa'', these autoinducers are N-3-oxo-dodecanoyl-L-homoserine lactone, or 3-oxo-C-12-HSL for short. The quorum sensing system of this pathogen contains the '''LasR activator''' which binds 3-oxo-C-12-HSL, and the '''LasI promoter''', which is activated by the LasR-HSL complex. Both LasR activator and LasI promoter are available as BioBricks [http://parts.igem.org/Part:BBa_C0179 C0179] and [http://parts.igem.org/Part:BBa_J64010 J64010]. |
| - | As a reporter gene, we use '''GFP'''. However, expression of GFP is not simply controlled through the LasI | + | As a reporter gene, we use '''GFP'''. However, expression of GFP is not simply controlled through the LasI promoter activity in our approach. Instead, our sensor cells contain genes for a constitutively expressed fusion protein consisting of GFP and a dark quencher, and an '''HSL-inducible protease'''. We use the REACh protein as dark quencher for GFP and the TEV protease to cleave the complex; [https://2014.igem.org/Team:Aachen/Project/FRET_Reporter here] you can read more about the REACh construct and the TEV protease. |
{{Team:Aachen/Figure|align=center|Aachen_REACh_approach.png|title=Our novel biosensor approach|subtitle=Expression of the TEV protease is induced by HSL. The protease cleaves the GFP-REACh fusion protein to elecit a fluorescence response.|width=500px}} | {{Team:Aachen/Figure|align=center|Aachen_REACh_approach.png|title=Our novel biosensor approach|subtitle=Expression of the TEV protease is induced by HSL. The protease cleaves the GFP-REACh fusion protein to elecit a fluorescence response.|width=500px}} | ||
| Line 164: | Line 164: | ||
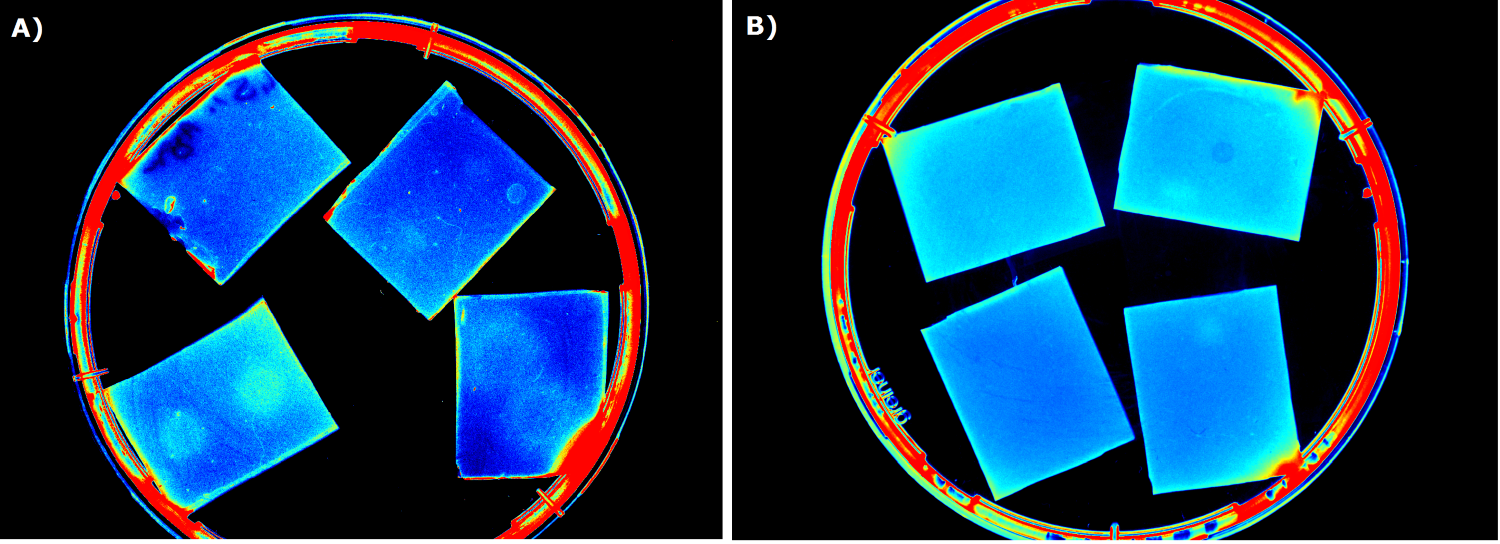
To establish a prove of principle for our sensor chip design we used our construct [http://parts.igem.org/Part:BBa_K1319042 K1319042], which incorporates an IPTG inducible iLOV. ''E. coli'' cells containing the latter construct were introduced into sensor chips and fluorescence was measured every 15 minutes subsequently to induction with 2 µl 100 mM IPTG (Testing K1319042 in our sensor chips, displayed on the left). | To establish a prove of principle for our sensor chip design we used our construct [http://parts.igem.org/Part:BBa_K1319042 K1319042], which incorporates an IPTG inducible iLOV. ''E. coli'' cells containing the latter construct were introduced into sensor chips and fluorescence was measured every 15 minutes subsequently to induction with 2 µl 100 mM IPTG (Testing K1319042 in our sensor chips, displayed on the left). | ||
| - | We observed a distinct difference in fluorescence between the non-induced chip (top) and the induced chip (bottom). The middle of the bottom chip started to exhibit a clear and visible fluorescence and the fluorescence increased over time and spread outward. The top chip, however, also showed increase in the measured fluorescence over time which was primarily due to a leaky | + | We observed a distinct difference in fluorescence between the non-induced chip (top) and the induced chip (bottom). The middle of the bottom chip started to exhibit a clear and visible fluorescence and the fluorescence increased over time and spread outward. The top chip, however, also showed increase in the measured fluorescence over time which was primarily due to a leaky promoter and background fluorescence. |
=== Detecting 3-oxo-C{{sub|12}} HSL with Sensor Chips === | === Detecting 3-oxo-C{{sub|12}} HSL with Sensor Chips === | ||
| Line 172: | Line 172: | ||
In an initially attempt to detect 3-oxo-C{{sub|12}}-HSL, we incorporated the [http://parts.igem.org/Part:BBa_K131026 K131026] construct generated by the 2008 iGEM Team Calgary in our sensor chips. The latter construct generates a fluorescent signal based on GFP in presence of 3-oxo-C{{sub|12}}-HSL molecules produced by ''P. aeruginosa'' during quorum sensing (Jimenez, Koch, Thompson et al., 2012). First, we tested the construct by direct induction of 3-oxo-C{{sub|12}}-HSL (0.2 µl, 500 µg/ml) whereby fluorescence measurement was taken every 15 minutes with an excitation wavelength of 496 nm and an emission wavelength of 516 nm (Testing K131026 in our sensor chips, displayed on the rigth). | In an initially attempt to detect 3-oxo-C{{sub|12}}-HSL, we incorporated the [http://parts.igem.org/Part:BBa_K131026 K131026] construct generated by the 2008 iGEM Team Calgary in our sensor chips. The latter construct generates a fluorescent signal based on GFP in presence of 3-oxo-C{{sub|12}}-HSL molecules produced by ''P. aeruginosa'' during quorum sensing (Jimenez, Koch, Thompson et al., 2012). First, we tested the construct by direct induction of 3-oxo-C{{sub|12}}-HSL (0.2 µl, 500 µg/ml) whereby fluorescence measurement was taken every 15 minutes with an excitation wavelength of 496 nm and an emission wavelength of 516 nm (Testing K131026 in our sensor chips, displayed on the rigth). | ||
A distinct fluorescence signal was observed on the induced chip (bottom) compared to the non-induced chip (top). | A distinct fluorescence signal was observed on the induced chip (bottom) compared to the non-induced chip (top). | ||
| - | Fluorescence started in the middle of the chip (point of induction) and then extended outwards, still showing an increasing fluorescence signal. The basal level of fluorescence was attributed to leakiness of the | + | Fluorescence started in the middle of the chip (point of induction) and then extended outwards, still showing an increasing fluorescence signal. The basal level of fluorescence was attributed to leakiness of the promoter and general background fluorescence of growing ''E. coli'' cells. In the induced chip (bottom), the background fluorescence was lower than in the non-induced chip (top), because the signal masked the noise. The difference between the induced and non-induced chips indicated a clear response to the HSL and proofed the ability of our 2D sensor chip design to detect HSLs produced by ''Pseudomonas aeruginosa''. |
=== Detecting IPTG with Sensor Chips === | === Detecting IPTG with Sensor Chips === | ||
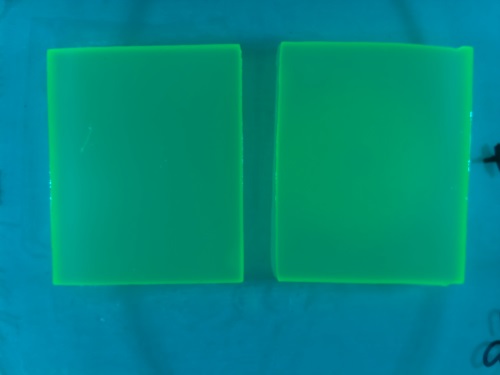
{{Team:Aachen/FigureFloat|Aachen_I746909_slower_reduced.gif|title=IPTG inducible superfolder GFP (I746909) in sensor chips|subtitle=IPTG inducible superfolder GFP (I746909) is induced with IPTG (2 µl, 100mM) on the right chip with a non induced chip on the left|width=480px}} | {{Team:Aachen/FigureFloat|Aachen_I746909_slower_reduced.gif|title=IPTG inducible superfolder GFP (I746909) in sensor chips|subtitle=IPTG inducible superfolder GFP (I746909) is induced with IPTG (2 µl, 100mM) on the right chip with a non induced chip on the left|width=480px}} | ||
| - | This video shows the construct [http://parts.igem.org/Part:BBa_I746909 I746909] from the 2007 iGEM Team Cambridge. This BioBrick is a producer of superfolder GFP under the control of a T7 | + | This video shows the construct [http://parts.igem.org/Part:BBa_I746909 I746909] from the 2007 iGEM Team Cambridge. This BioBrick is a producer of superfolder GFP under the control of a T7 promoter. It was introduced into BL21(DE3) cells making the expression IPTG inducible through the T7 RNA Polymerase encoded in the genome of BL21(DE3) under the control of a lacI promoter. |
The left chip does not show visible fluorescence and the right chip exhibits a strong fluorescence signal showing clearly the ability of the sensor chip technology to detect IPTG. On top of that, the fluorescence response is strong enough to be detected and analyzed by the measurement device WatsOn. | The left chip does not show visible fluorescence and the right chip exhibits a strong fluorescence signal showing clearly the ability of the sensor chip technology to detect IPTG. On top of that, the fluorescence response is strong enough to be detected and analyzed by the measurement device WatsOn. | ||
Revision as of 23:25, 17 October 2014
|
|
|
|
|
|
 "
"
