Team:Aachen/Project/Model
From 2014.igem.org
(→Modeling) |
(→Modeling) |
||
| Line 21: | Line 21: | ||
| + | |||
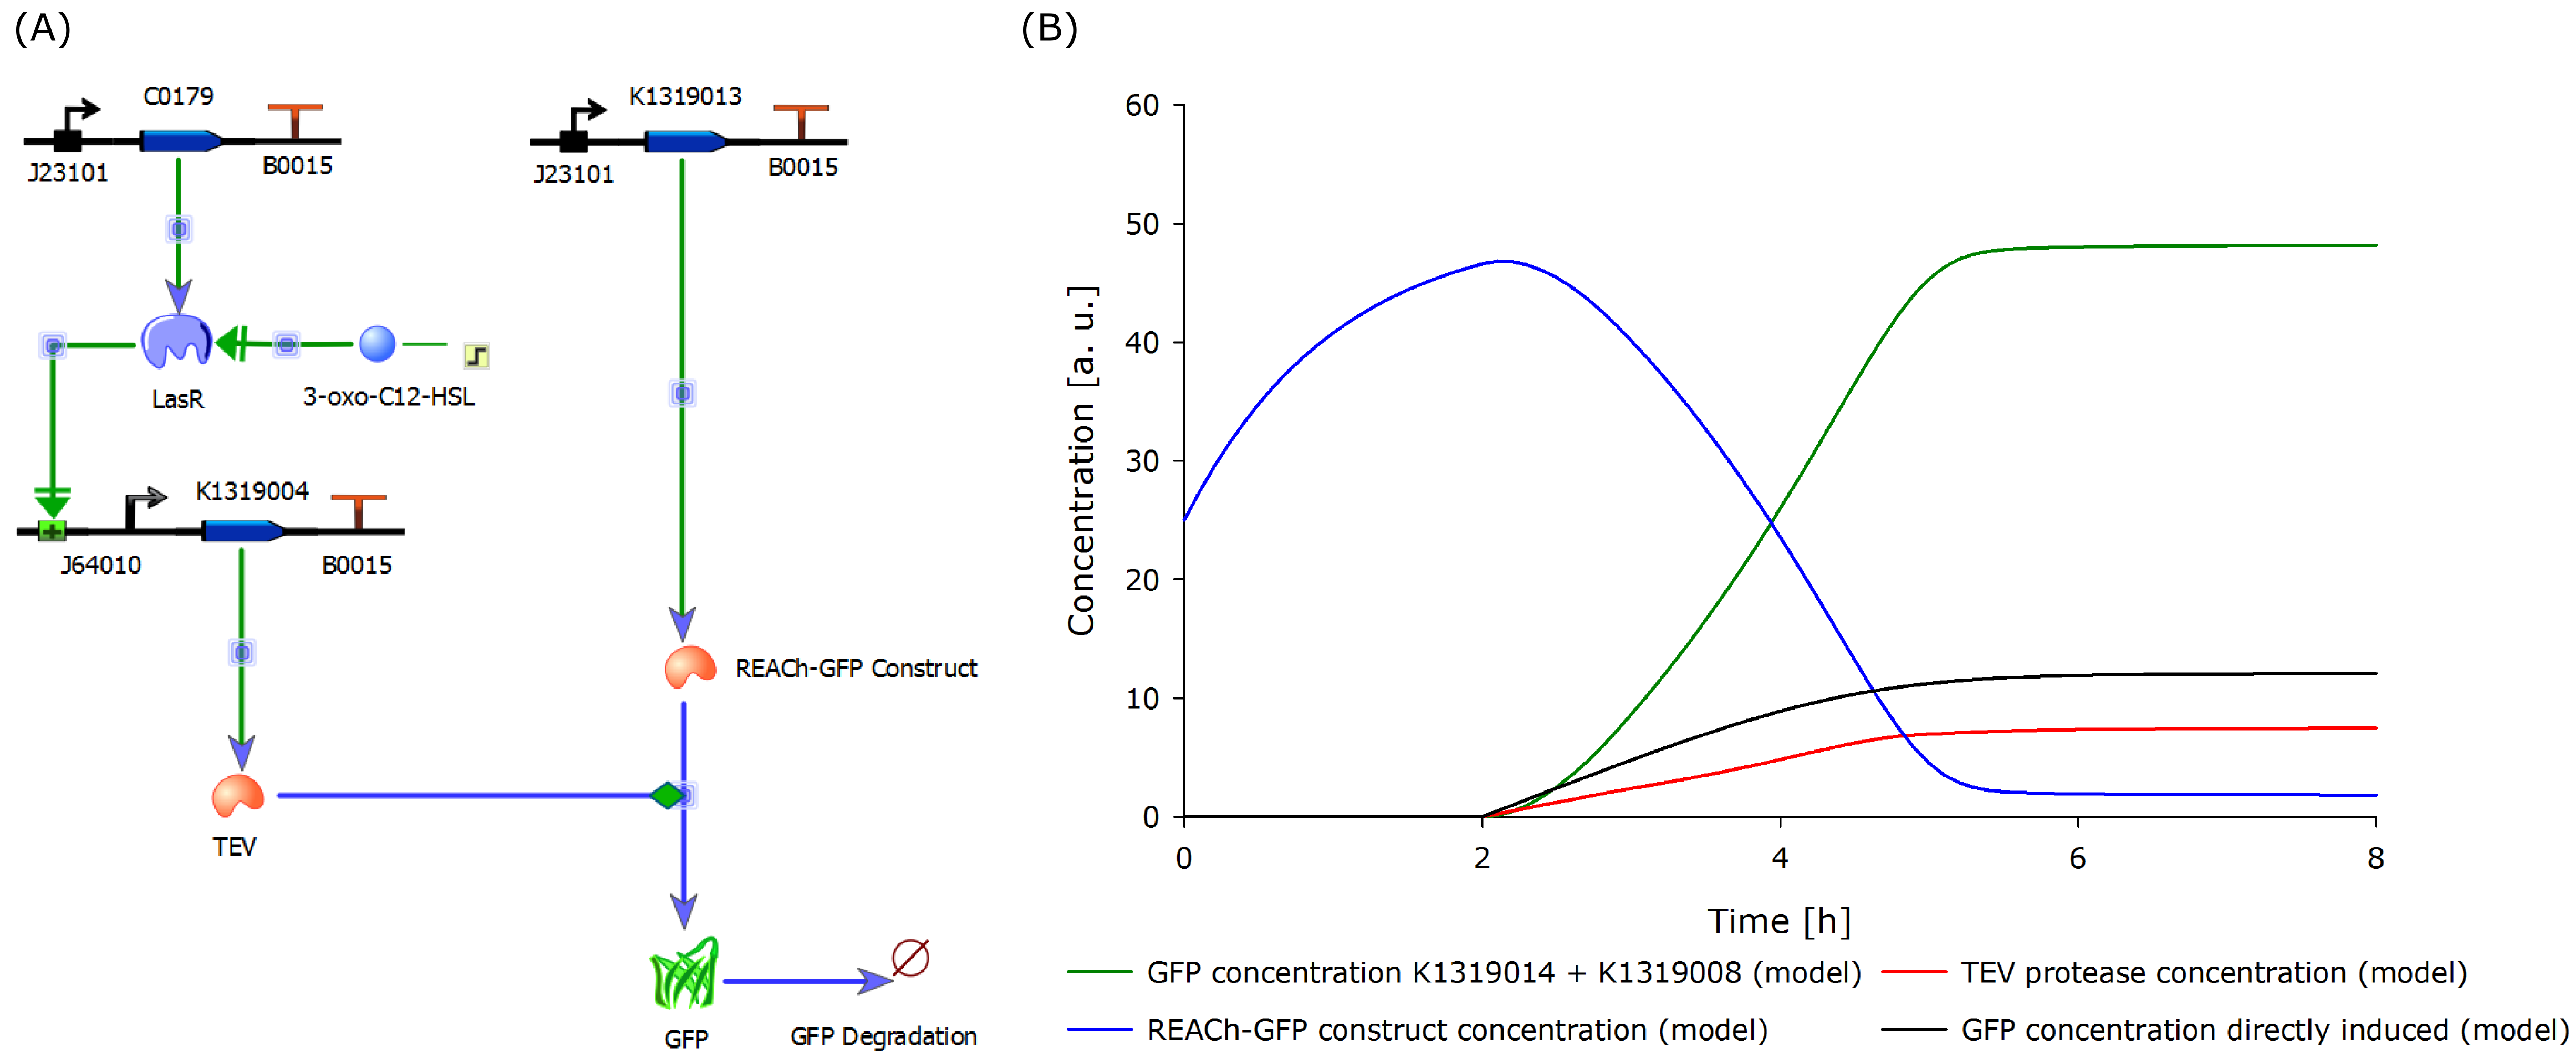
| + | To compare the response time of the fluorescence signal between our theoretical system and a traditional biosensor, we included a direct expression of GFP in the same plot (below). In the results show above, the strength of the promotor used for the direct GFP expression (traditional approach) is even twice as high as the strength of the promotor upstream of the TEV coding sequence in our new approach. Despite the weaker promotor, a '''higher GFP concentration is generated in the model of the novel biosensor''', predicting a quicker responde time of our system. | ||
| Line 26: | Line 28: | ||
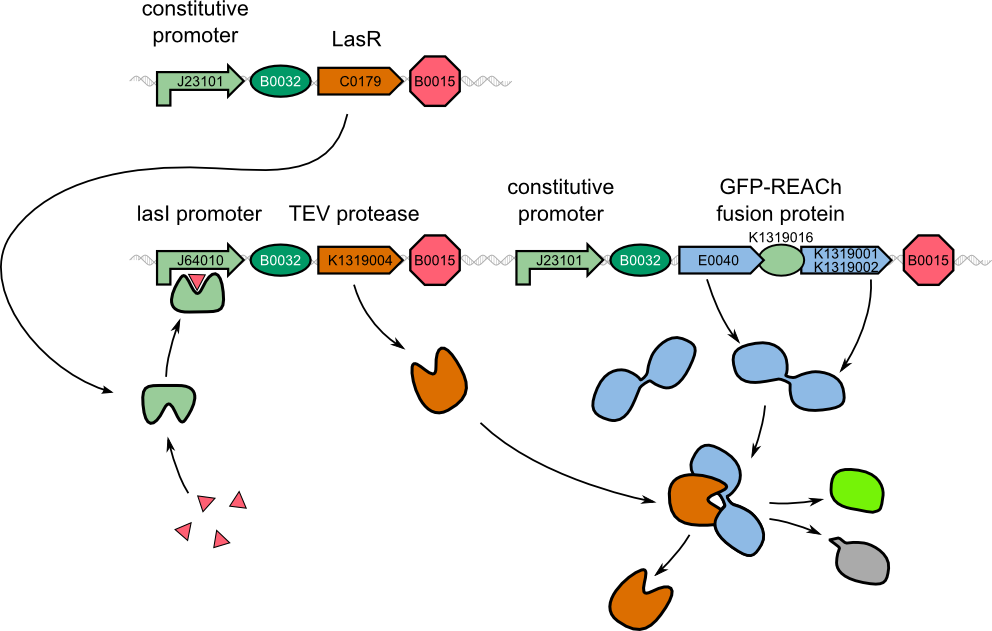
{{Team:Aachen/Figure|Aachen_Model_merged.png|align=center|title=Model of the molecular approach and the output over time|subtitle=The molecular setup of the novel biosensor (left) yields results indicating a strong and fast fluorescence output after induction (right). A directly inducible system was modeled and added to the plot for comparison.|width=1000px}} | {{Team:Aachen/Figure|Aachen_Model_merged.png|align=center|title=Model of the molecular approach and the output over time|subtitle=The molecular setup of the novel biosensor (left) yields results indicating a strong and fast fluorescence output after induction (right). A directly inducible system was modeled and added to the plot for comparison.|width=1000px}} | ||
</center> | </center> | ||
| - | |||
| - | |||
| - | |||
The model predicted that our approach should be an improvement over the commonly used direct expression, so we proceded with the clonings and assembled plasmids to test the system. | The model predicted that our approach should be an improvement over the commonly used direct expression, so we proceded with the clonings and assembled plasmids to test the system. | ||
Revision as of 21:49, 17 October 2014
|
|
 "
"


