Team:Aachen/Notebook/Engineering/ODF
From 2014.igem.org
(→Saccharomyces cerevisiae) |
(→Saccharomyces cerevisiae) |
||
| Line 213: | Line 213: | ||
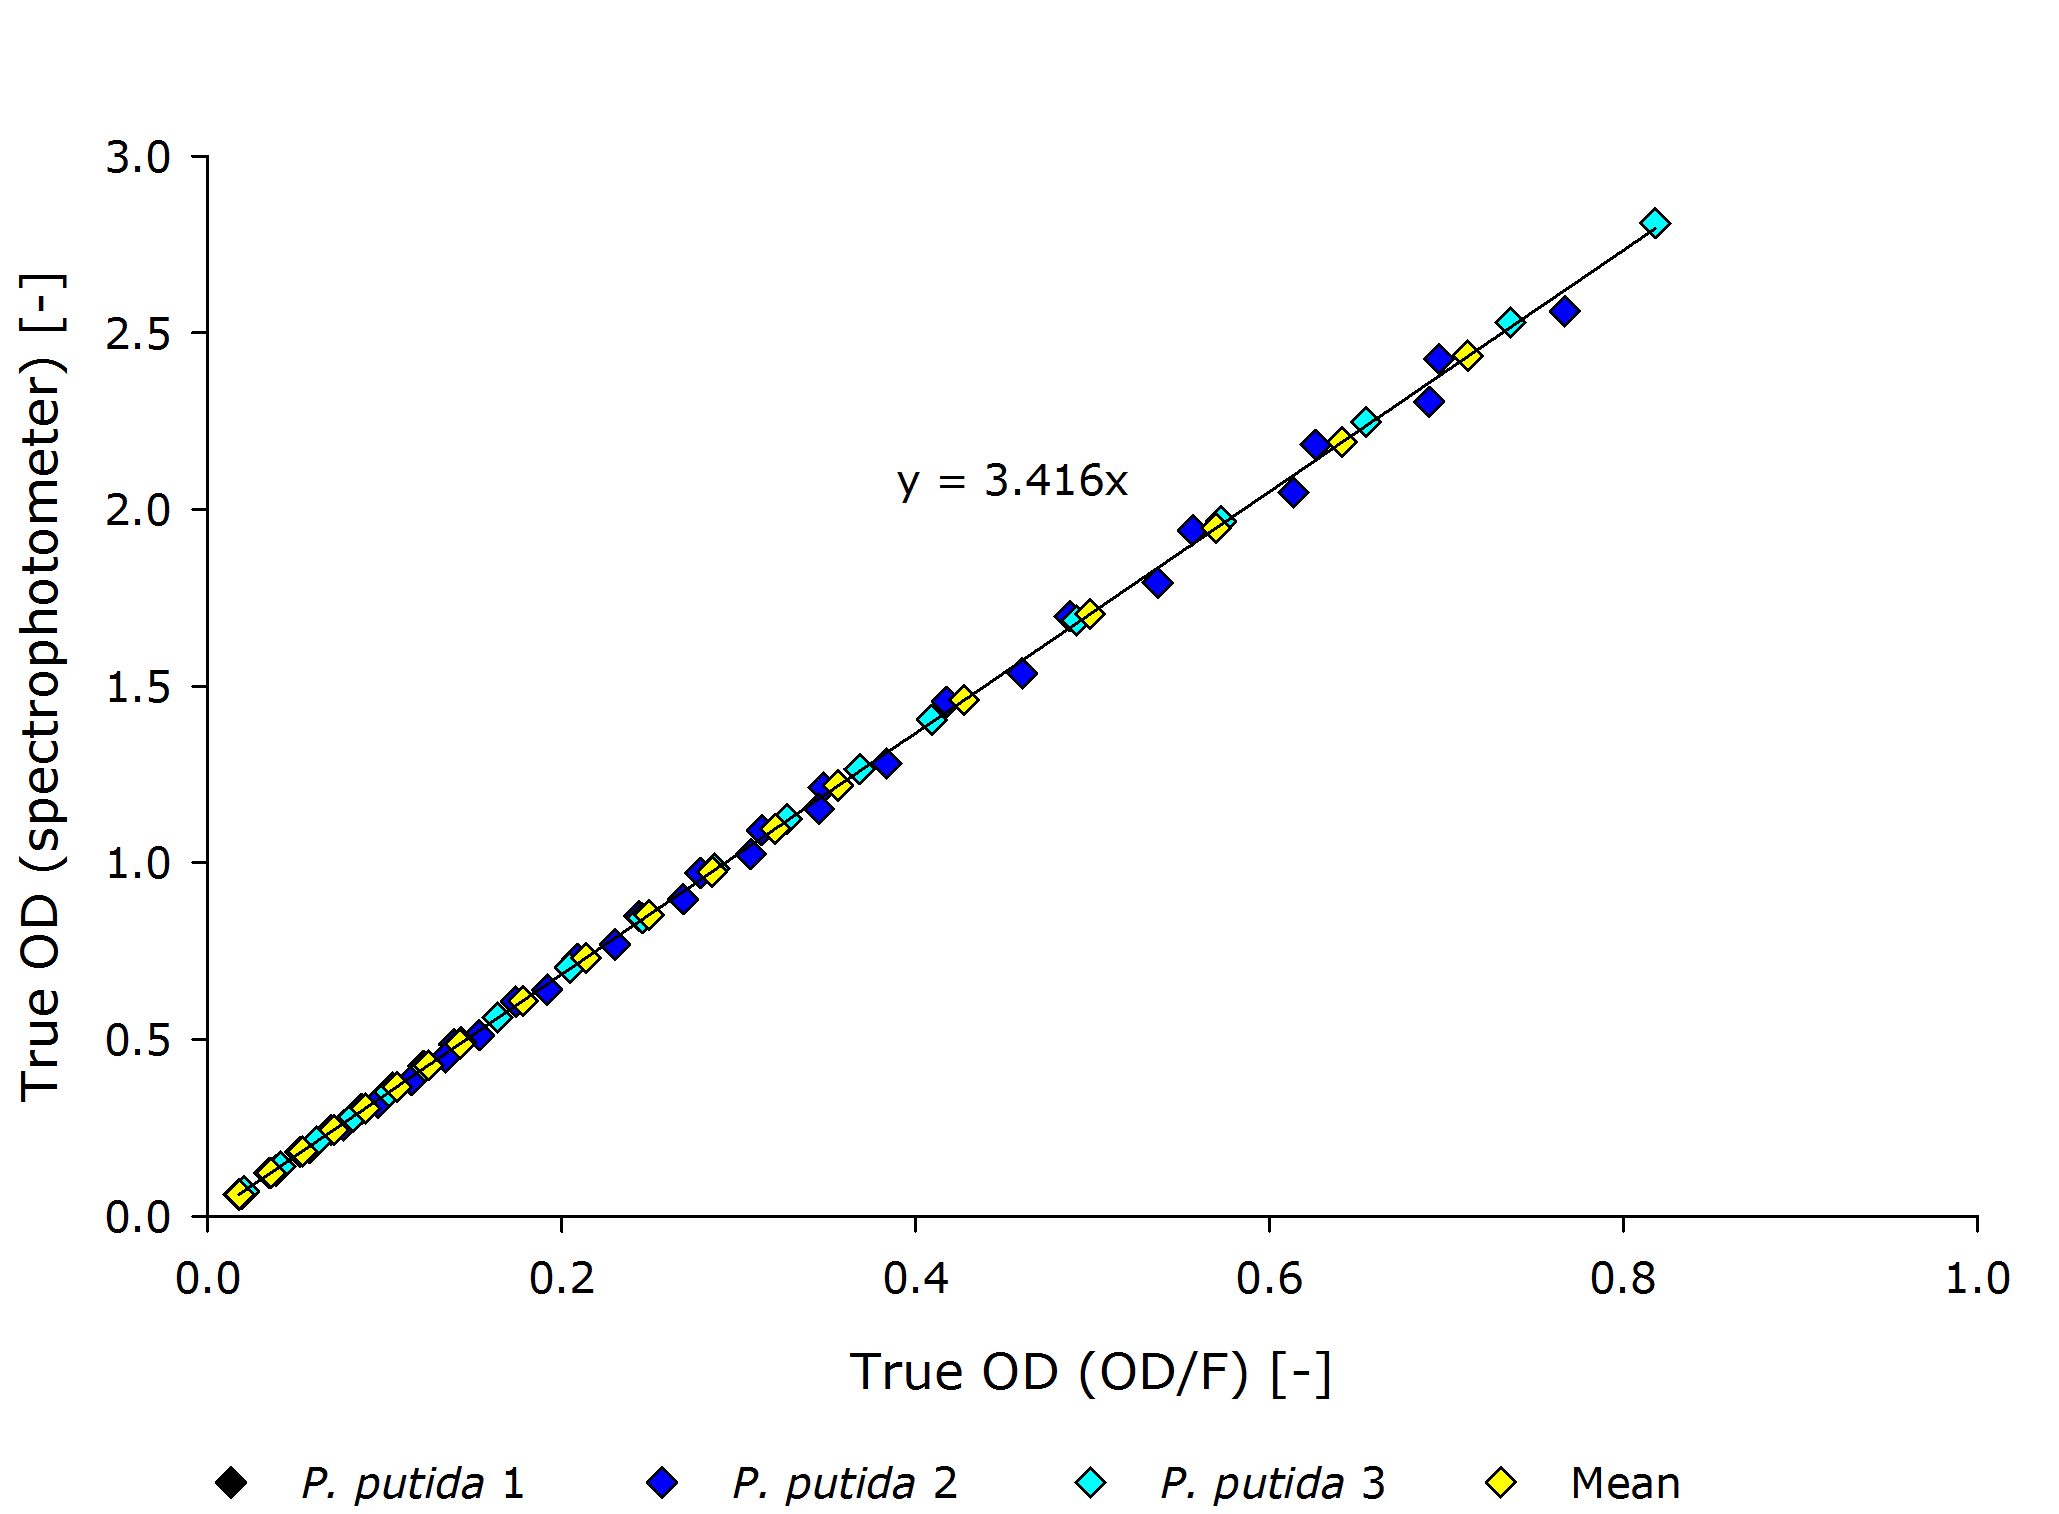
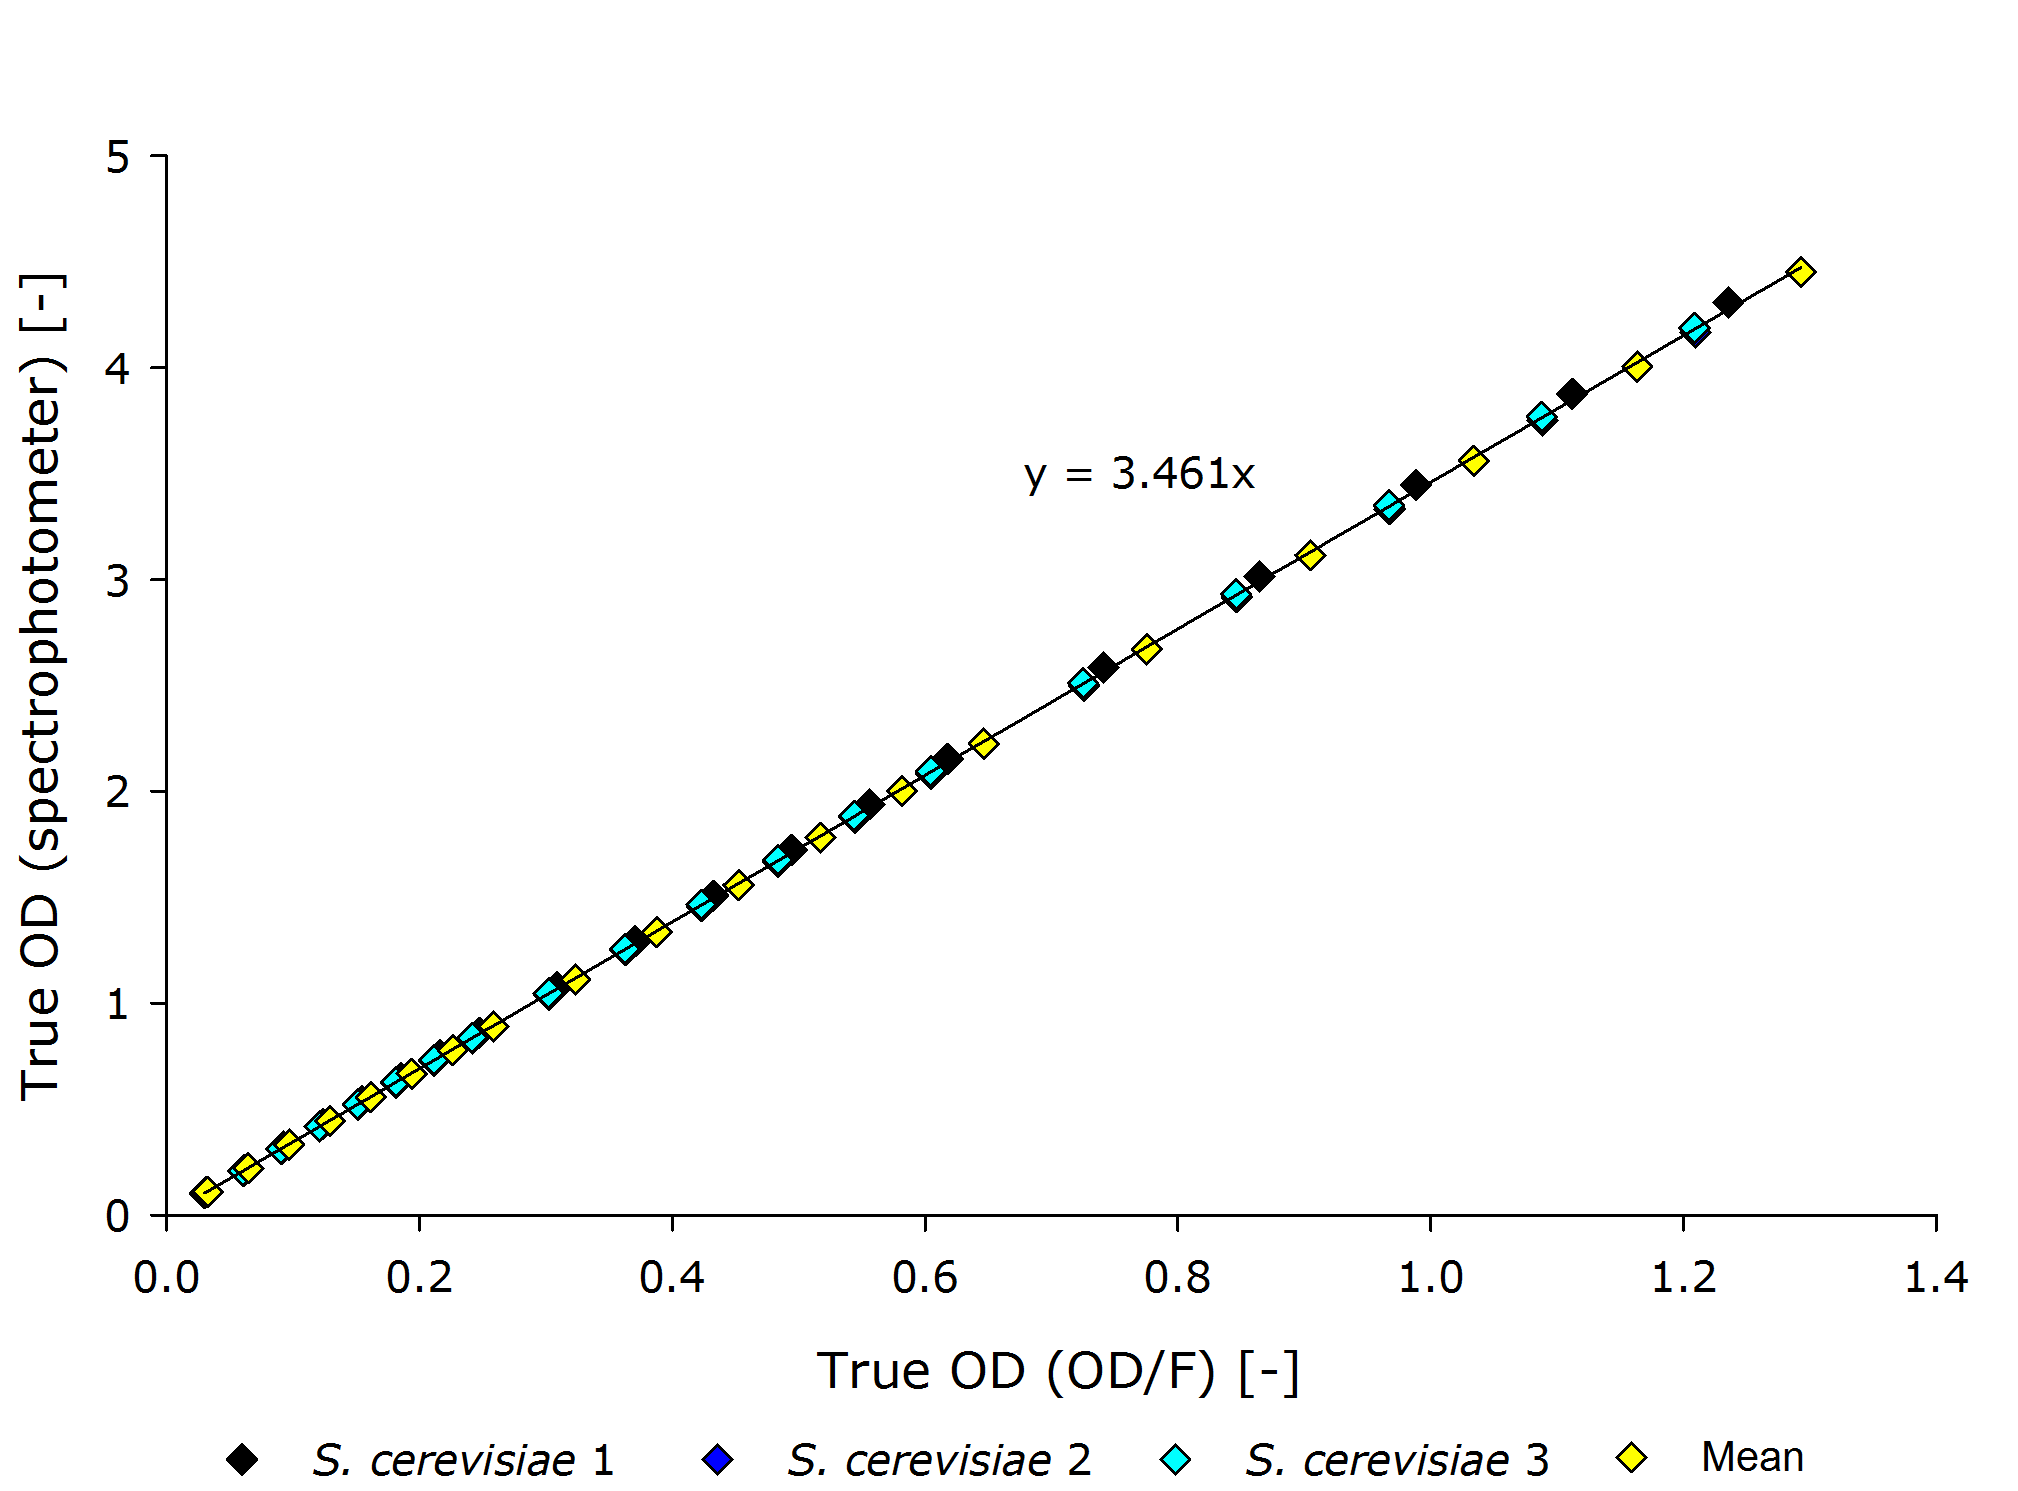
It is interesting to observer that function $g$, mapping the true OD of our device to the true OD of the photospectrometer, are close together for both ''P. putida'' and ''S. cerivisae'', as seen by the regression coefficient. | It is interesting to observer that function $g$, mapping the true OD of our device to the true OD of the photospectrometer, are close together for both ''P. putida'' and ''S. cerivisae'', as seen by the regression coefficient. | ||
In fact, 3.416 and 3.461 are such close together, that the minor deviation could be just measuring inaccuracy. | In fact, 3.416 and 3.461 are such close together, that the minor deviation could be just measuring inaccuracy. | ||
| - | Therefore we fix the regression coefficient for converting true OD of our device to true OD of the photospectrometer to | + | Therefore, we fix the regression coefficient for converting true OD of our device to true OD of the photospectrometer to an average of 3.432 . |
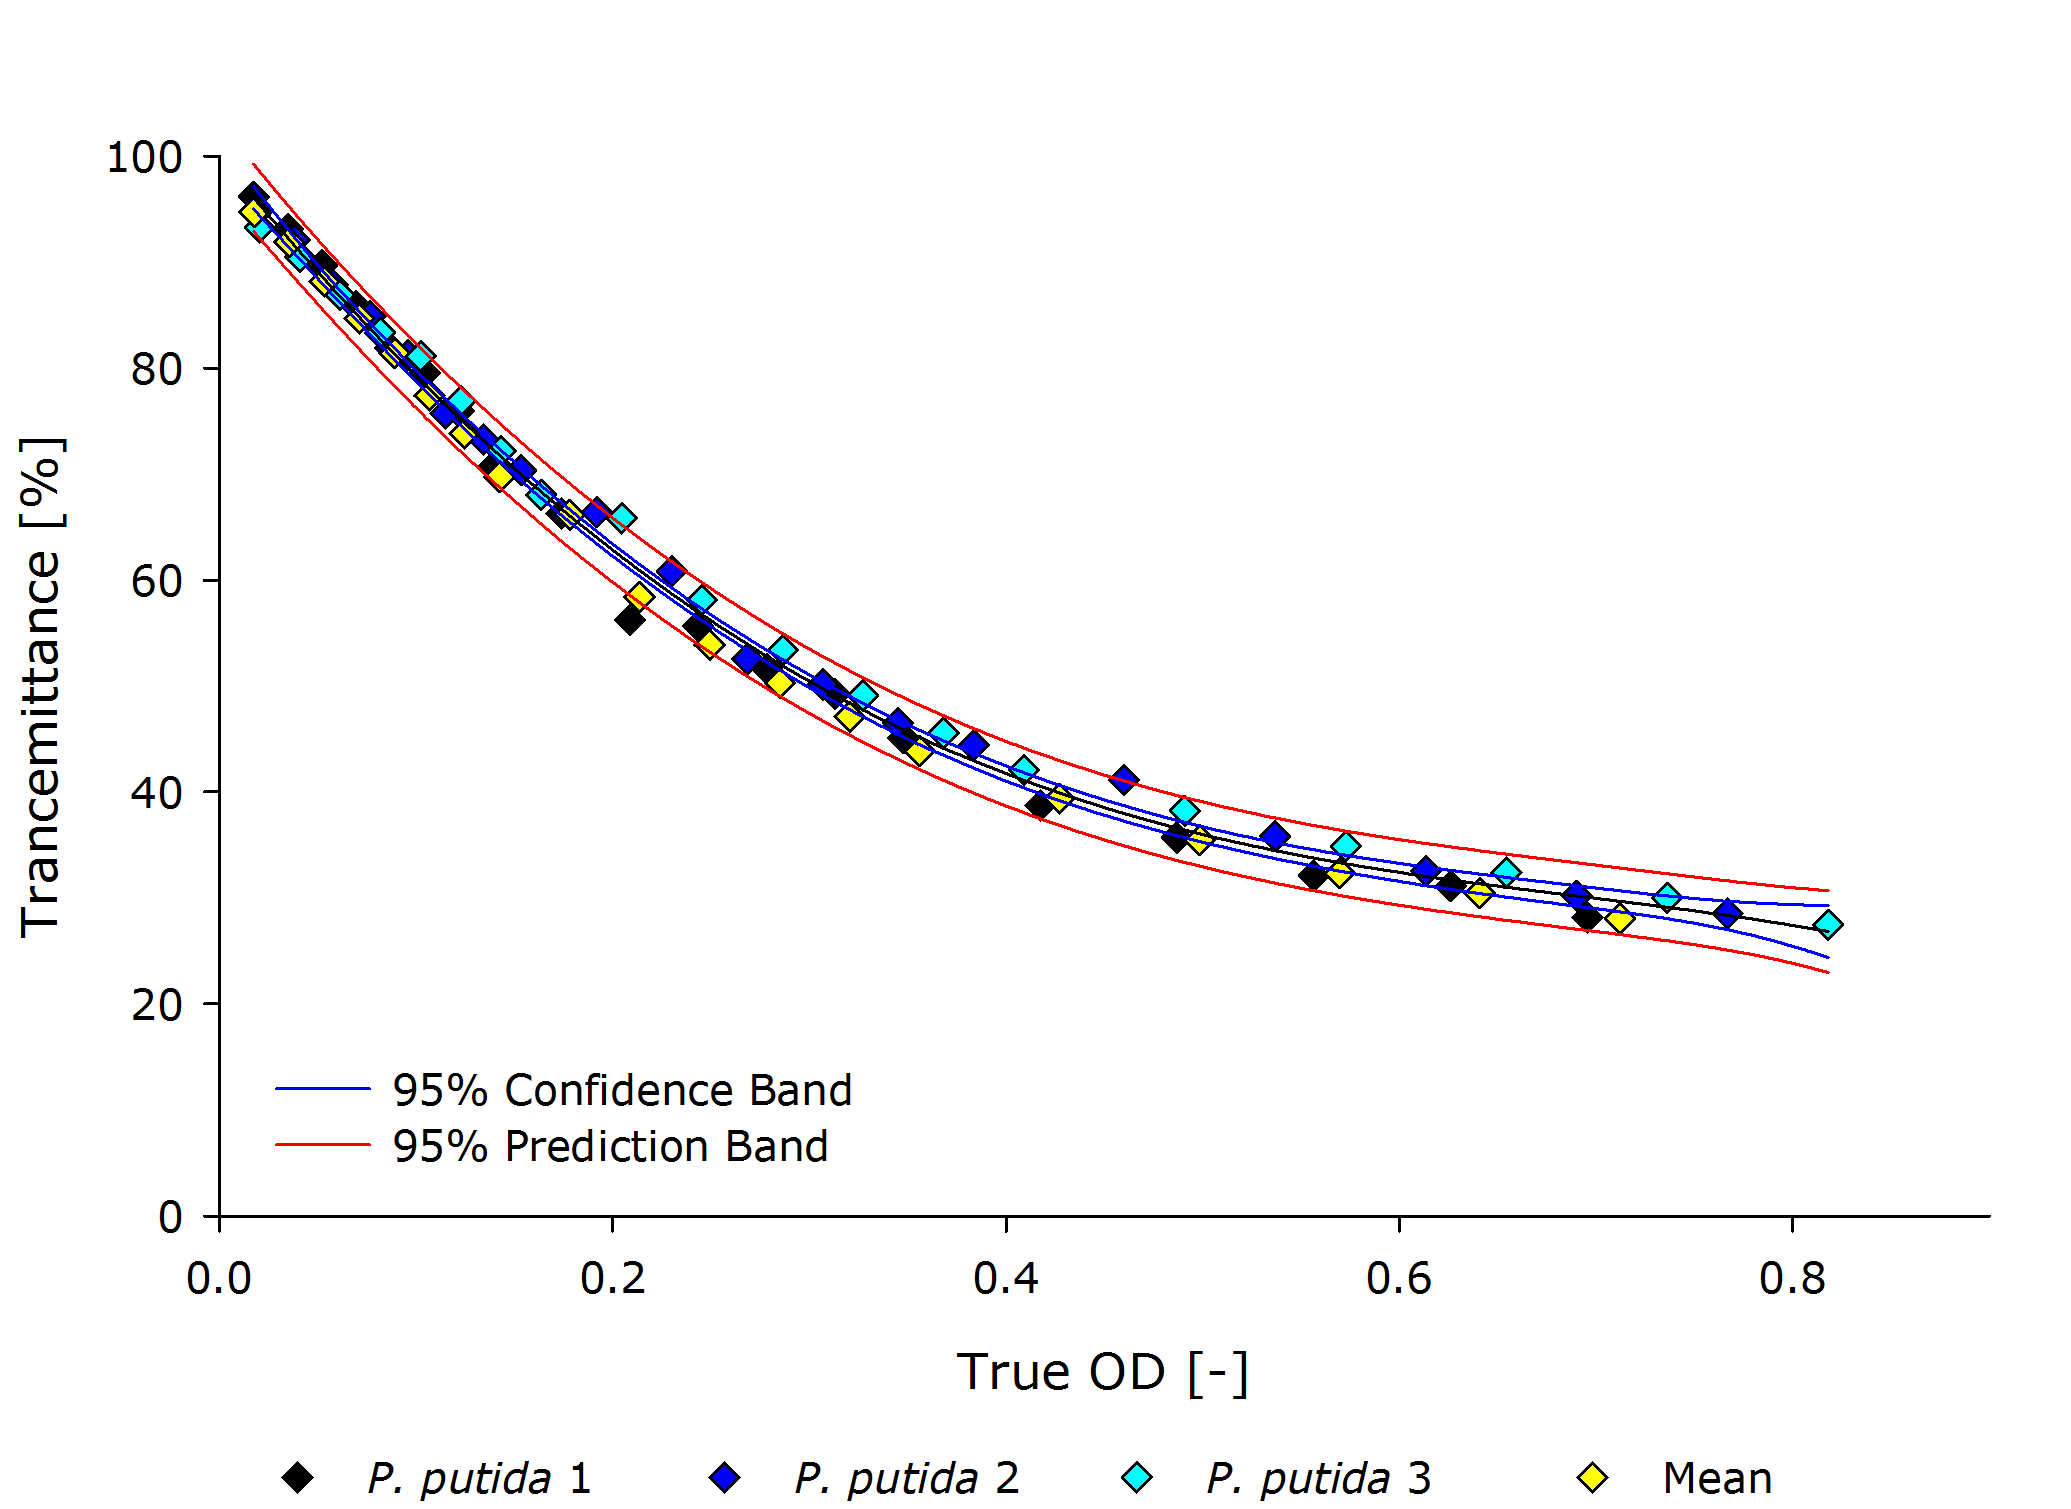
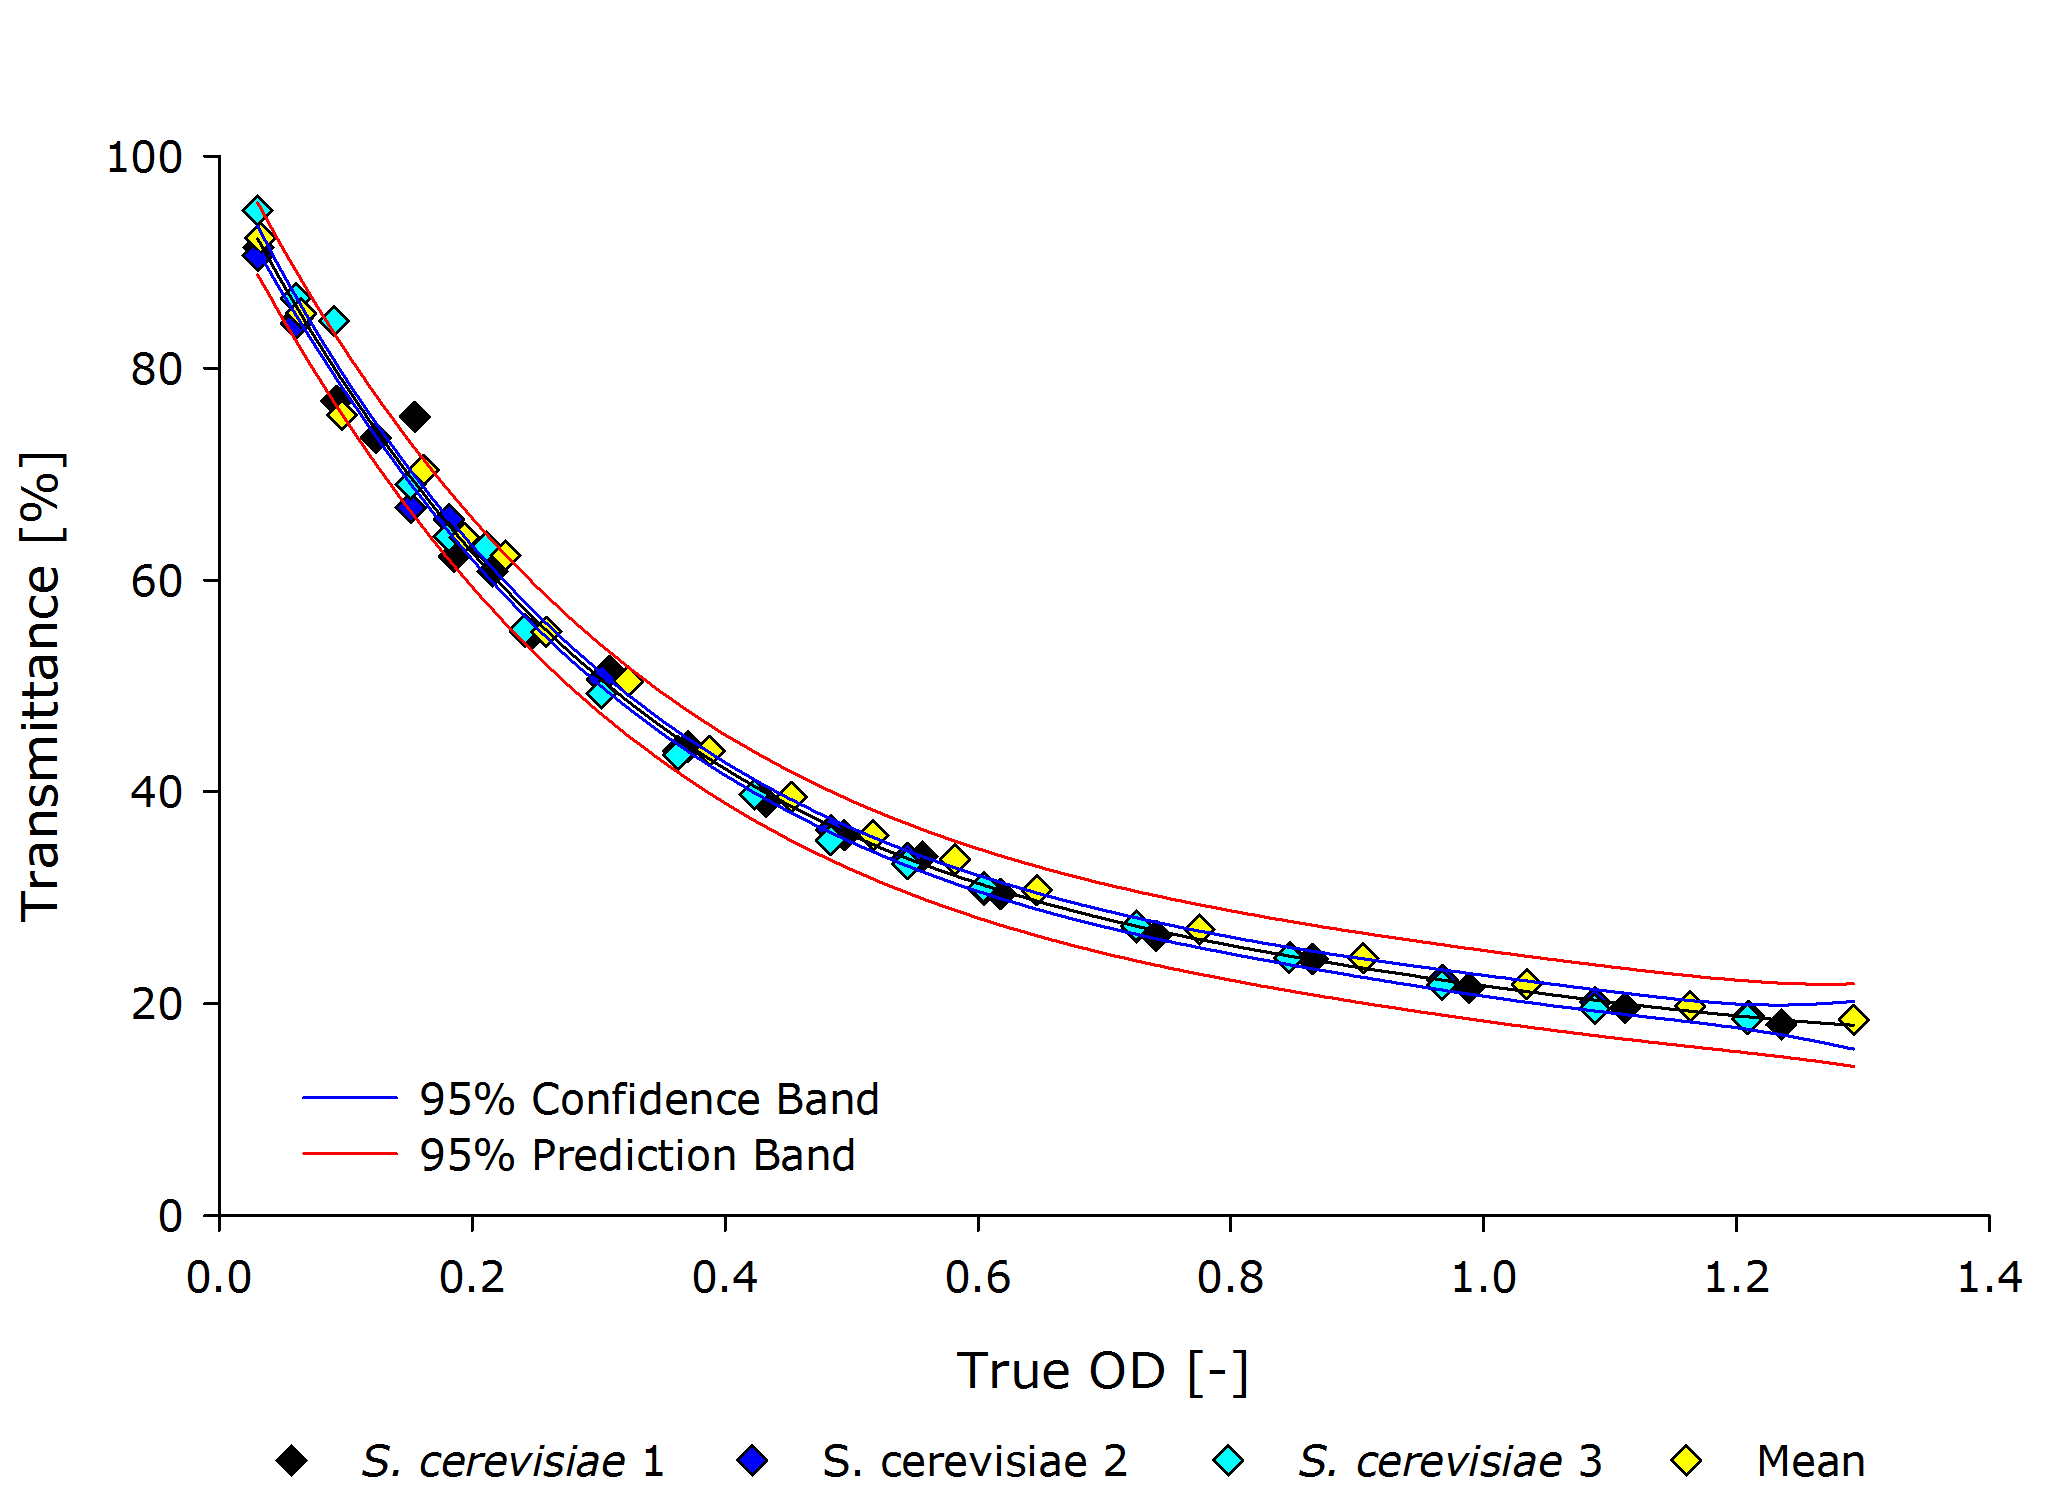
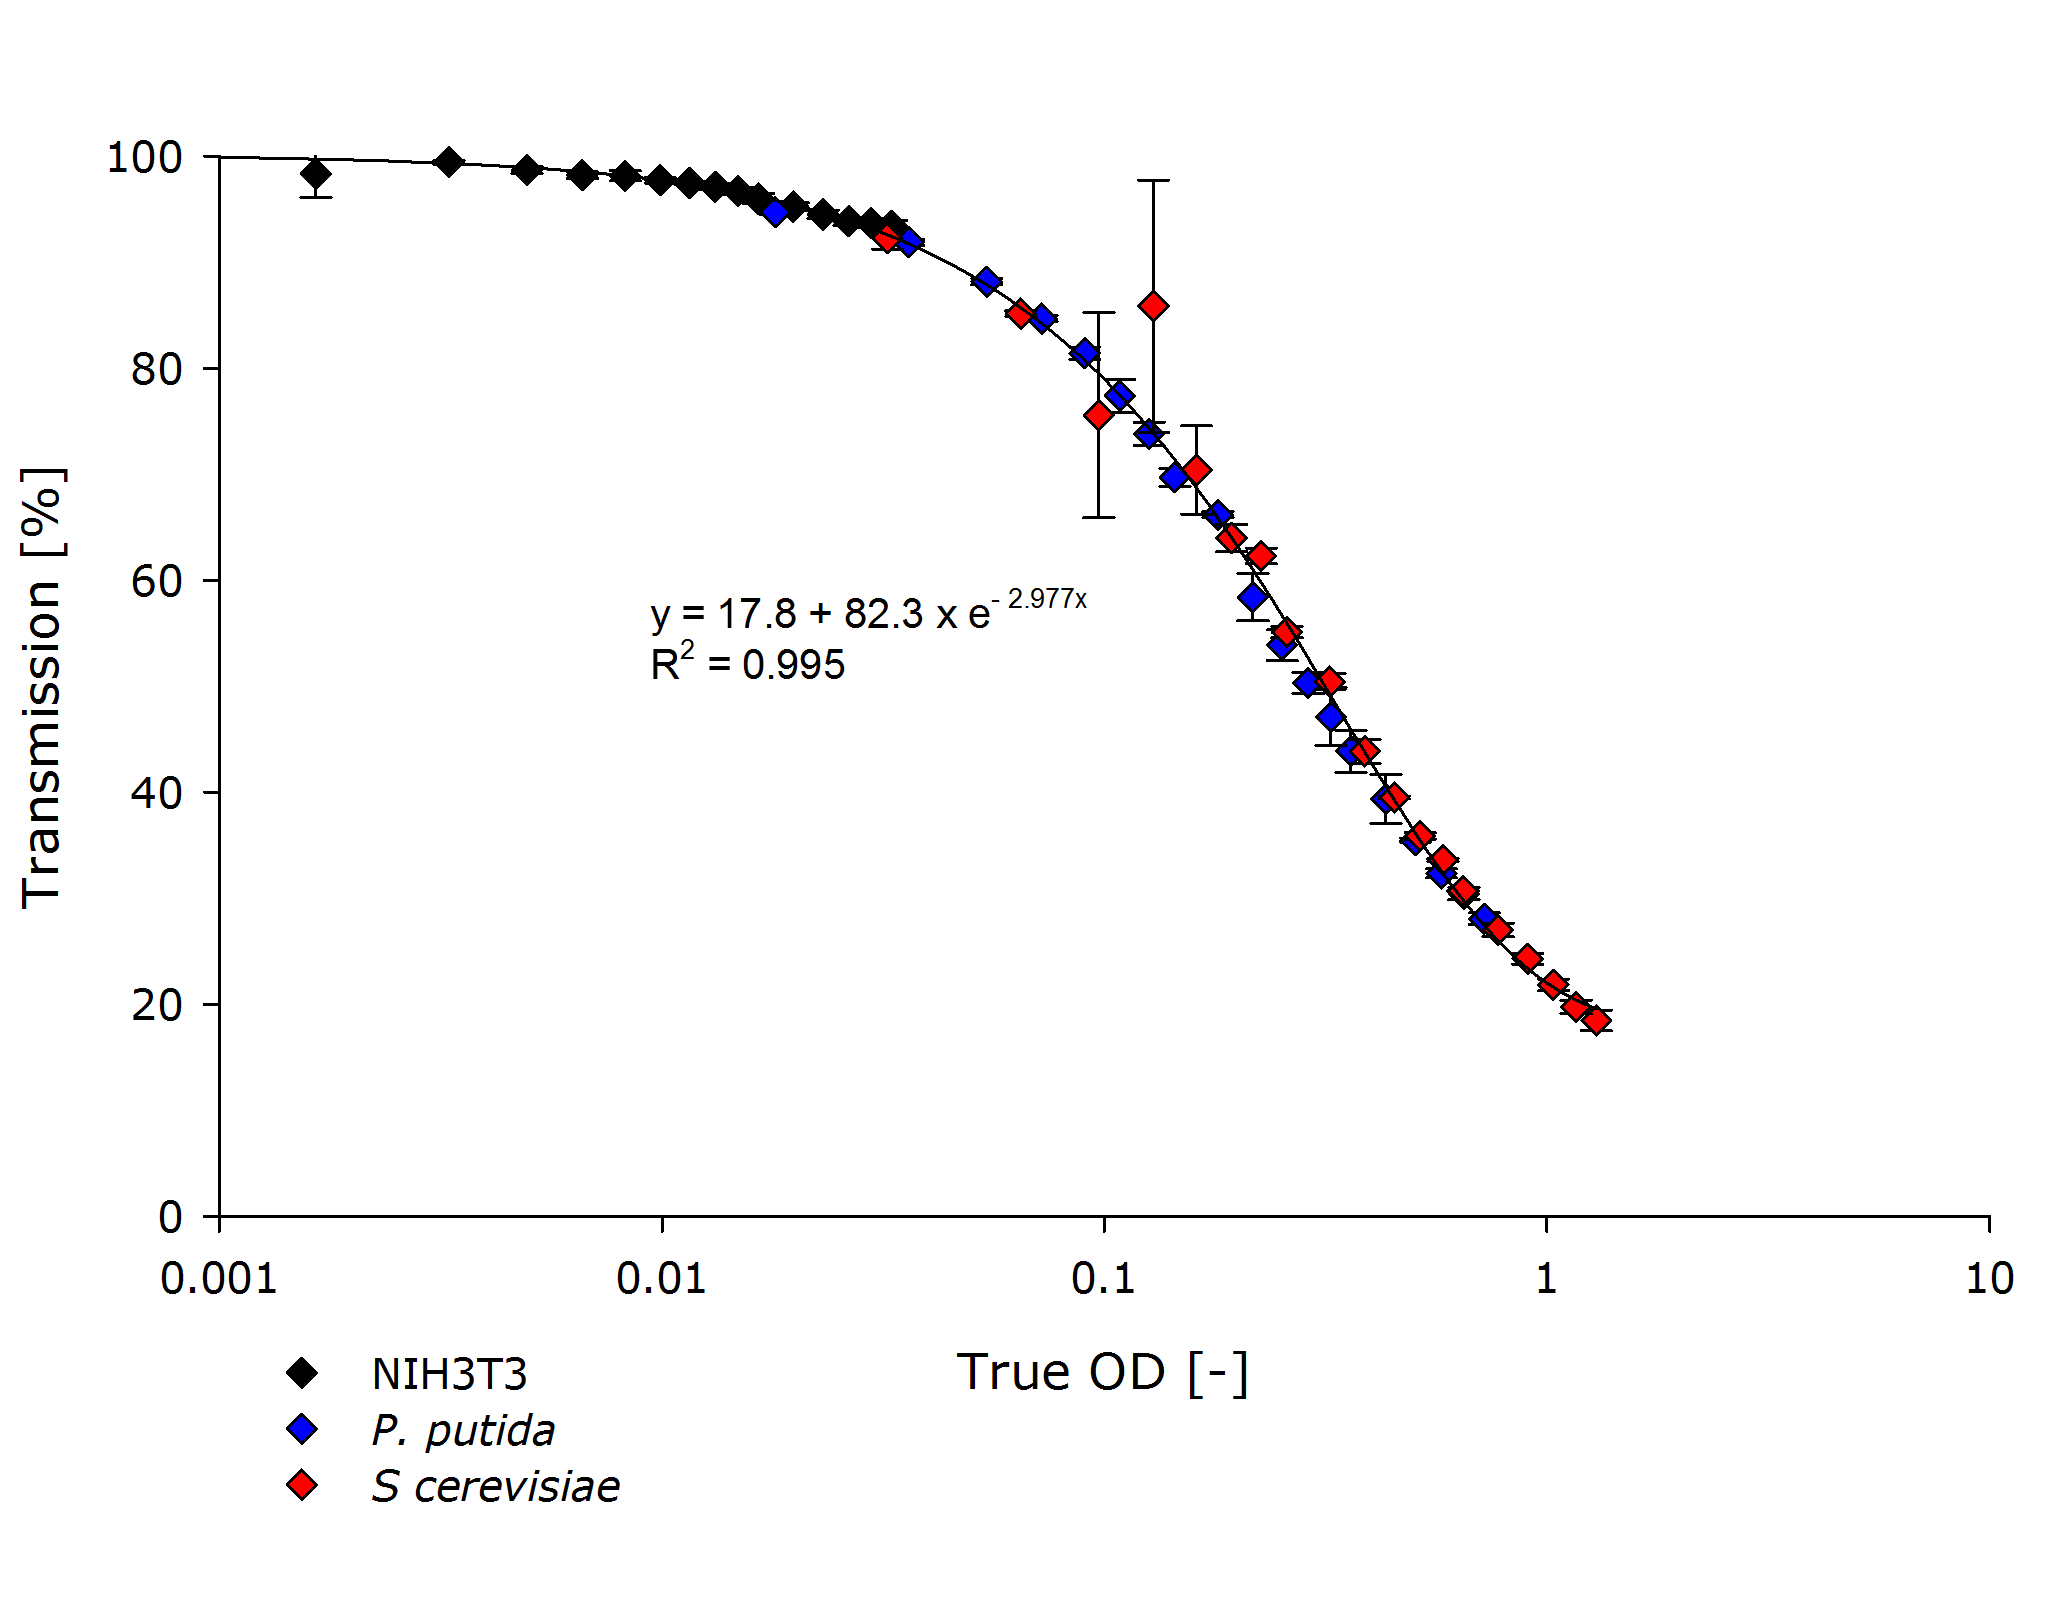
Additionally the function $f$ for mapping transmittance to true OD for our device is similar for all cell types, as seen in the following figure. Therefore the exponential regression curve for all cell types specifies this function. | Additionally the function $f$ for mapping transmittance to true OD for our device is similar for all cell types, as seen in the following figure. Therefore the exponential regression curve for all cell types specifies this function. | ||
| - | |||
| - | |||
<center> | <center> | ||
{{Team:Aachen/Figure|Aachen_ODallstrains1.png|title=Transmission of different cell types at OD-values from 0.001-1|subtitle=The transmittance data of NIH 3T3 cells (mouse fibroblasts) align with the transmittance of ''P. putida'' and ''S. cerevisiae'' strains, even though the measured optical densities are lower by 1-2 orders of magnitude.|width=800px}} | {{Team:Aachen/Figure|Aachen_ODallstrains1.png|title=Transmission of different cell types at OD-values from 0.001-1|subtitle=The transmittance data of NIH 3T3 cells (mouse fibroblasts) align with the transmittance of ''P. putida'' and ''S. cerevisiae'' strains, even though the measured optical densities are lower by 1-2 orders of magnitude.|width=800px}} | ||
</center> | </center> | ||
| + | Finally, we have empirically determined our $OD(T)$ function by finding $f$ and $g$, such that we can convert true OD to the optical density of the photospectrometer. | ||
| - | By this evaluation we have shown that our self-build | + | By this evaluation, we have shown that our self-build OD/F device can compete with commercial systems. |
| - | + | It is easy to calibrate by just calculating the true optical density. | |
| - | + | ||
{{Team:Aachen/BlockSeparator}} | {{Team:Aachen/BlockSeparator}} | ||
Revision as of 20:54, 17 October 2014
|
|
|
|
|
|
 "
"
