Team:Aachen/Project/Model
From 2014.igem.org
(→Modeling) |
(→Modeling) |
||
| Line 7: | Line 7: | ||
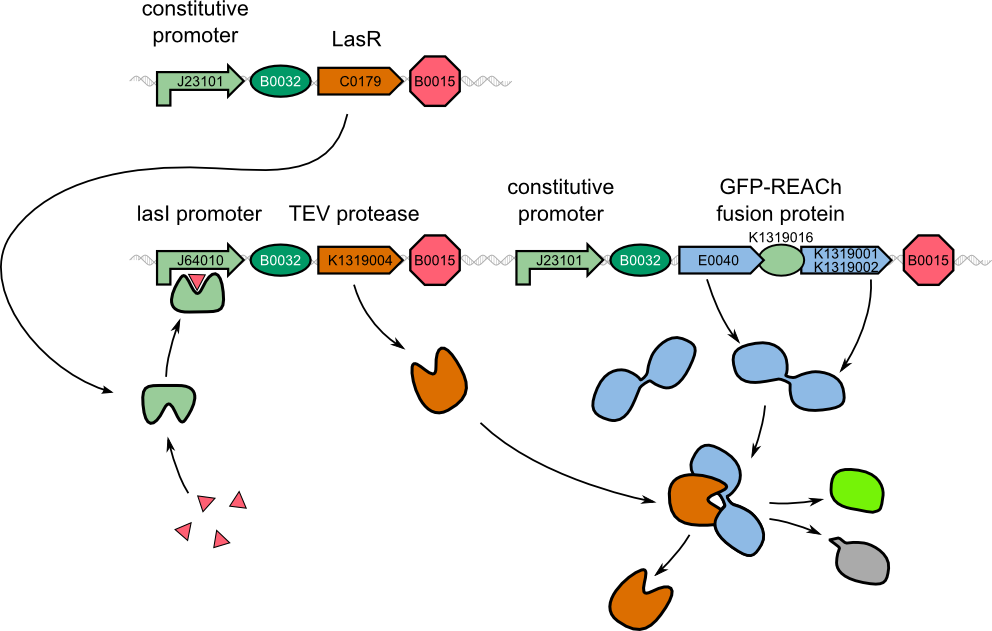
Prior to the experiments a model of the molecular approach was built to predict the results. The CAD tool TinkerCell was used to produce the models (Chandran, Bergmann and Sauro, 2009). | Prior to the experiments a model of the molecular approach was built to predict the results. The CAD tool TinkerCell was used to produce the models (Chandran, Bergmann and Sauro, 2009). | ||
| - | |||
<center> | <center> | ||
| Line 14: | Line 13: | ||
<center> | <center> | ||
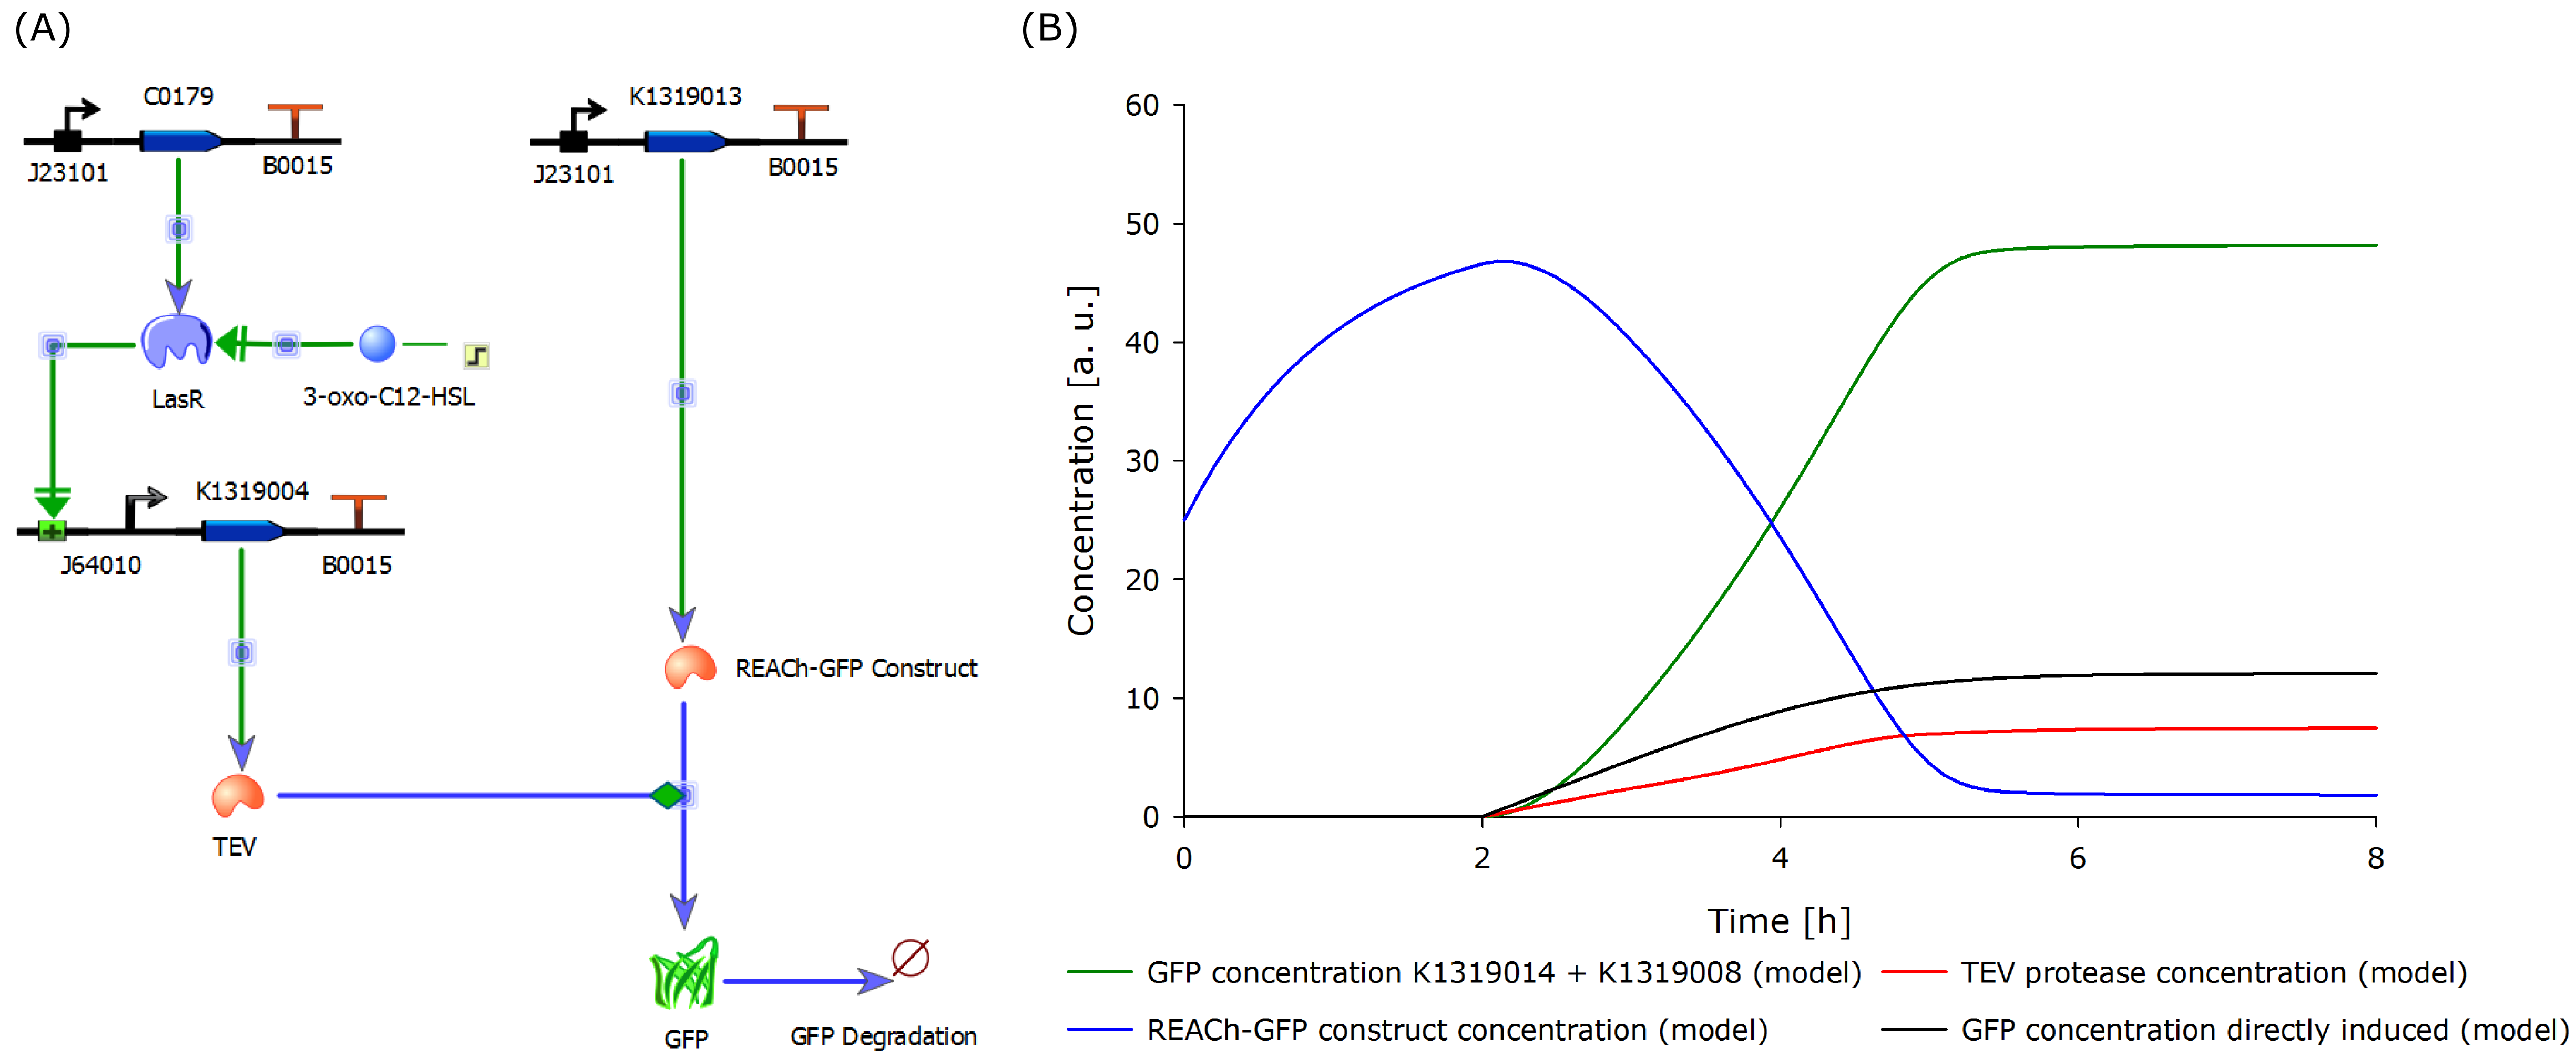
| - | {{Team:Aachen/Figure|Aachen_Model_merged.png|align=center|title=Model of the molecular approach and the output over time|subtitle=The molecular setup of the novel biosensor (left) yields results indicating a strong and fast fluorescence output after induction (right). A directly | + | {{Team:Aachen/Figure|Aachen_Model_merged.png|align=center|title=Model of the molecular approach and the output over time|subtitle=The molecular setup of the novel biosensor (left) yields results indicating a strong and fast fluorescence output after induction (right). A directly inducible system was modeled and added to the plot for comparison.|width=1000px}} |
</center> | </center> | ||
The novel biosensor approach was modeled as shown above. The plotted results also include a model of a direct expression of GFP as it appears in traditional biosensors. The strength of the promotor used for the traditional approach is twice as high as the strength of the promotor upstream of the TEV coding sequence in our novel approach. Despite the stronger promotor, a '''higher GFP concentration is generated in the model of the novel biosensor''', proving the stronger and faster fluorescence response of our construct in theory. | The novel biosensor approach was modeled as shown above. The plotted results also include a model of a direct expression of GFP as it appears in traditional biosensors. The strength of the promotor used for the traditional approach is twice as high as the strength of the promotor upstream of the TEV coding sequence in our novel approach. Despite the stronger promotor, a '''higher GFP concentration is generated in the model of the novel biosensor''', proving the stronger and faster fluorescence response of our construct in theory. | ||
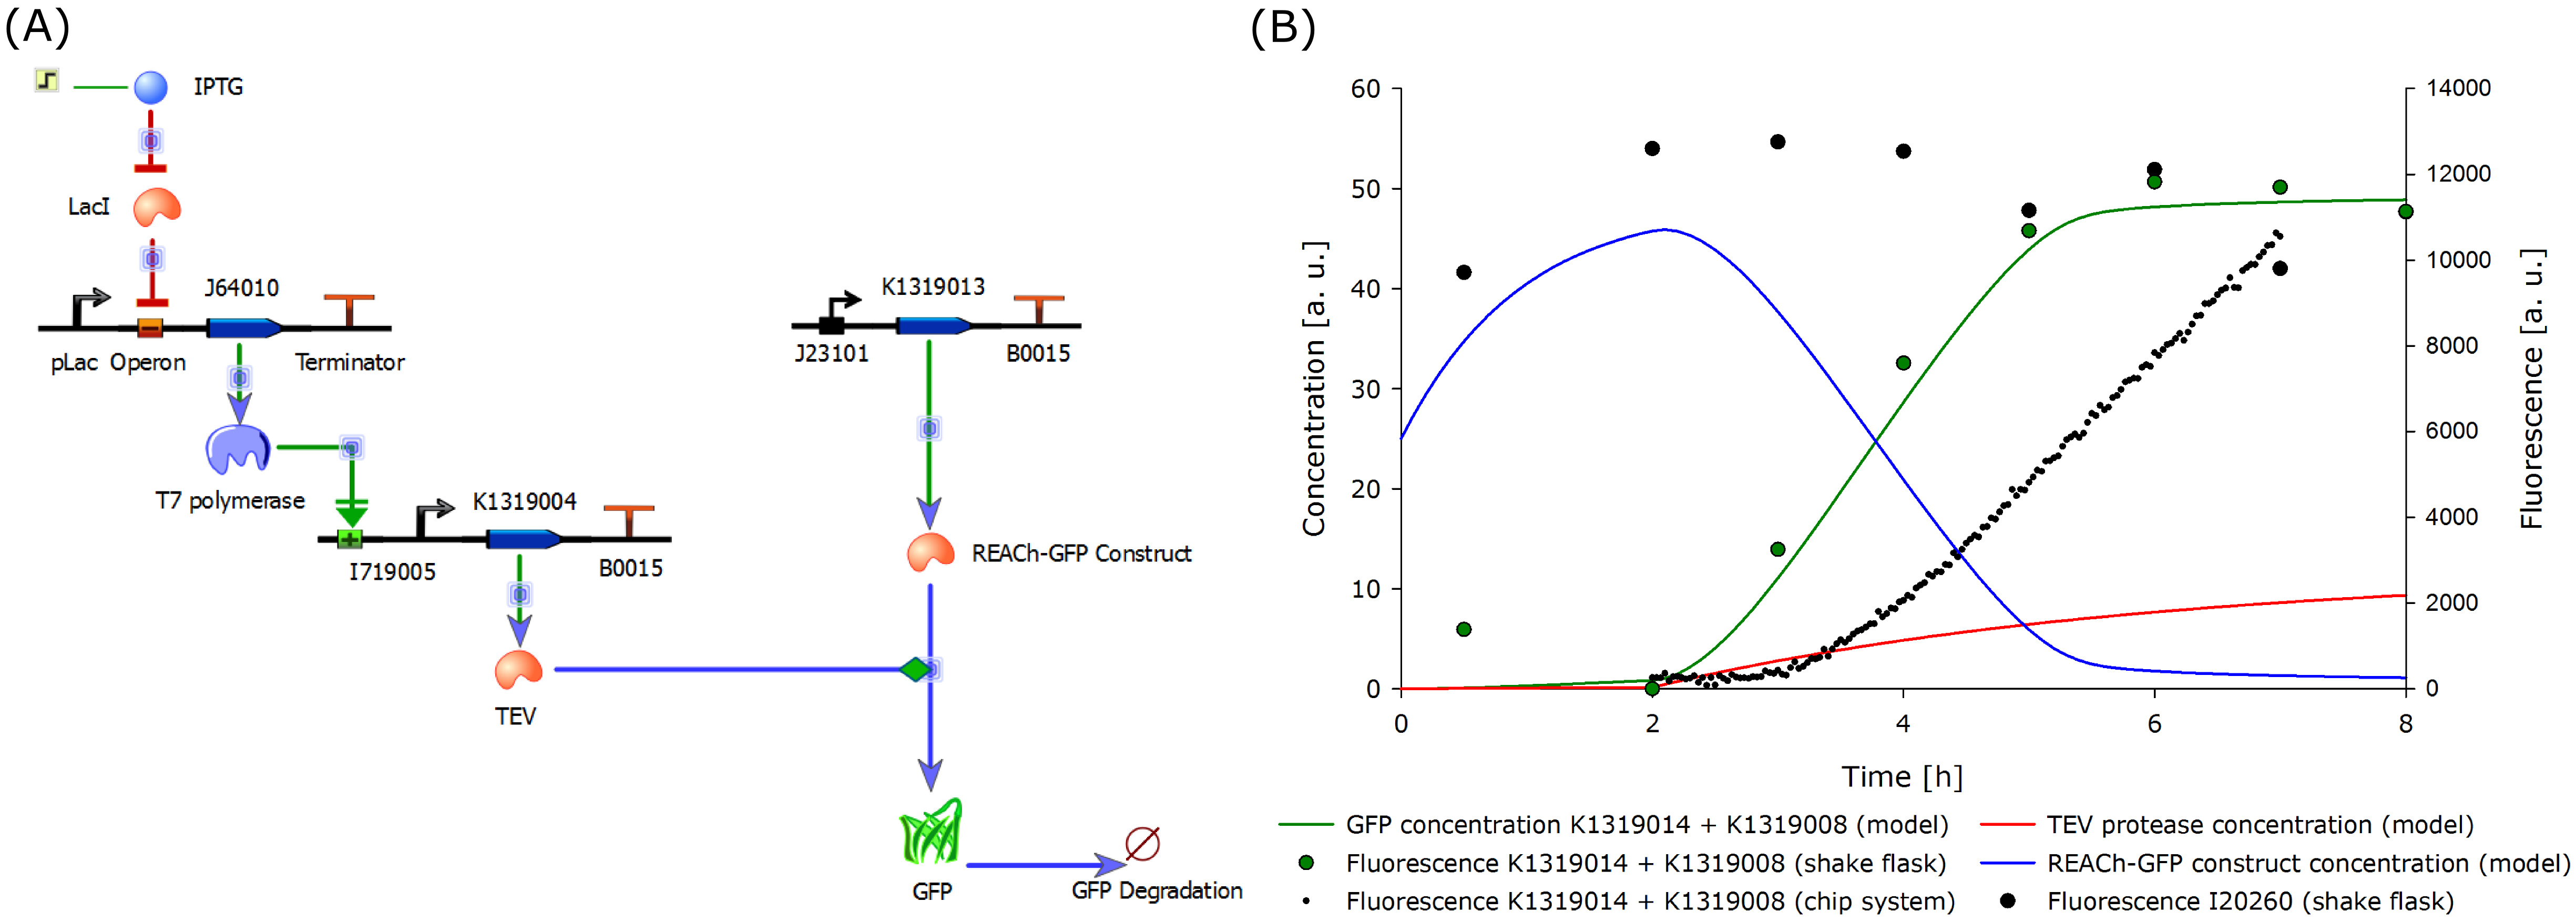
| - | + | A first approach was made to correlate the experimental data gathered from the characterization of the double plasmid system K1319014 + K1319008 to the model. This is inducible with IPTG instead of 3-oxo-C<sub>12</sub>-HSL as it contains the lac operon and is therefore a negative regulatory system. | |
| - | + | Although the modeled system and the existing system differ regarding the induction mechanism, the correlation was high. However, since the final 3-oxo-C<sub>12</sub>-HSL inducible construct could not be built in time, a new model was designed according to the existing and functional double plasmid system. | |
<center> | <center> | ||
| Line 26: | Line 25: | ||
</center> | </center> | ||
| - | The model was fitted to the data gathered from the characterization experiment conducted in shake flasks. Additionally, the data from the characterization experiment of the double plasmid construct K1319014 + K1319008 in the chip system was added. The data was derived from the plate reader output of the four central spots of the chip. The development of the fluorescence is presented in [https://2014.igem.org/Team:Aachen/Project/FRET_Reporter#reachachievementschip here]. It is shown that the fluorescent response occurs later than in the characterization experiment in shake flasks. This is explainable as the solid agar chip poses a greater diffusion barrier than liquid medium as used in the shake flasks. Further, the rate of fluorescence increase over time is smaller than in the characterization experiments in | + | The model was fitted to the data gathered from the characterization experiment conducted in shake flasks. Additionally, the data from the characterization experiment of the double plasmid construct K1319014 + K1319008 in the chip system was added in the plot. The data was derived from the plate reader output of the four central spots of the chip. The development of the fluorescence is presented in [https://2014.igem.org/Team:Aachen/Project/FRET_Reporter#reachachievementschip here]. It is shown that the fluorescent response occurs later than in the characterization experiment in shake flasks. This is explainable as the solid agar chip poses a greater diffusion barrier than liquid medium as used in the shake flasks. Further, the rate of fluorescence increase over time is smaller than in the characterization experiments in shake flasks. The reason for that is the oxygen limitation of the sensor cells when embedded in the agar chips. |
{{Team:Aachen/BlockSeparator}} | {{Team:Aachen/BlockSeparator}} | ||
Revision as of 20:27, 17 October 2014
|
|
 "
"


