Team:Aachen/Project/2D Biosensor
From 2014.igem.org
(→Medium) |
(→Achievements) |
||
| Line 181: | Line 181: | ||
=== Testing our Sensor Chips in a Plate Reader === | === Testing our Sensor Chips in a Plate Reader === | ||
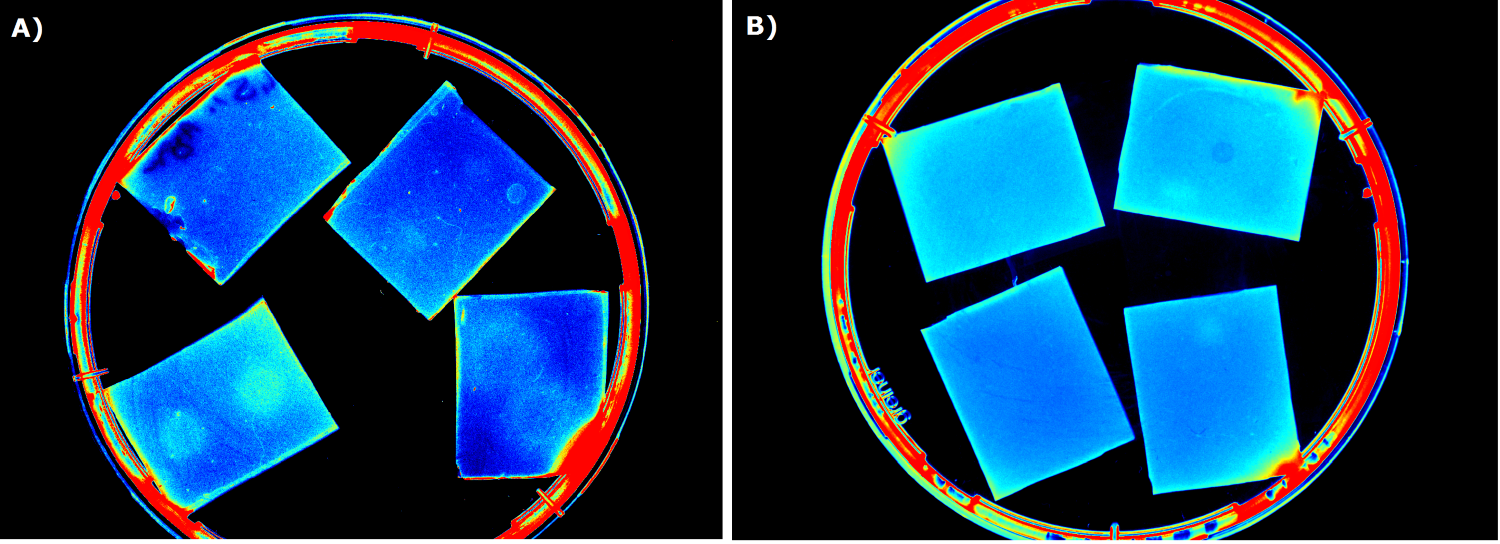
{{Team:Aachen/FigureFloat|Aachen_K1319042_Platereader.gif|title=Testing K1319042 in our sensor chips|subtitle=K1319042 in our sensor chip induced with 2 µL IPTG and measured with a plate reader. Blue color indicates no fluorescence, red color indicates fluorescence. Top chip is not induced, bottom chip is induced with IPTG.|width=300px}} | {{Team:Aachen/FigureFloat|Aachen_K1319042_Platereader.gif|title=Testing K1319042 in our sensor chips|subtitle=K1319042 in our sensor chip induced with 2 µL IPTG and measured with a plate reader. Blue color indicates no fluorescence, red color indicates fluorescence. Top chip is not induced, bottom chip is induced with IPTG.|width=300px}} | ||
| + | |||
| + | |||
To establish a prove of principle we used our construct [http://parts.igem.org/Part:BBa_K1319042 K1319042] an IPTG inducible iLOV. They were introduced into our sensor chips and then fluorescence was measured every 15 minutes after an induction with 2 µl 100 mM IPTG. | To establish a prove of principle we used our construct [http://parts.igem.org/Part:BBa_K1319042 K1319042] an IPTG inducible iLOV. They were introduced into our sensor chips and then fluorescence was measured every 15 minutes after an induction with 2 µl 100 mM IPTG. | ||
| Line 187: | Line 189: | ||
This demonstrates a general proof of principle of the sensor chip design. Therefore the next was testing the detection of 3-oxo-C{{sub|12}} HSL. | This demonstrates a general proof of principle of the sensor chip design. Therefore the next was testing the detection of 3-oxo-C{{sub|12}} HSL. | ||
| - | <html | + | <html></br></br></br></br></br></br></br></br></br></br></br></br></br></br></br></br></br></br></br> |
</html> | </html> | ||
| Line 193: | Line 195: | ||
{{Team:Aachen/FigureFloatRight|Aachen_K131026_Platereader.gif|title=Testing K131026 in our sensor chips|subtitle=K131026 in our sensor chip induced with 0.2 µL 3-oxo-C{{sub|12}} HSL and measured with a plate reader. Blue color indicates no fluorescence, red color indicates fluorescence. Top chip is not induced, bottom chip is induced with IPTG.|width=300px}} | {{Team:Aachen/FigureFloatRight|Aachen_K131026_Platereader.gif|title=Testing K131026 in our sensor chips|subtitle=K131026 in our sensor chip induced with 0.2 µL 3-oxo-C{{sub|12}} HSL and measured with a plate reader. Blue color indicates no fluorescence, red color indicates fluorescence. Top chip is not induced, bottom chip is induced with IPTG.|width=300px}} | ||
| + | |||
| + | |||
As a next step, we used [http://parts.igem.org/Part:BBa_K131026 K131026] from the 2008 iGEM Team Calgary in our sensor chips to detect 3-oxo-C{{sub|12}} HSL which is produced by ''Pseudomonas aeruginosa'' during quorum sensing. First, we tested them by direct induction with purified 3-oxo-C{{sub|12}} HSL (0.2 µL, 500 µg/mL). A fluorescence measurement was taken every 15 min with an excitation wavelength of 496 nm and an emission wavelength of 516 nm (for GFP). | As a next step, we used [http://parts.igem.org/Part:BBa_K131026 K131026] from the 2008 iGEM Team Calgary in our sensor chips to detect 3-oxo-C{{sub|12}} HSL which is produced by ''Pseudomonas aeruginosa'' during quorum sensing. First, we tested them by direct induction with purified 3-oxo-C{{sub|12}} HSL (0.2 µL, 500 µg/mL). A fluorescence measurement was taken every 15 min with an excitation wavelength of 496 nm and an emission wavelength of 516 nm (for GFP). | ||
| Line 198: | Line 202: | ||
The measured fluorescence again showed a distinct signal on the induced chip (bottom) compared to the uninduced chip (top). The fluorescence clearly starts in the middle of the chip (point of induction) and then extends outwards, still showing an ever increasing signal of fluorescence. The base level of fluorescence is attributed to leakiness of the promoter and general background fluorescence of growing ''E. coli'' cells. In the induced chip (bottom), the background fluorescence is a lot lower than in the uninduced chip (top) because the signal masks the noise. The difference between the induced and uninduced chips indicates a clear response to the HSL and a proof for the ability of our sensor chip design to detect the HSL produced by ''Pseudomonas aeruginosa''. | The measured fluorescence again showed a distinct signal on the induced chip (bottom) compared to the uninduced chip (top). The fluorescence clearly starts in the middle of the chip (point of induction) and then extends outwards, still showing an ever increasing signal of fluorescence. The base level of fluorescence is attributed to leakiness of the promoter and general background fluorescence of growing ''E. coli'' cells. In the induced chip (bottom), the background fluorescence is a lot lower than in the uninduced chip (top) because the signal masks the noise. The difference between the induced and uninduced chips indicates a clear response to the HSL and a proof for the ability of our sensor chip design to detect the HSL produced by ''Pseudomonas aeruginosa''. | ||
| - | <html | + | <html></br></br></br></br></br></br></br></br></html> |
=== Detecting IPTG with Sensor Chips === | === Detecting IPTG with Sensor Chips === | ||
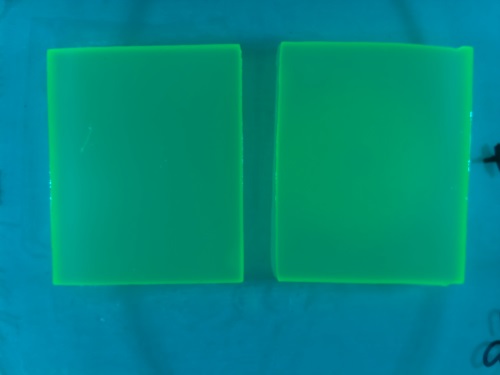
{{Team:Aachen/FigureFloat|Aachen_I746909_slower_reduced.gif|title=IPTG inducible superfolder GFP (I746909) in sensor chips|subtitle=IPTG inducible superfolder GFP (I746909) is induced with IPTG (2 µl, 100mM) on the right chip with a non induced chip on the left|width=480px}} | {{Team:Aachen/FigureFloat|Aachen_I746909_slower_reduced.gif|title=IPTG inducible superfolder GFP (I746909) in sensor chips|subtitle=IPTG inducible superfolder GFP (I746909) is induced with IPTG (2 µl, 100mM) on the right chip with a non induced chip on the left|width=480px}} | ||
| + | |||
| + | |||
| + | |||
This video shows the construct [http://parts.igem.org/Part:BBa_I746909 I746909] from the 2007 iGEM Team Cambridge. This BioBrick is a producer of superfolder GFP under the control of a T7 promoter. It was introduced into BL21(DE3) cells making the expression IPTG inducible through the T7 RNA Polymerase encoded in the genome of BL21(DE3) under the control of a lacI promoter. | This video shows the construct [http://parts.igem.org/Part:BBa_I746909 I746909] from the 2007 iGEM Team Cambridge. This BioBrick is a producer of superfolder GFP under the control of a T7 promoter. It was introduced into BL21(DE3) cells making the expression IPTG inducible through the T7 RNA Polymerase encoded in the genome of BL21(DE3) under the control of a lacI promoter. | ||
| Line 211: | Line 218: | ||
{{Team:Aachen/FigureFloatRight|Aachen_K131026_HSLdetection_slow.gif|title=Detection of 3-oxo-C{{sub|12}} HSL with K131026|subtitle=0.2 µL of 3-oxo-C{{sub|12}} HSL was placed in the middle of the chip and then incubated at 37 °C in WatsOn.|width=480px}} | {{Team:Aachen/FigureFloatRight|Aachen_K131026_HSLdetection_slow.gif|title=Detection of 3-oxo-C{{sub|12}} HSL with K131026|subtitle=0.2 µL of 3-oxo-C{{sub|12}} HSL was placed in the middle of the chip and then incubated at 37 °C in WatsOn.|width=480px}} | ||
| + | |||
| + | |||
The next step towards the final goal to detect ''Pseudomonas aeruginosa'' was to replicate the detection of 3-oxo-C{{sub|12}} HSL, which was established in the plate reader, in our own [https://2014.igem.org/Team:Aachen/Project/Measurement_Device ''WatsOn''] device. Therefore, we again used K131026 as our construct in ''E. coli'' BL21(DE3) cells and induced with 0.2 µL 3-oxo-C{{sub|12}} HSL with a concentration of 500 µg/mL. The right chip was induced and - as a negative control - the left chip was not induced. Pictures were taken every 4 min. | The next step towards the final goal to detect ''Pseudomonas aeruginosa'' was to replicate the detection of 3-oxo-C{{sub|12}} HSL, which was established in the plate reader, in our own [https://2014.igem.org/Team:Aachen/Project/Measurement_Device ''WatsOn''] device. Therefore, we again used K131026 as our construct in ''E. coli'' BL21(DE3) cells and induced with 0.2 µL 3-oxo-C{{sub|12}} HSL with a concentration of 500 µg/mL. The right chip was induced and - as a negative control - the left chip was not induced. Pictures were taken every 4 min. | ||
Revision as of 14:35, 17 October 2014
|
|
|
|
|
|
 "
"
