Team:Aachen/Project/Measurement Device
From 2014.igem.org
(→Hardware) |
(→Measurarty) |
||
| Line 104: | Line 104: | ||
<span class="anchor" id="watsonmeasurarty"></span> | <span class="anchor" id="watsonmeasurarty"></span> | ||
<center> | <center> | ||
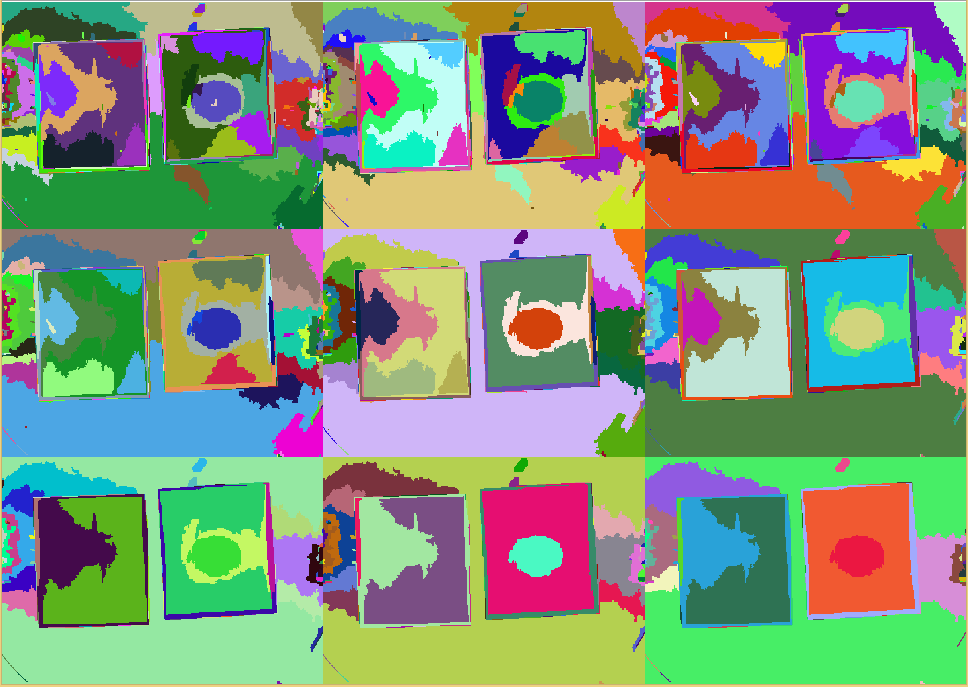
| - | {{Team:Aachen/Figure|Aachen_srm_regions_3.PNG|title=SRM | + | {{Team:Aachen/Figure|Aachen_srm_regions_3.PNG|title=SRM component of our image analysis component ''Measurarty''|subtitle=SRM is one of the core components of our image analysis approach. This image shows the different regions created.|width=500px}} |
</center> | </center> | ||
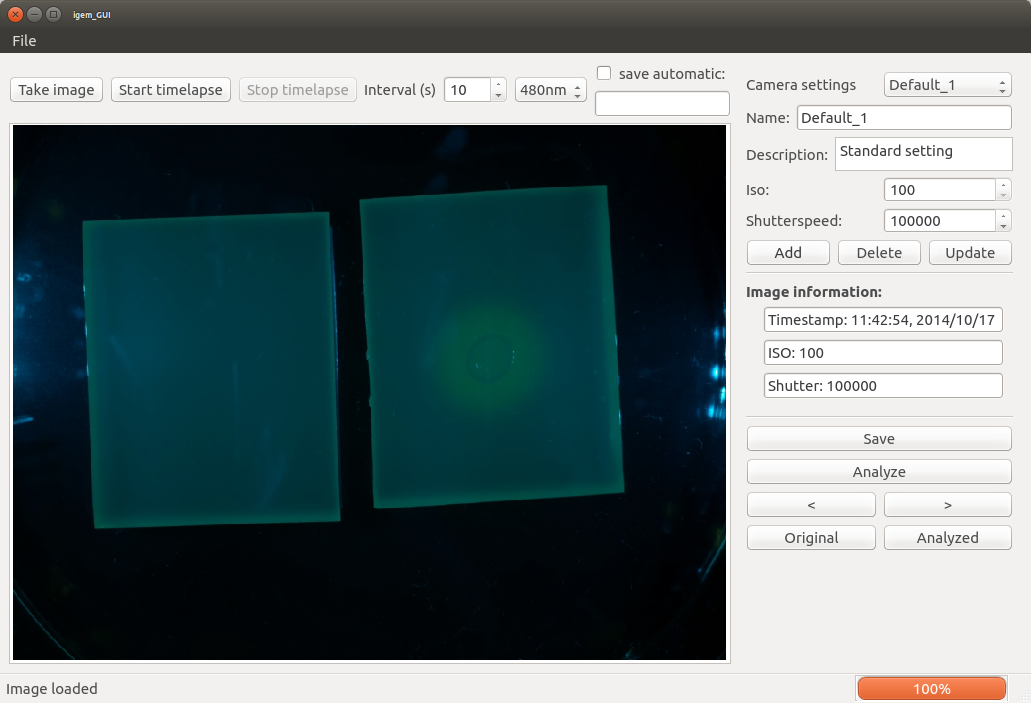
| - | Measurarty is the | + | Measurarty is the '''image analysis software''' of our device and is designed to allow an automatic segmentation and classification of our '''agar chip pictures'''. |
| - | Therefore it expects as input an image from WatsOn, and | + | Therefore, it expects as input an image from WatsOn, and produces an output image with pathogenic regions marked in red. |
| - | This | + | This component mainly focuses on recognizing pathogens early, such that pure thresholding is not necessary. |
We therefore designed a pipeline and established a smoothness index to make statements about the pathogenity of a chip as early as possible, but also with as much certainty as possible. | We therefore designed a pipeline and established a smoothness index to make statements about the pathogenity of a chip as early as possible, but also with as much certainty as possible. | ||
| - | A sample segmentation is presented below | + | A sample output of the segmentation is presented below, showing that the pipeline works as intended. |
* hier arne's gif | * hier arne's gif | ||
Revision as of 13:42, 17 October 2014
|
|
|
|
|
|
 "
"
