Team:Aachen/Notebook/Software/Measurarty
From 2014.igem.org
(→Automatic Classification) |
(→Classification) |
||
| Line 192: | Line 192: | ||
== Classification == | == Classification == | ||
<span class="anchor" id="classification"></span> | <span class="anchor" id="classification"></span> | ||
| + | |||
| + | === Smoothness Index === | ||
| + | |||
| + | For position prediction in virtual environments, jitter or noise in the output signal is not wanted though often present. | ||
| + | Since discovering smooth areas is a similar problem to jitter detection, a simple method for determining jitter can be used to measure non-jitter, smoothness (Joppich, Rausch and Kuhlen, 2013). | ||
| + | It is assumed that jitter-free areas of a position signal do not differ in velocity. | ||
| + | |||
| + | Smooth areas do not differ in intensity, and therefore only low changes in velocity (intensity change) can be recorded. | ||
| + | For the reduction of noise, this operation is performed on the smoothed input image. | ||
| + | Then the smoothness $s$ of a pixel $p$ in its k-neighbourhood $\mathcal{N}_k$ can be determined as: | ||
| + | \begin{equation} | ||
| + | s(p) = \sum\limits_{p' \in \mathcal{N}_k} \nabla(p') / \arg\max\limits_{p} s(p) | ||
| + | \end{equation} | ||
| + | |||
| + | Using thresholding, $TS_l \leq s(p) \leq TS_u \wedge TI_l \leq I \leq TI_u$, different areas, such as background or pathogen, can be selected. | ||
| + | |||
| + | For the empirical choice of thresholds, it can be argued that these are tailored to the specific case. | ||
| + | While this surely is true to a certain extent, the here presented method has been successfully tested on images from a completely different domain, and no changes to the thresholds have been made to make it work. | ||
| + | A proper theoretical evaluation is emphasized, however, is probably not the aim of the iGEM competition. | ||
| + | |||
| + | Finally, selecting for the red region, this delivers the location of possible pathogens. | ||
| + | Since the size of the agar chips is variable but fixed a quantitative analysis can be performed by counting pixels for instance. | ||
| + | |||
| + | === Empirical Evaluation === | ||
| + | |||
| + | Using our MATLAB code we found the lower threshold for the smoothness index to be $TS_l = 0.85$ and the upper threshold $TS_u = \infty$. | ||
| + | Similarly, for $TI_l = 235$ and $TI_u = \infty$. | ||
| + | |||
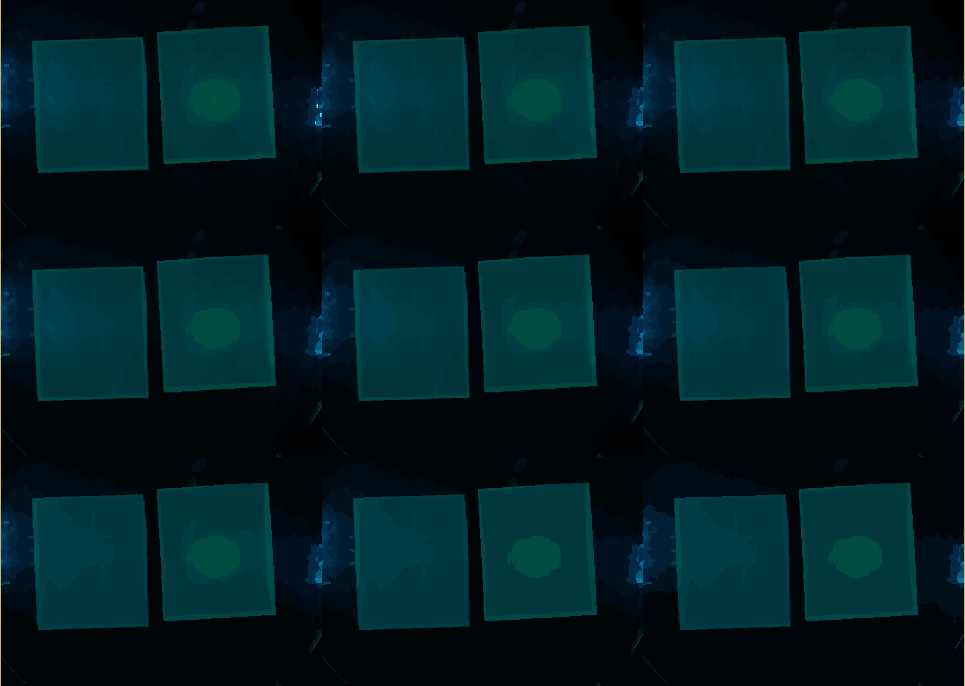
| + | Using these settings, we can find a response already in images taken after 42 minutes. | ||
| + | |||
| + | Ideally, one would rate the quality of the image segmentation using some ground truth, such as manual delineations. This still has to be done for our method. | ||
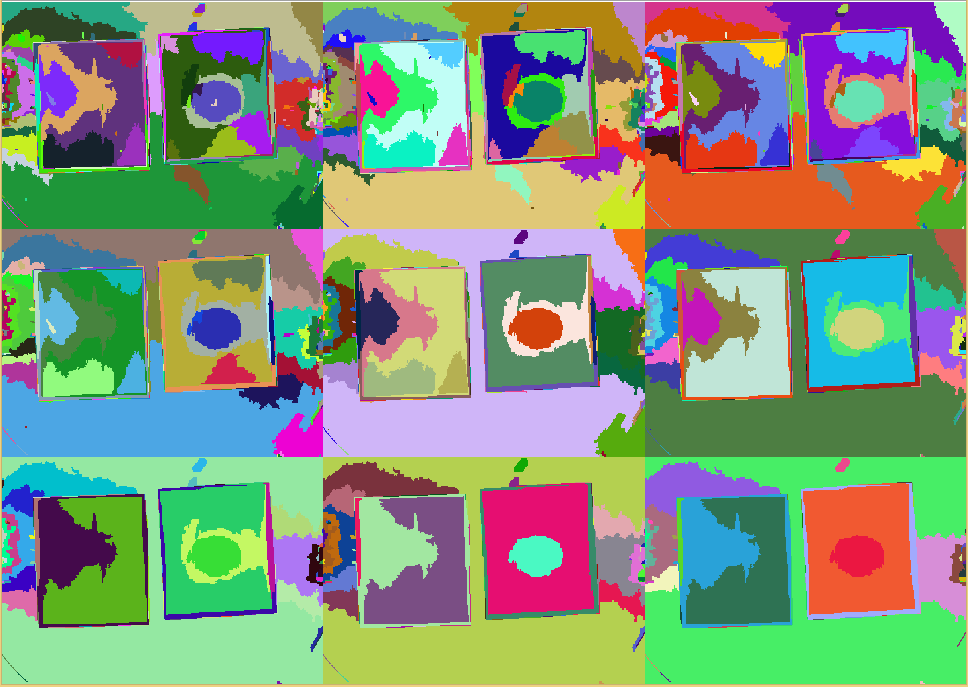
| + | However, from visual observations, our method is showing promising results. | ||
| + | |||
| + | * image of smoothness index | ||
=== Automatic Classification === | === Automatic Classification === | ||
| Line 238: | Line 272: | ||
</div> | </div> | ||
</html> | </html> | ||
| - | |||
| - | |||
| - | |||
| - | |||
| - | |||
| - | |||
| - | |||
| - | |||
| - | |||
| - | |||
| - | |||
| - | |||
| - | |||
| - | |||
| - | |||
| - | |||
| - | |||
| - | |||
| - | |||
| - | |||
| - | |||
| - | |||
| - | |||
| - | |||
| - | |||
| - | |||
| - | |||
| - | |||
| - | |||
| - | |||
| - | |||
| - | |||
| - | |||
| - | |||
{{Team:Aachen/BlockSeparator}} | {{Team:Aachen/BlockSeparator}} | ||
Revision as of 10:35, 17 October 2014
|
|
|
|
|
|
|
 "
"
