Team:Aachen/Notebook/Engineering/ODF
From 2014.igem.org
| Line 122: | Line 122: | ||
= OD device = | = OD device = | ||
<span class="anchor" id="od"></span> | <span class="anchor" id="od"></span> | ||
| - | == | + | == Evaluation == |
| - | + | ||
| - | + | ||
| - | + | ||
| - | + | ||
| - | + | ||
| - | + | ||
| - | + | ||
| - | + | ||
| - | == From Transmittance to True Optical Density == | + | === From Transmittance to True Optical Density === |
At very low levels, uncorrected photometric determinations of cell densities show a decreasing proportionaility to actual cell density. | At very low levels, uncorrected photometric determinations of cell densities show a decreasing proportionaility to actual cell density. | ||
| Line 165: | Line 157: | ||
[1] Correction for the Inherent Error in Optical Density Readings, Lawrence, J.V. and Maier, S., Applied and Environmental Microbiology, 1977, p. 482-484 | [1] Correction for the Inherent Error in Optical Density Readings, Lawrence, J.V. and Maier, S., Applied and Environmental Microbiology, 1977, p. 482-484 | ||
| - | == | + | === Experiments === |
We performed several experiments during the development of the OD/F device. | We performed several experiments during the development of the OD/F device. | ||
| Line 179: | Line 171: | ||
where $f$ transforms transforms transmittance to true optical density for our device, and $g$ transforms true optical density of our device into the true optical density of the photospectrometer. This way our device is calibrated according to the photospectrometer. | where $f$ transforms transforms transmittance to true optical density for our device, and $g$ transforms true optical density of our device into the true optical density of the photospectrometer. This way our device is calibrated according to the photospectrometer. | ||
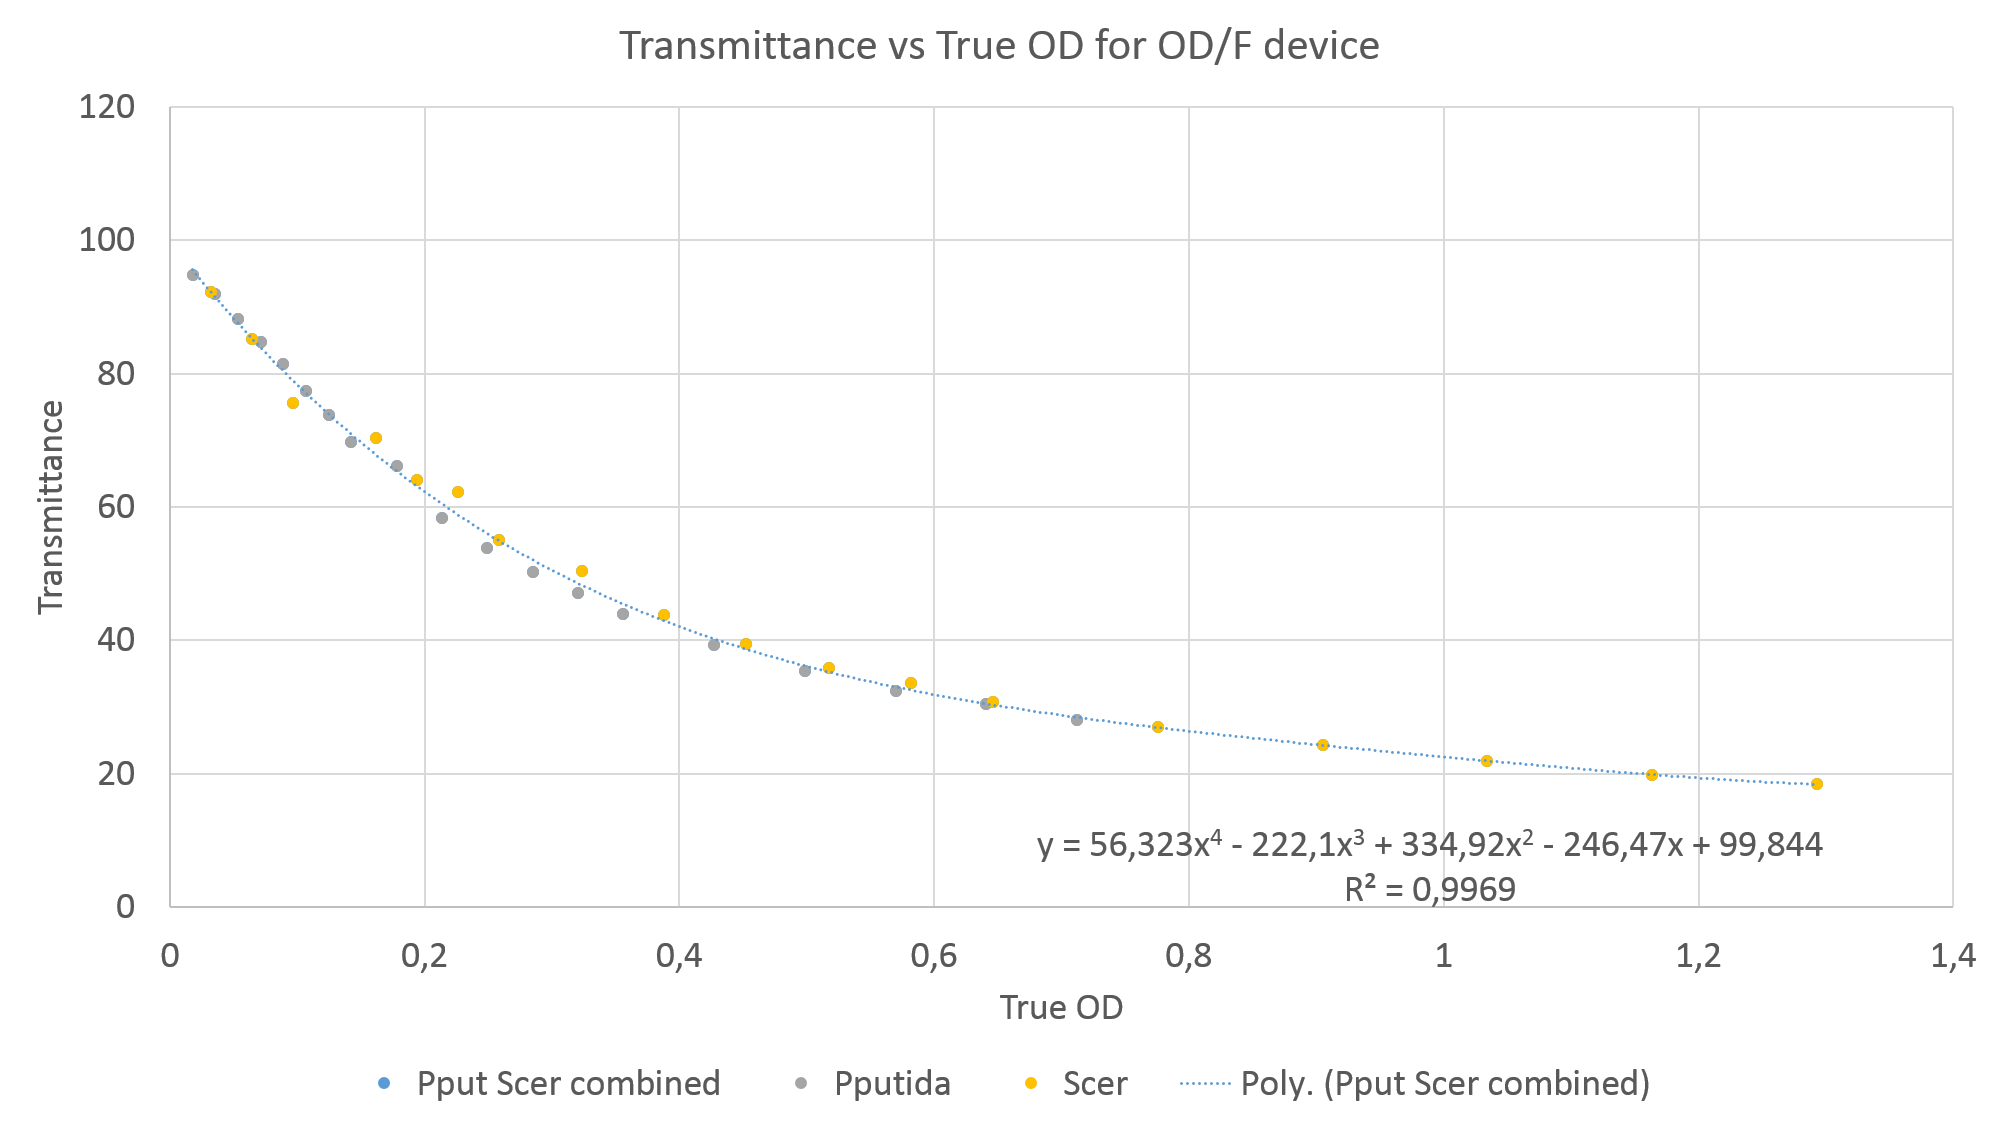
| - | === Pseudomonas putida === | + | ==== ''Pseudomonas putida'' ==== |
<center> | <center> | ||
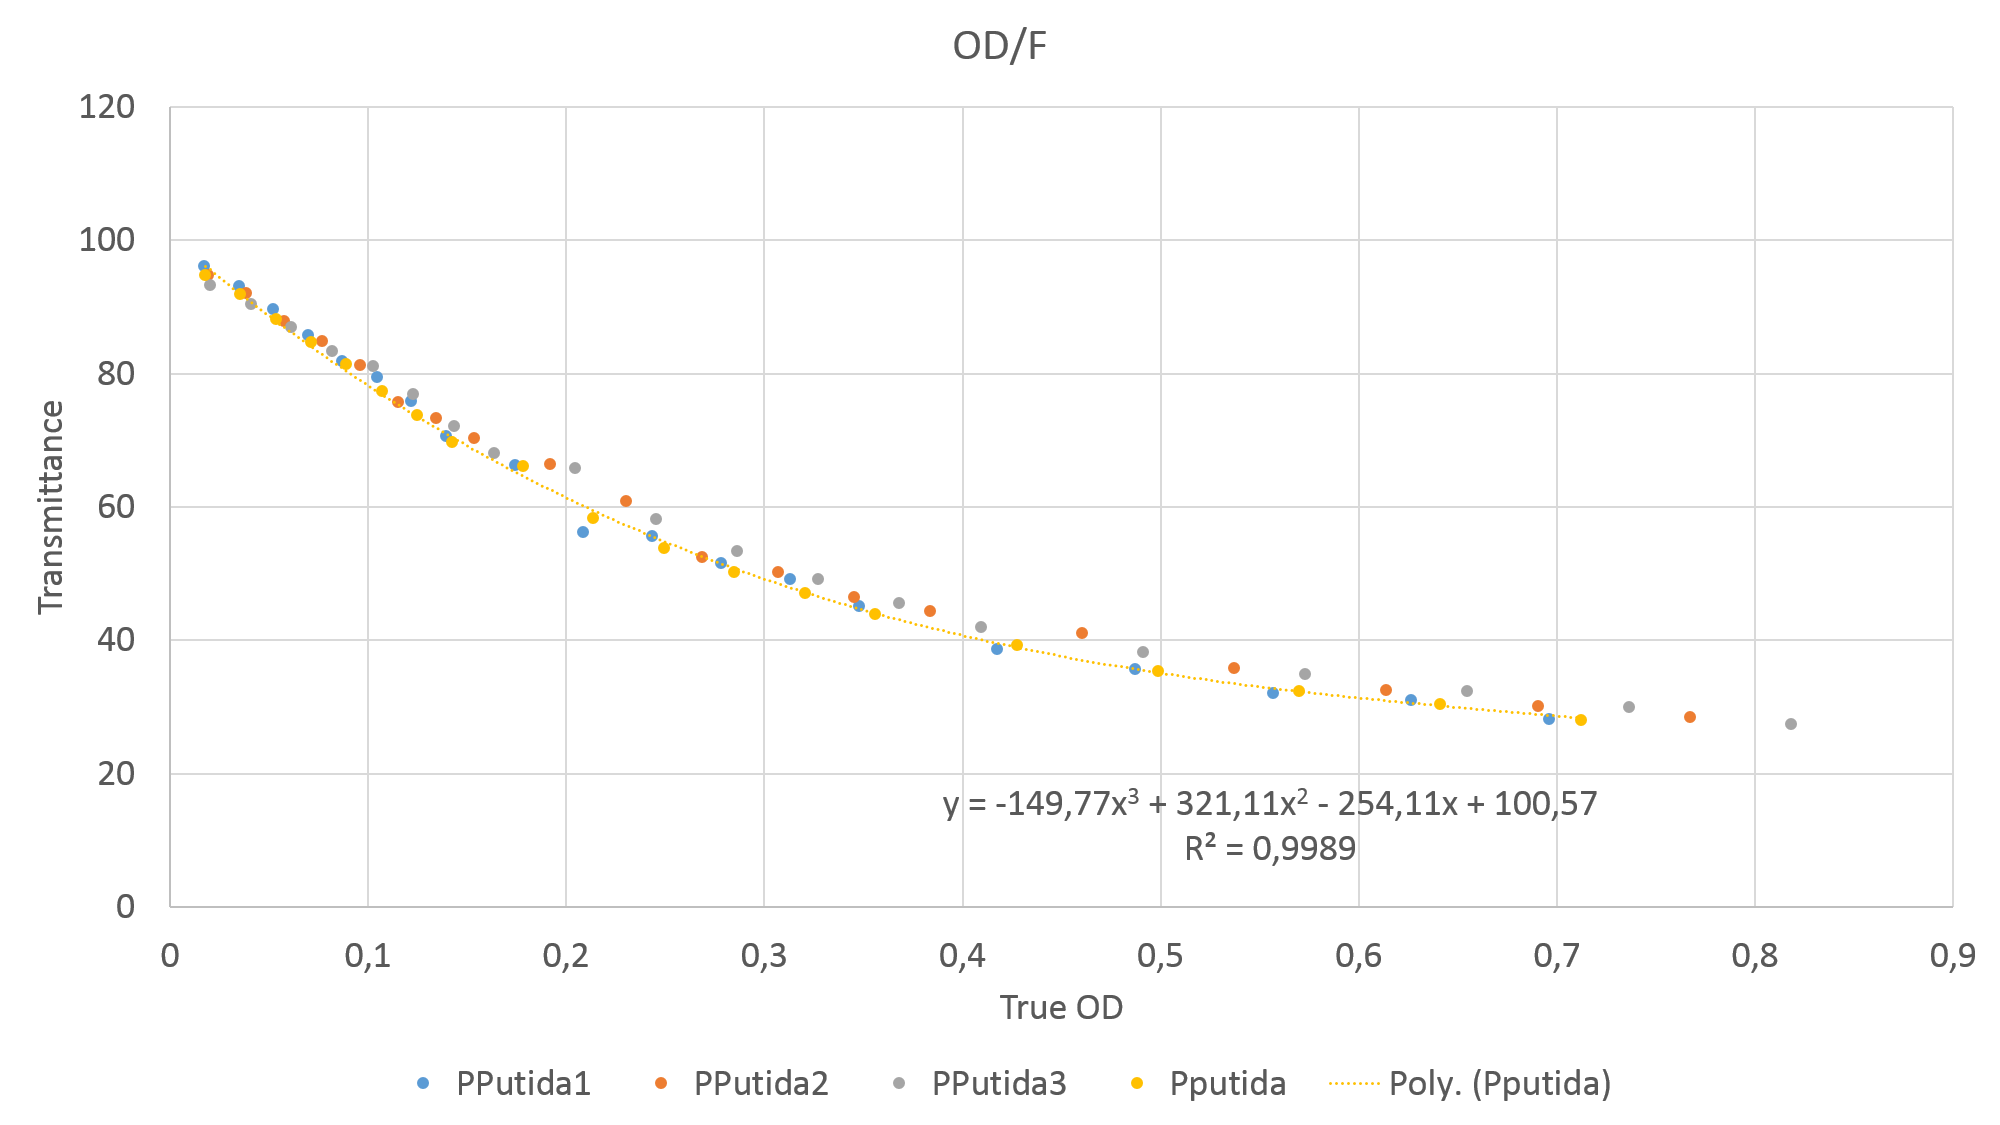
| - | {{Team:Aachen/Figure|align=center|Aachen_PPut_T_TOD.png|title=True Optical Density to Transmittance plot for P. putida|subtitle=|width= | + | {{Team:Aachen/Figure|align=center|Aachen_PPut_T_TOD.png|title=True Optical Density to Transmittance plot for P. putida|subtitle=|width=700px}} |
</center> | </center> | ||
<center> | <center> | ||
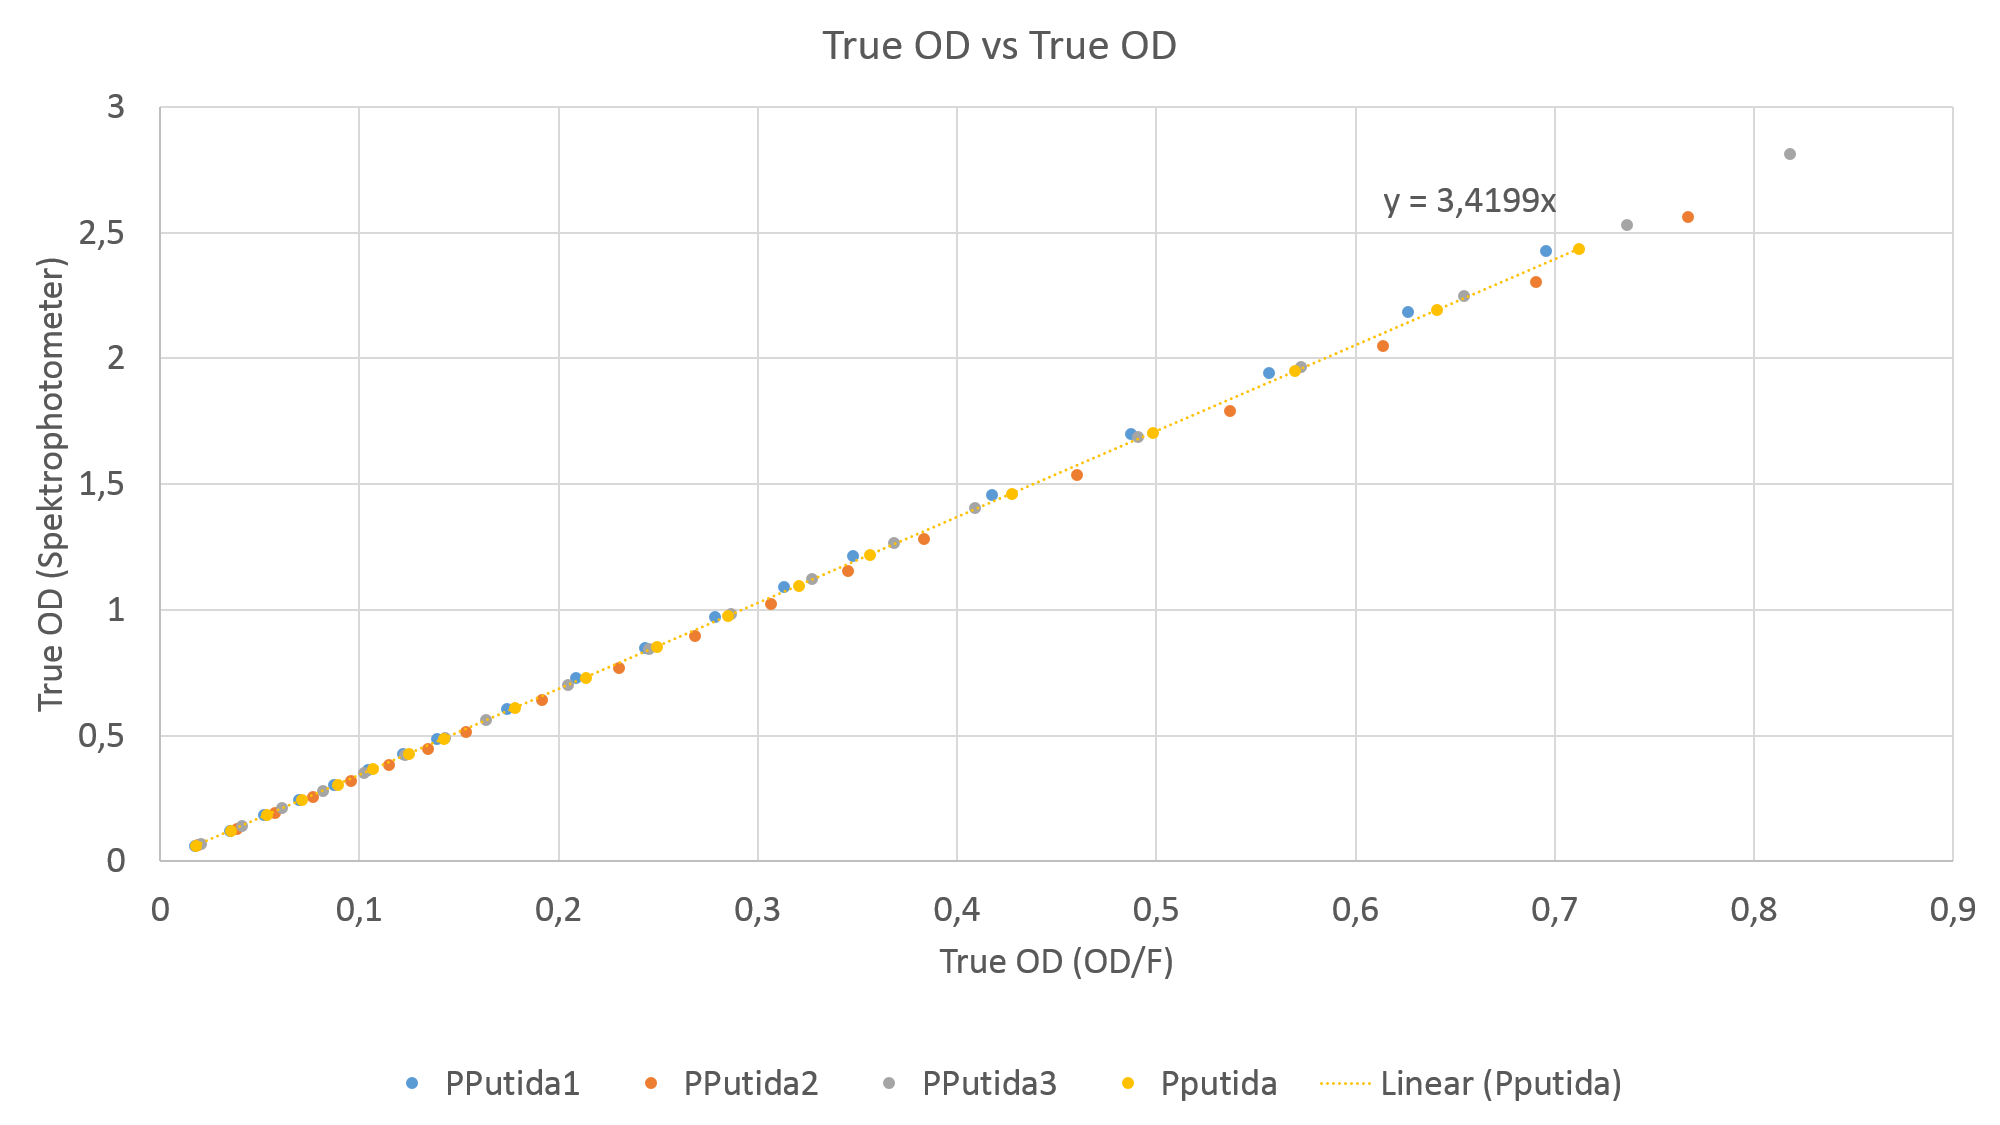
| - | {{Team:Aachen/Figure|align=center|Aachen_PPut_TOD_TOD.png|title=Corrolating the true optical density of the OD/F device to true optical density of the photospectrometer|subtitle=|width= | + | {{Team:Aachen/Figure|align=center|Aachen_PPut_TOD_TOD.png|title=Corrolating the true optical density of the OD/F device to true optical density of the photospectrometer|subtitle=|width=700px}} |
</center> | </center> | ||
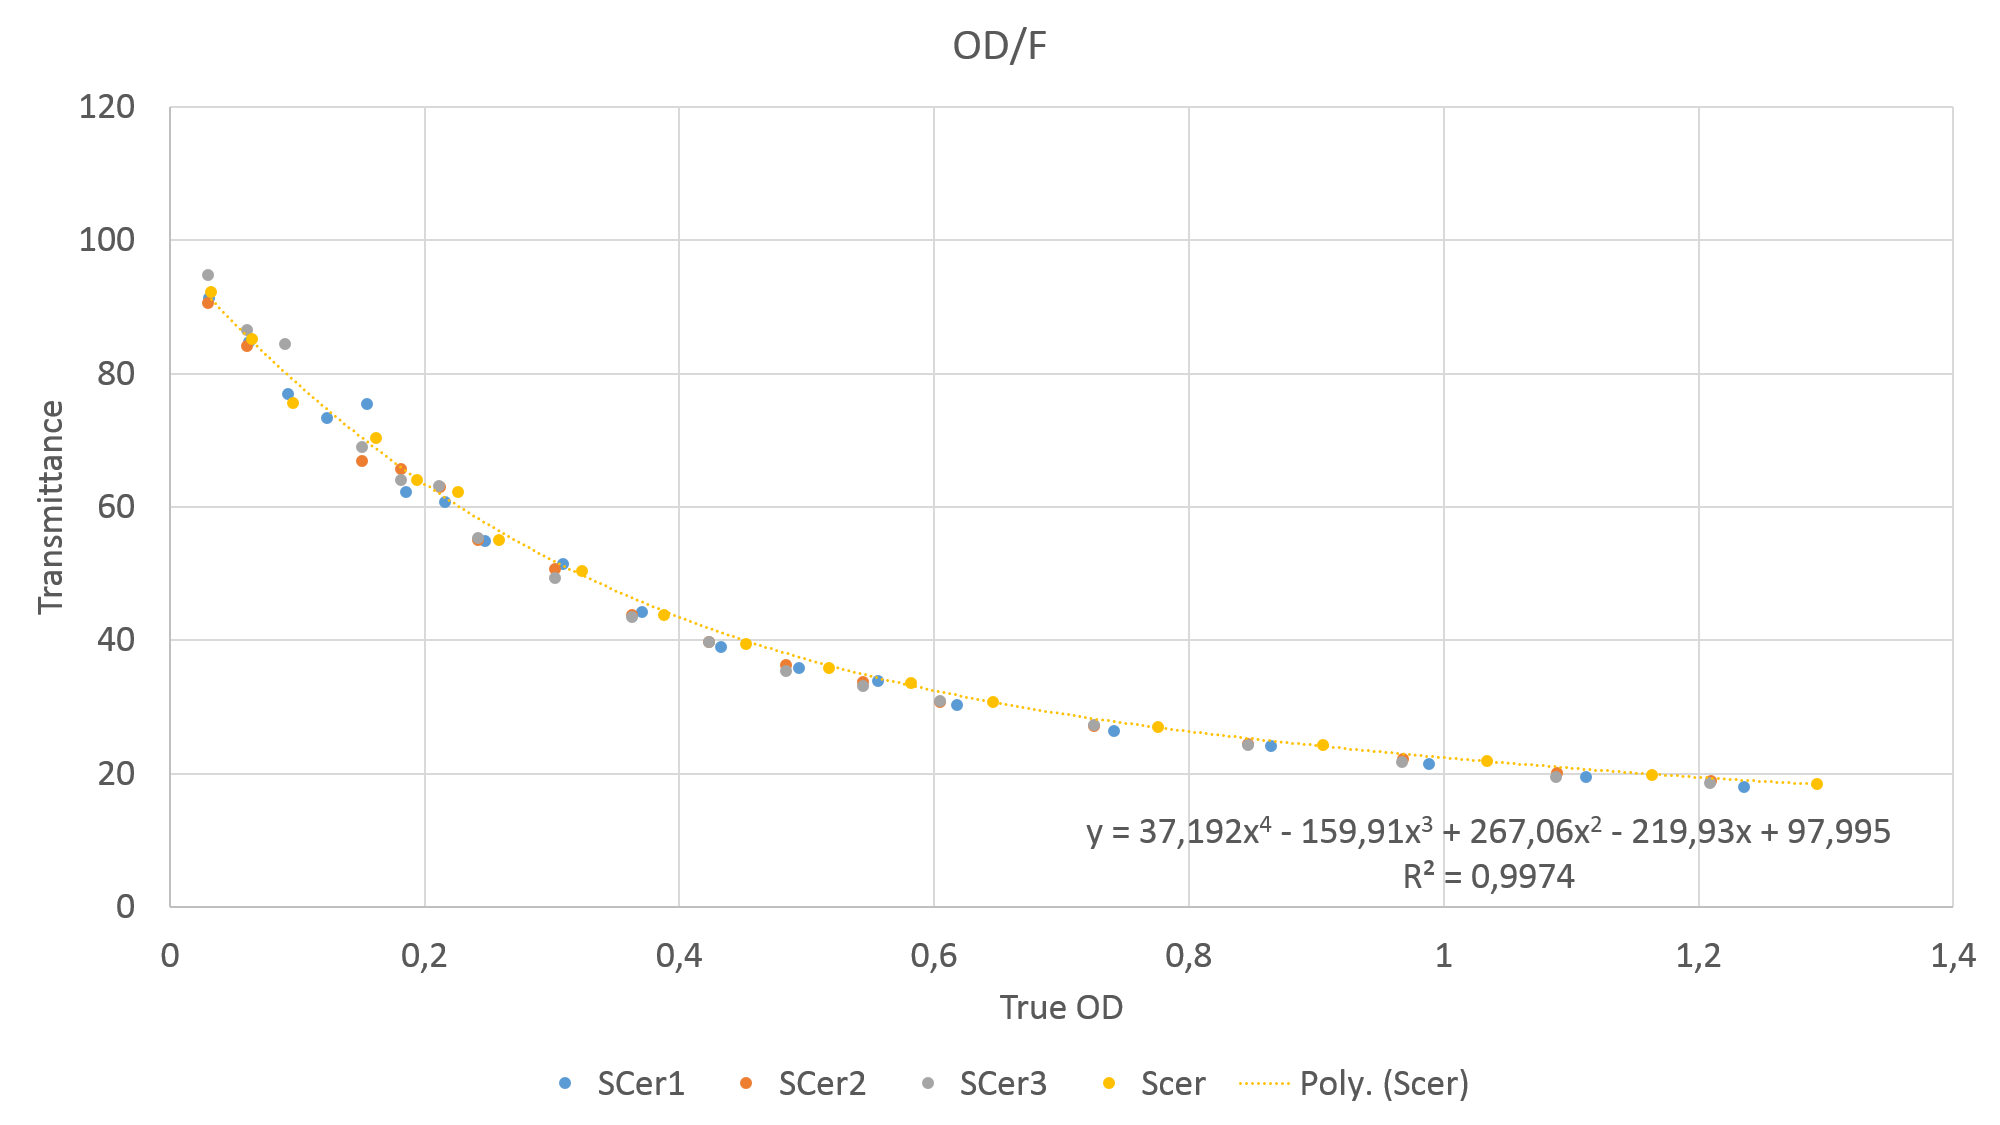
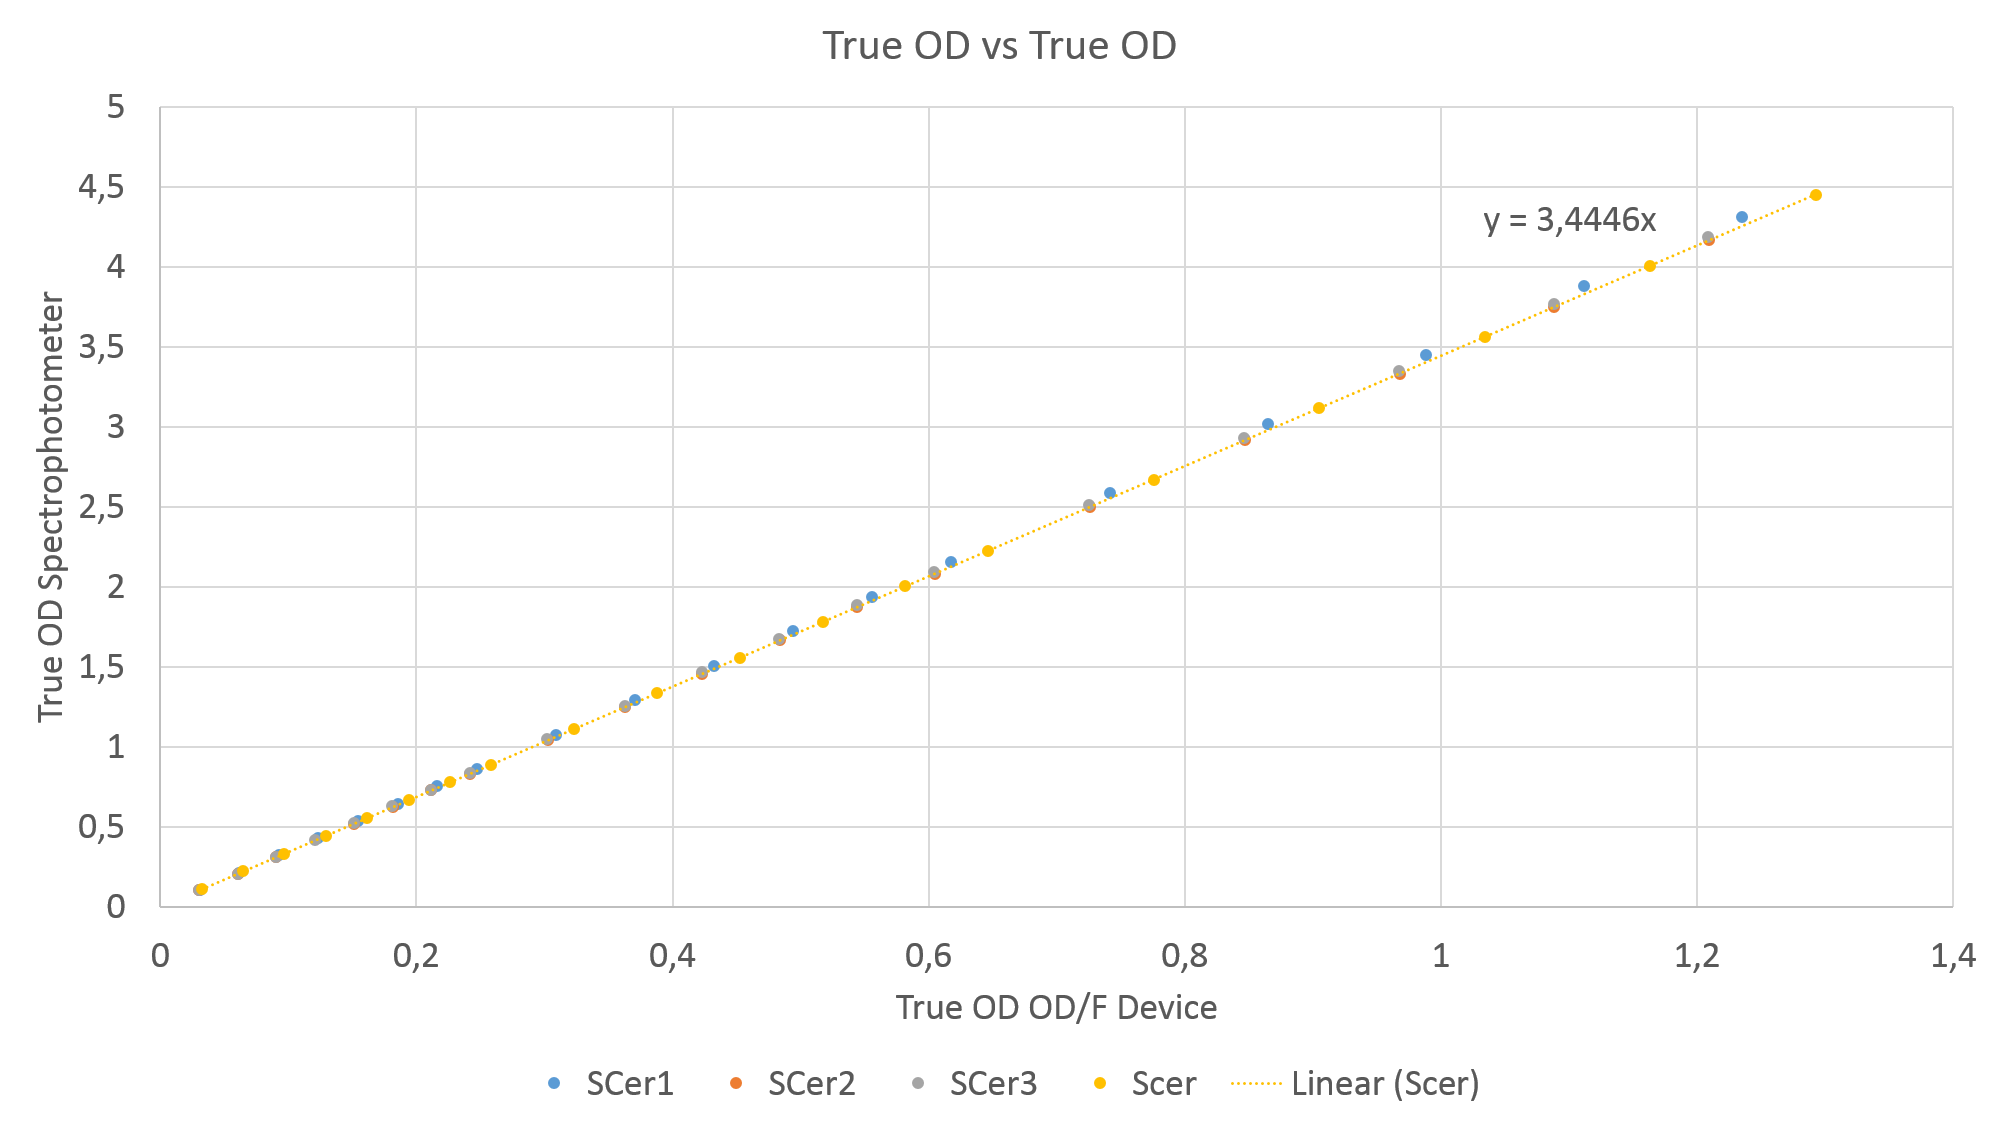
| - | === Saccharomyces cerevisiae === | + | ==== ''Saccharomyces cerevisiae'' ==== |
<center> | <center> | ||
| - | {{Team:Aachen/Figure|align=center|Aachen_SCer_T_TOD.png|title=True Optical Density to Transmittance plot for S. cerivisiae|subtitle=|width= | + | {{Team:Aachen/Figure|align=center|Aachen_SCer_T_TOD.png|title=True Optical Density to Transmittance plot for S. cerivisiae|subtitle=|width=700px}} |
</center> | </center> | ||
<center> | <center> | ||
| - | {{Team:Aachen/Figure|align=center|Aachen_SCer_TOD_TOD.png|title=Corrolating the true optical density of the OD/F device to true optical density of the photospectrometer|subtitle=|width= | + | {{Team:Aachen/Figure|align=center|Aachen_SCer_TOD_TOD.png|title=Corrolating the true optical density of the OD/F device to true optical density of the photospectrometer|subtitle=|width=700px}} |
</center> | </center> | ||
| Line 201: | Line 193: | ||
Also the function from transmittance to true od can be expressed as a lower polynomial function, making its calculation easily possible on a low-end device like a microcontroller. | Also the function from transmittance to true od can be expressed as a lower polynomial function, making its calculation easily possible on a low-end device like a microcontroller. | ||
| - | Most encouraging is that the function for relating the true OD of our device to the photospectrometer is, as seen by the regression coefficient, close together for both P. putida and S. cerivisae. In fact, 3.4199 and 3.4446 are such close together, that the minor deviation could be just measuring inaccuracy. | + | Most encouraging is that the function for relating the true OD of our device to the photospectrometer is, as seen by the regression coefficient, close together for both ''P. putida'' and ''S. cerivisae''. In fact, 3.4199 and 3.4446 are such close together, that the minor deviation could be just measuring inaccuracy. |
Therefore we fix the regression coefficient for converting true OD of our device to true OD of the photospectrometer to 3.432 . | Therefore we fix the regression coefficient for converting true OD of our device to true OD of the photospectrometer to 3.432 . | ||
| Line 213: | Line 205: | ||
Therefore we present a device which measures accurately and is made of easily available parts at a low cost. | Therefore we present a device which measures accurately and is made of easily available parts at a low cost. | ||
| - | |||
| - | |||
| - | |||
| - | |||
| - | |||
| - | |||
| - | |||
| - | |||
| - | |||
{{Team:Aachen/BlockSeparator}} | {{Team:Aachen/BlockSeparator}} | ||
| Line 255: | Line 238: | ||
<center> | <center> | ||
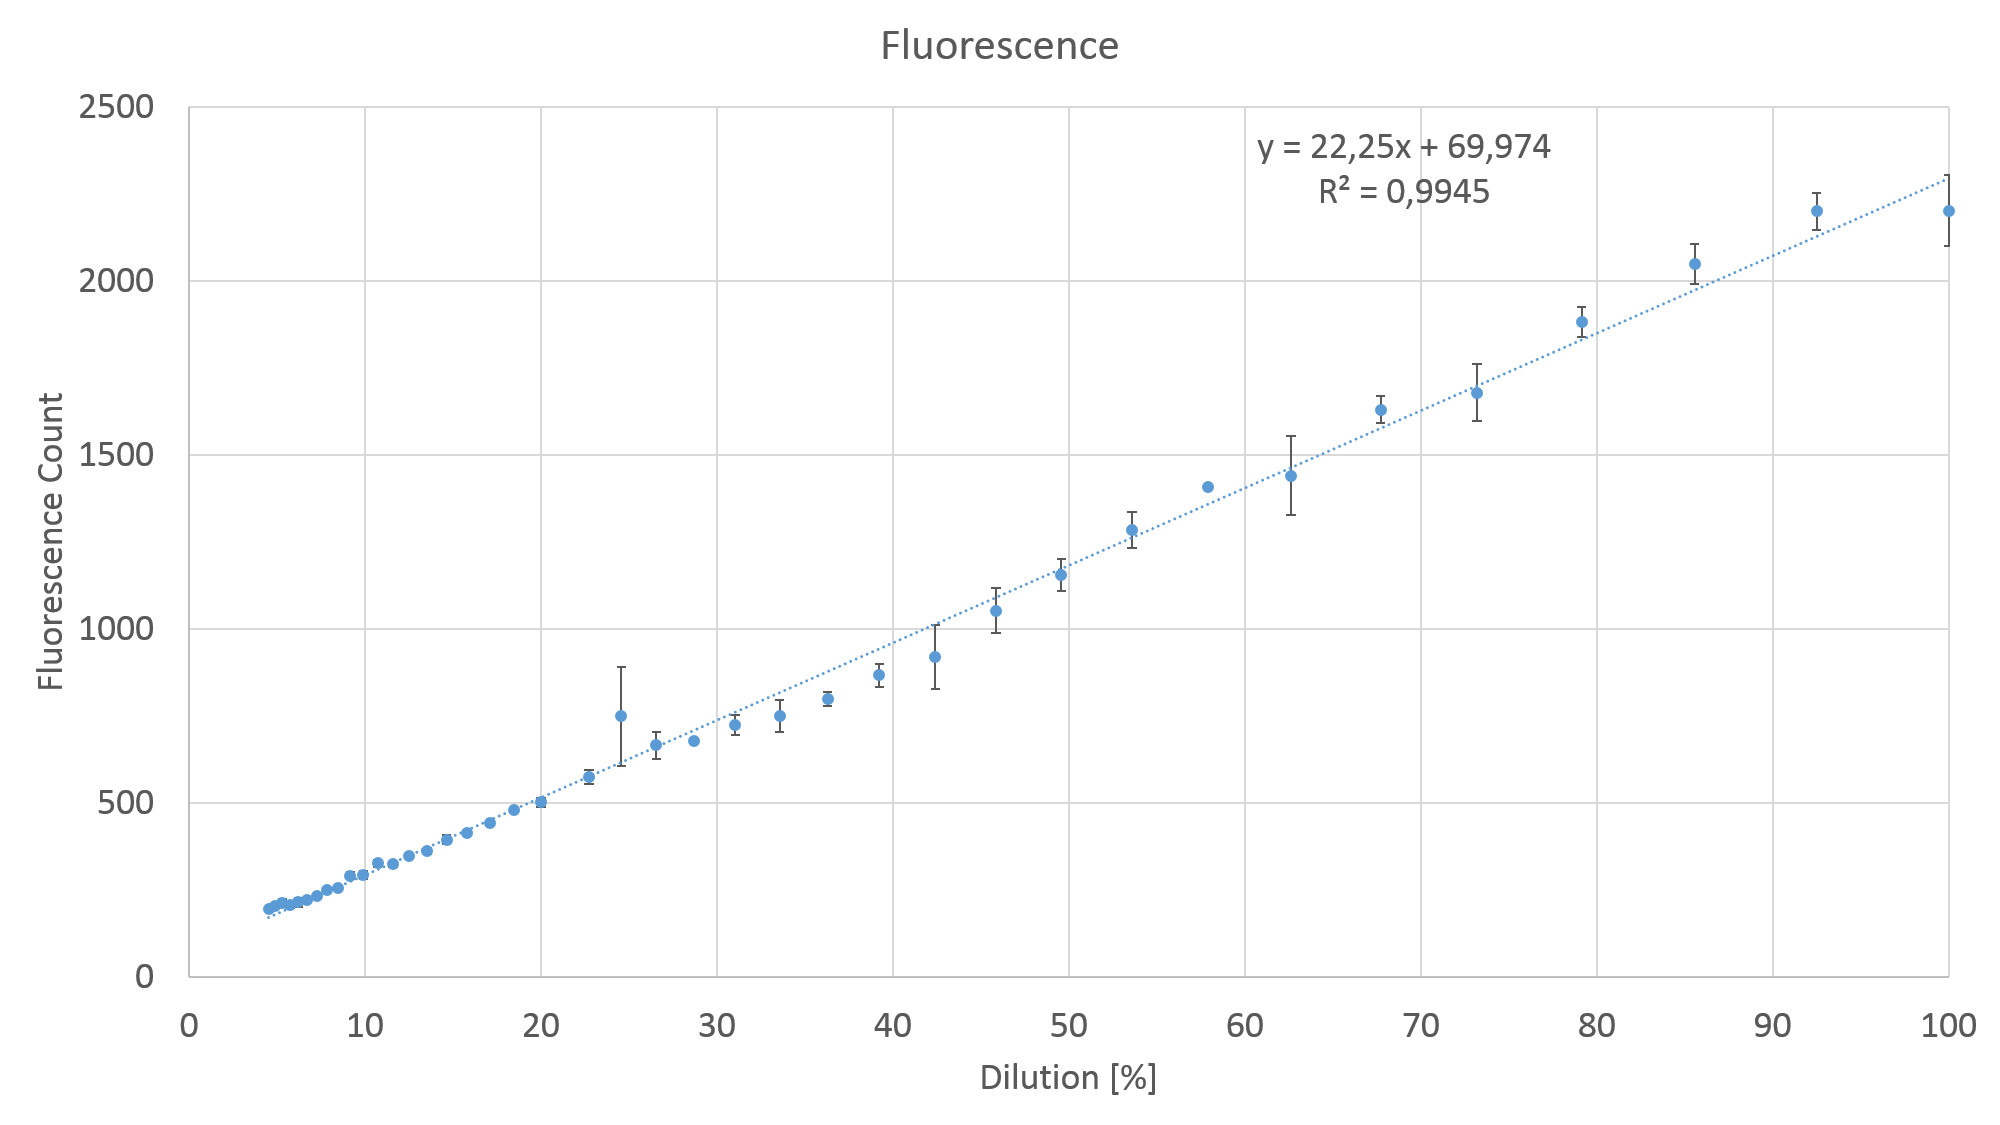
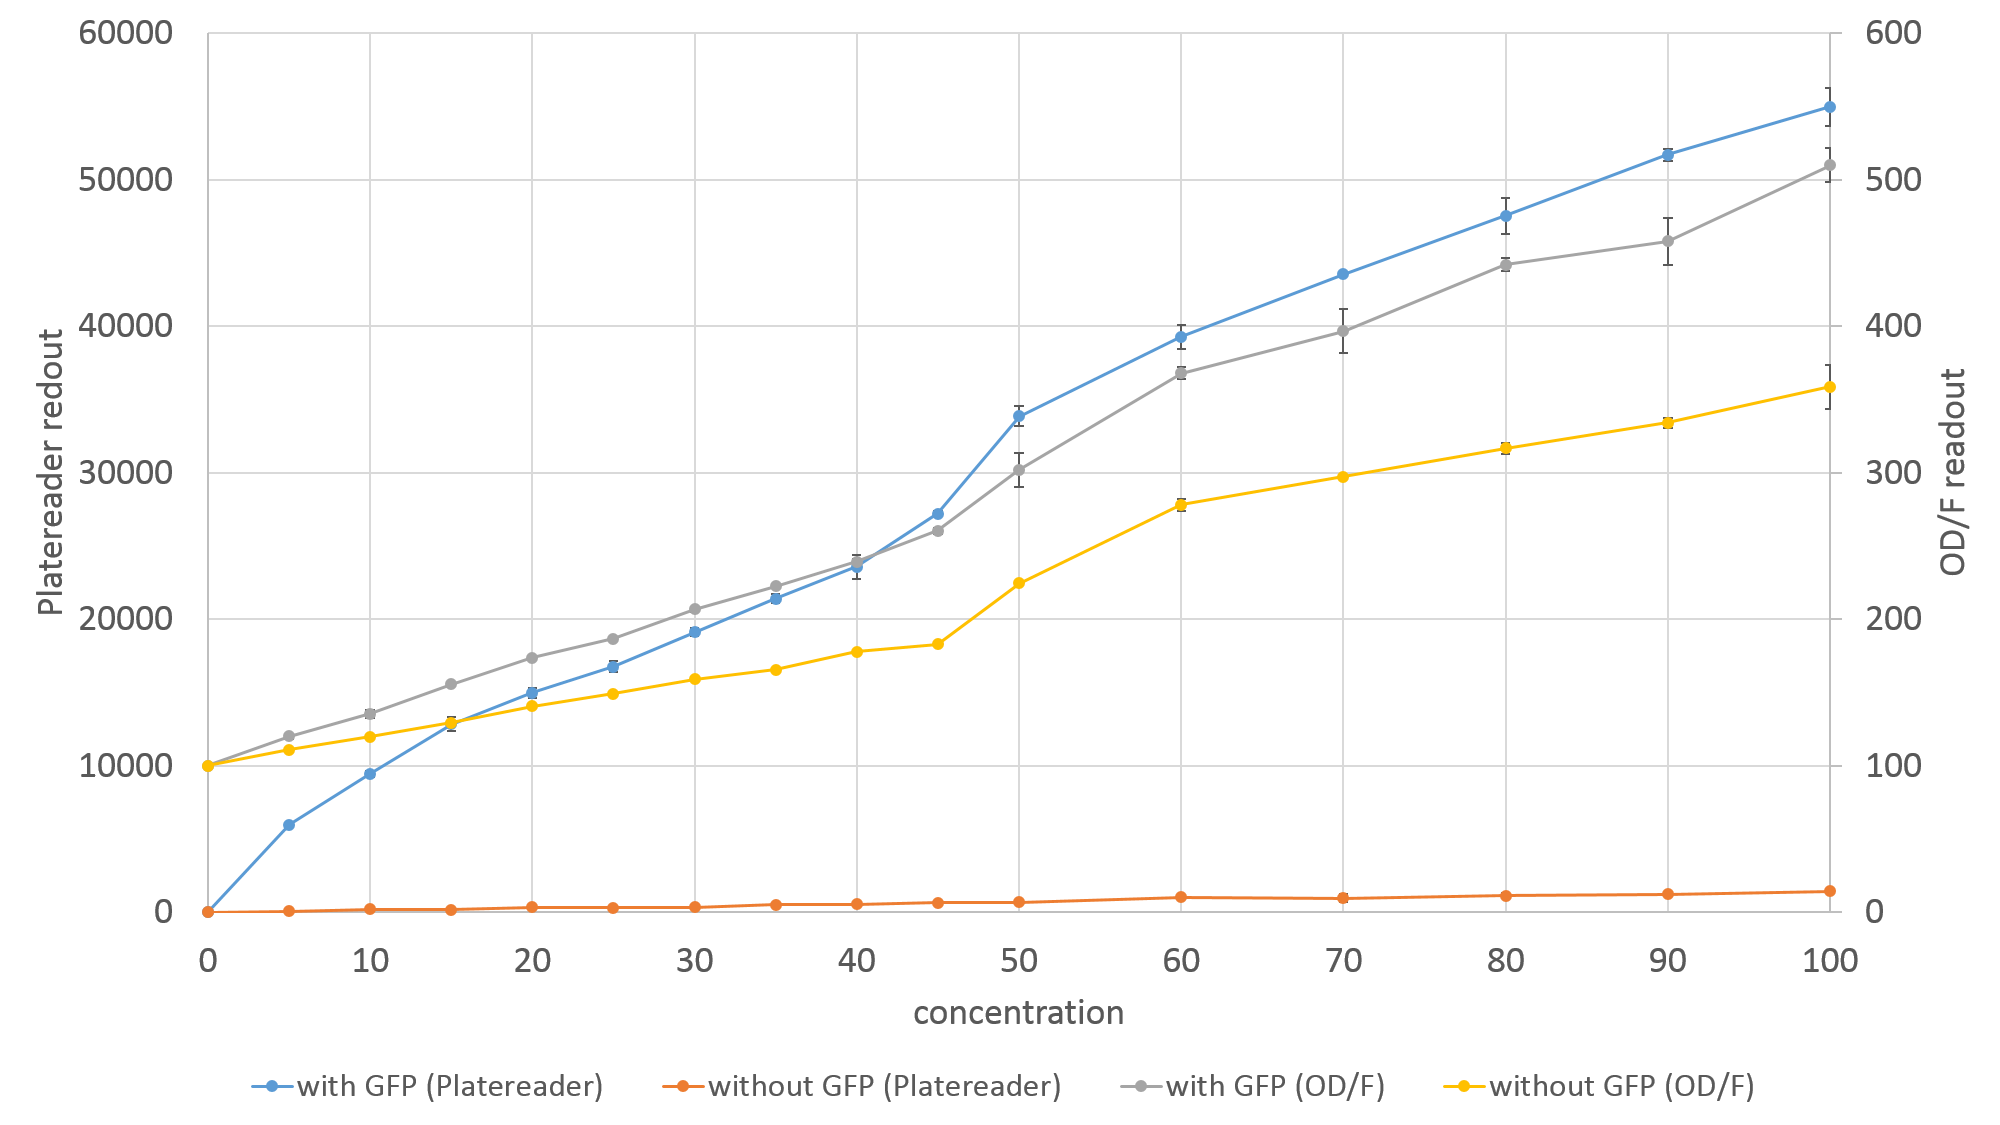
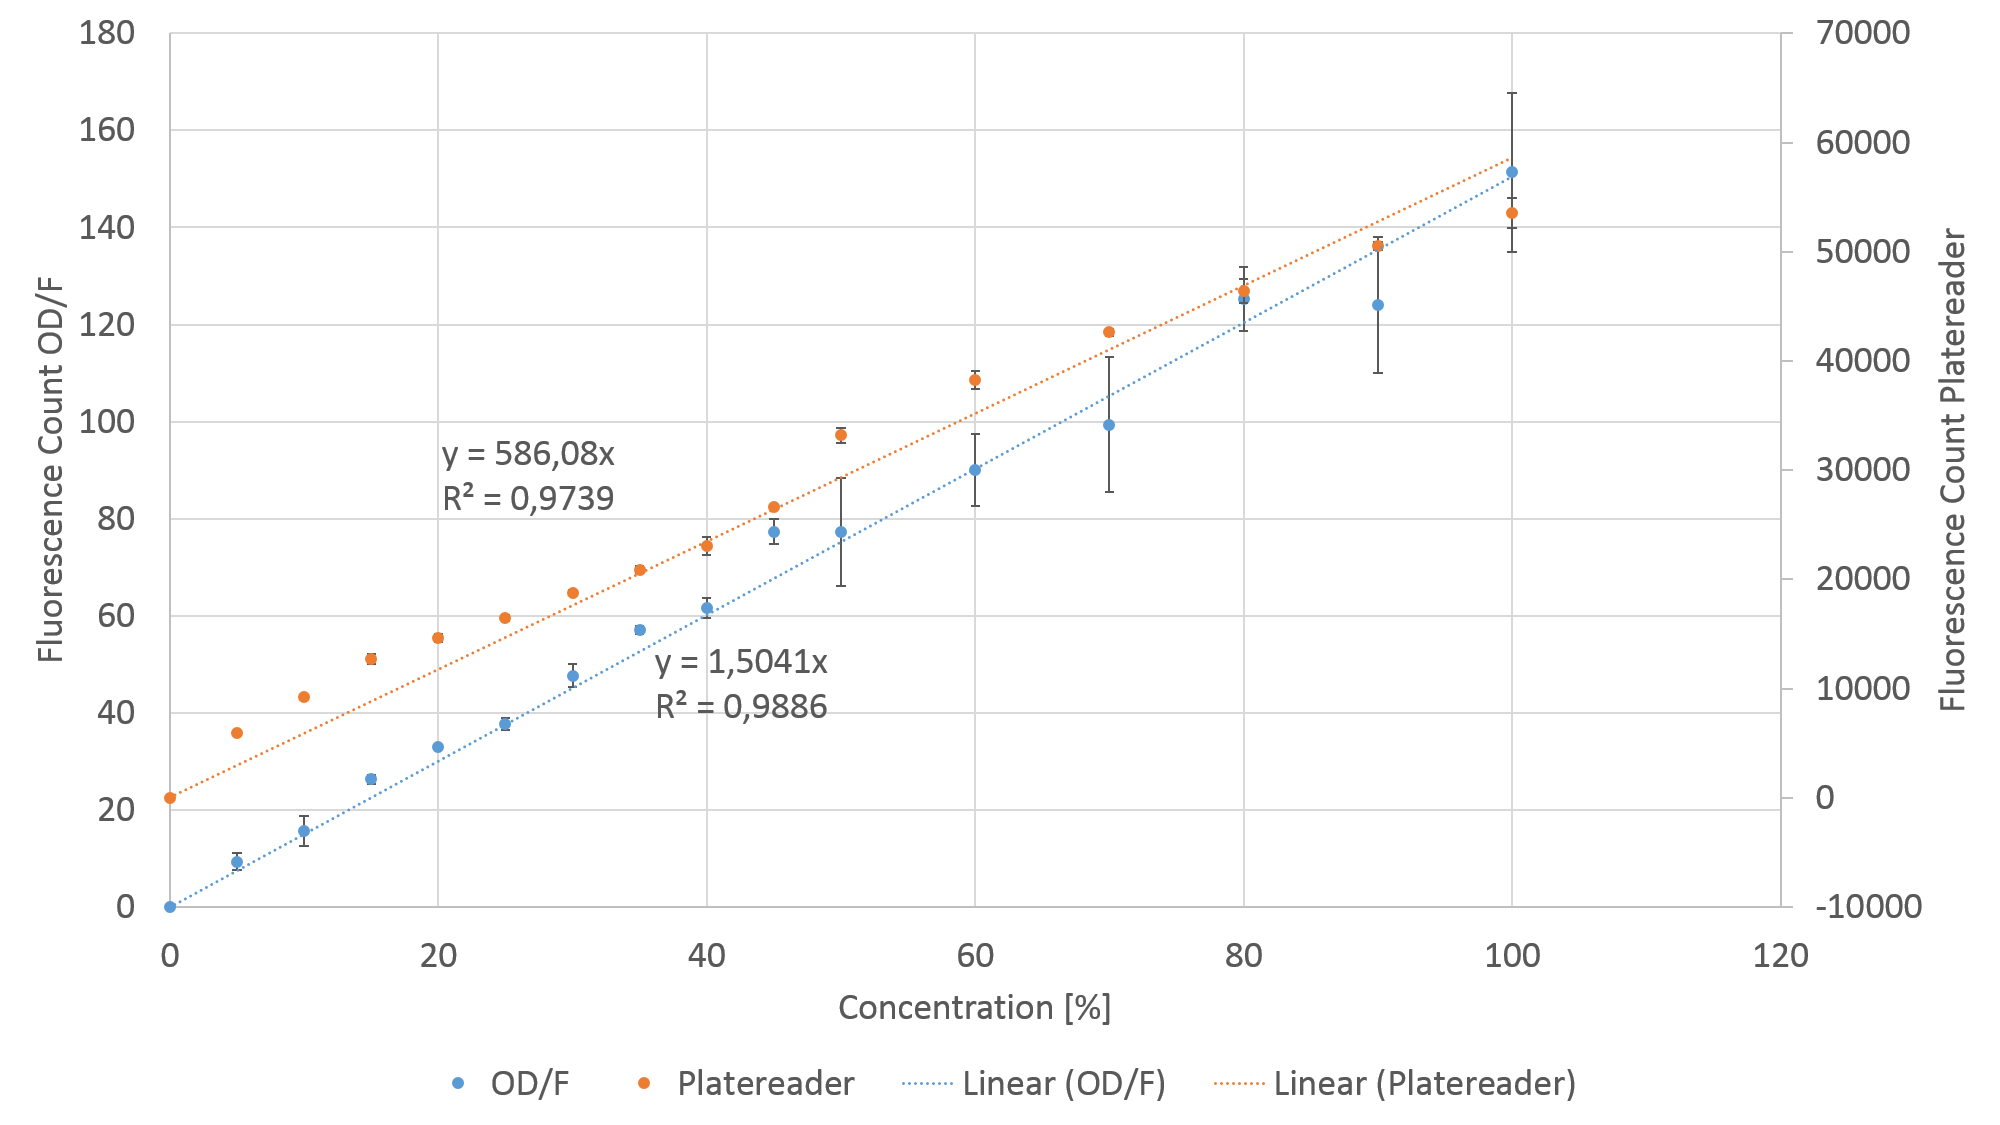
| - | {{Team:Aachen/Figure|align=center|Aachen_Fluoro_GFP_PODF_rel.png|title=Fluorescence Measurement comparison OD/F device and Platereader|subtitle=Comparison of a fluorescence measurement of our device and the platereader. Our OD/F device shows no significant. A non-GFP expressing E. coli dilution has been used to normalize the GFP dilution series. A linear correlation can be seen.|width= | + | {{Team:Aachen/Figure|align=center|Aachen_Fluoro_GFP_PODF_rel.png|title=Fluorescence Measurement comparison OD/F device and Platereader|subtitle=Comparison of a fluorescence measurement of our device and the platereader. Our OD/F device shows no significant. A non-GFP expressing E. coli dilution has been used to normalize the GFP dilution series. A linear correlation can be seen.|width=700px}} |
</center> | </center> | ||
| - | |||
| - | |||
| - | |||
| - | |||
| - | |||
| - | |||
| - | |||
| - | |||
{{Team:Aachen/BlockSeparator}} | {{Team:Aachen/BlockSeparator}} | ||
| Line 320: | Line 295: | ||
{{Team:Aachen/BlockSeparator}} | {{Team:Aachen/BlockSeparator}} | ||
| - | = | + | = DIY: Build Your Own Device = |
| + | |||
| + | == Technical Components == | ||
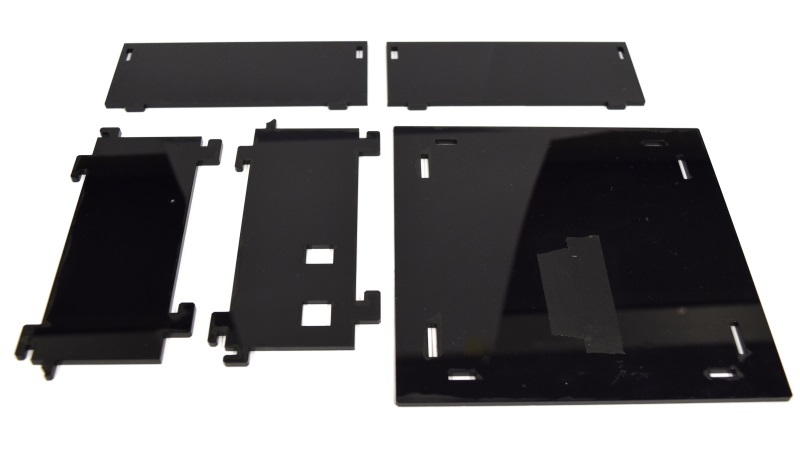
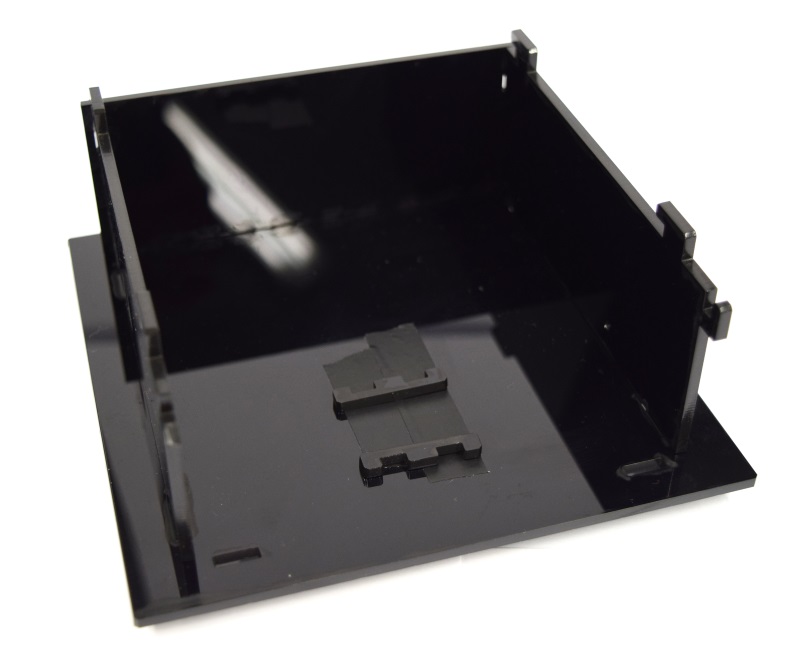
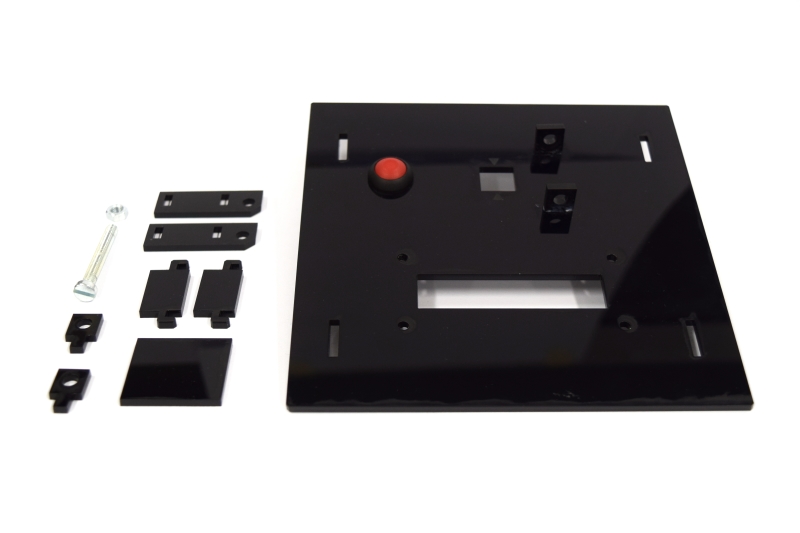
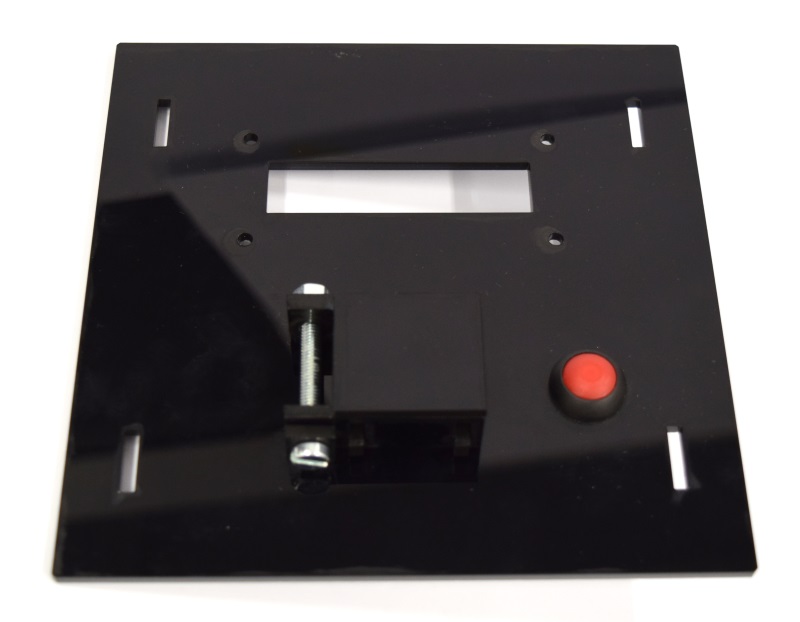
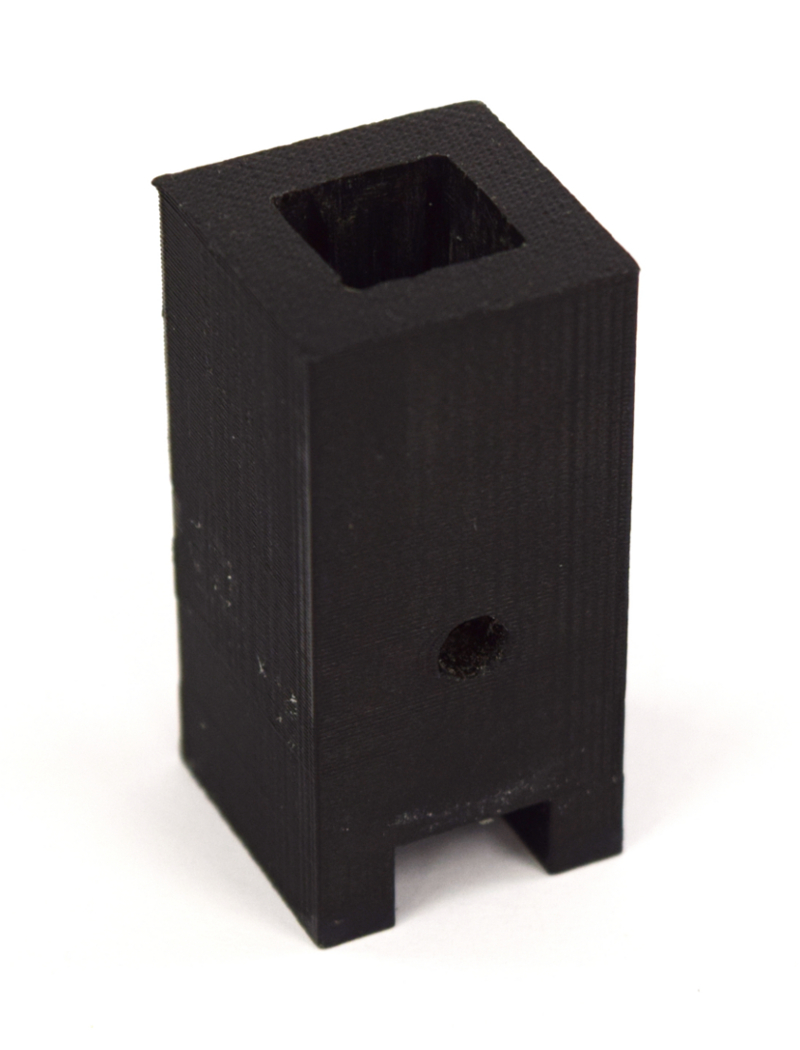
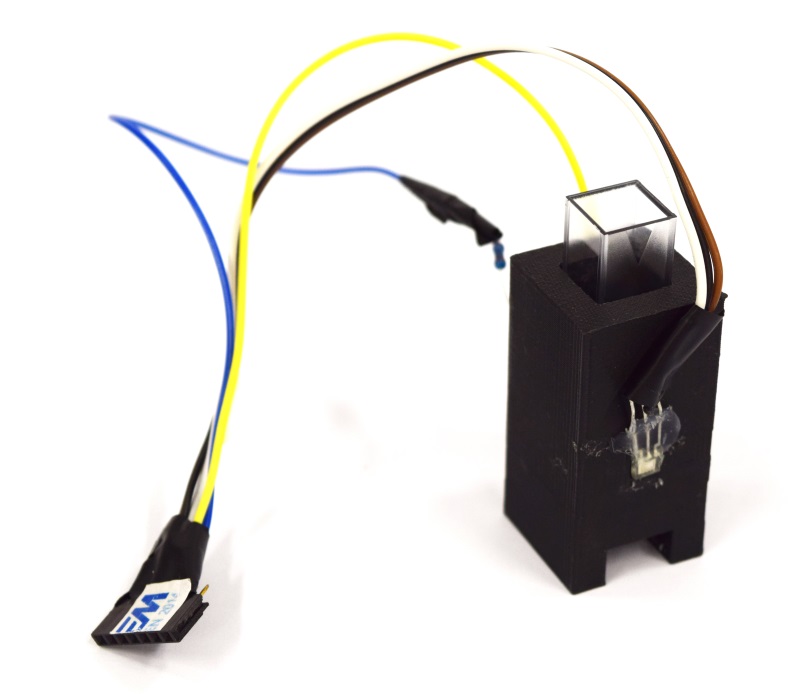
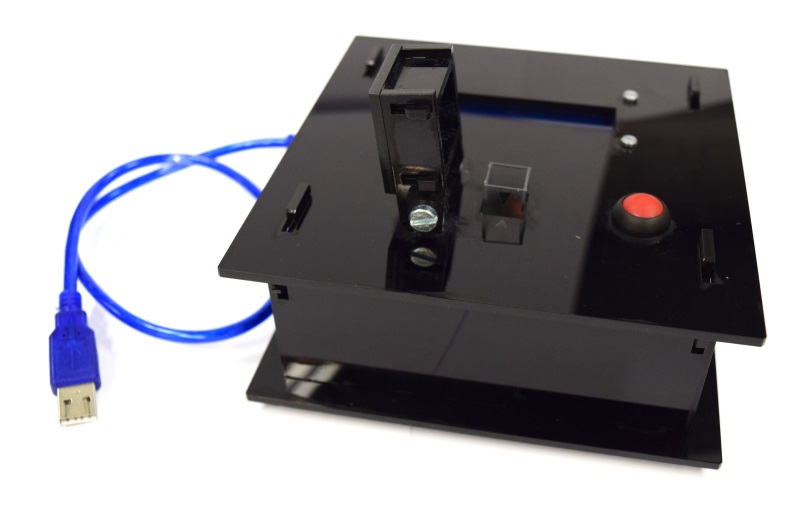
While the casing and the cuvette holder are custom made, most of the parts are pre-made and only need to be bought. The previous section [https://2014.igem.org/Team:Aachen/Notebook/Engineering/ODF#parts Used Parts] lists all needed parts. | While the casing and the cuvette holder are custom made, most of the parts are pre-made and only need to be bought. The previous section [https://2014.igem.org/Team:Aachen/Notebook/Engineering/ODF#parts Used Parts] lists all needed parts. | ||
| Line 334: | Line 311: | ||
You will need a special [http://www.exp-tech.de/images/product_images/description%20images/YWRobot/1602/LiquidCrystal_I2C1602V2.rar library] for the display, which can not be uploaded for legal reasons. | You will need a special [http://www.exp-tech.de/images/product_images/description%20images/YWRobot/1602/LiquidCrystal_I2C1602V2.rar library] for the display, which can not be uploaded for legal reasons. | ||
| - | == | + | |
| + | <html> | ||
| + | <sup><span class="anchor" id="fn2"></span>1. iGEM really does not make it easy to distribute anything different than default image files!<a href="#ref2" title="">↩</a></sup> | ||
| + | </html> | ||
{| class="wikitable centered" | {| class="wikitable centered" | ||
| Line 363: | Line 343: | ||
|} | |} | ||
| - | + | == Breadboards == | |
| - | + | ||
| - | + | ||
| - | + | ||
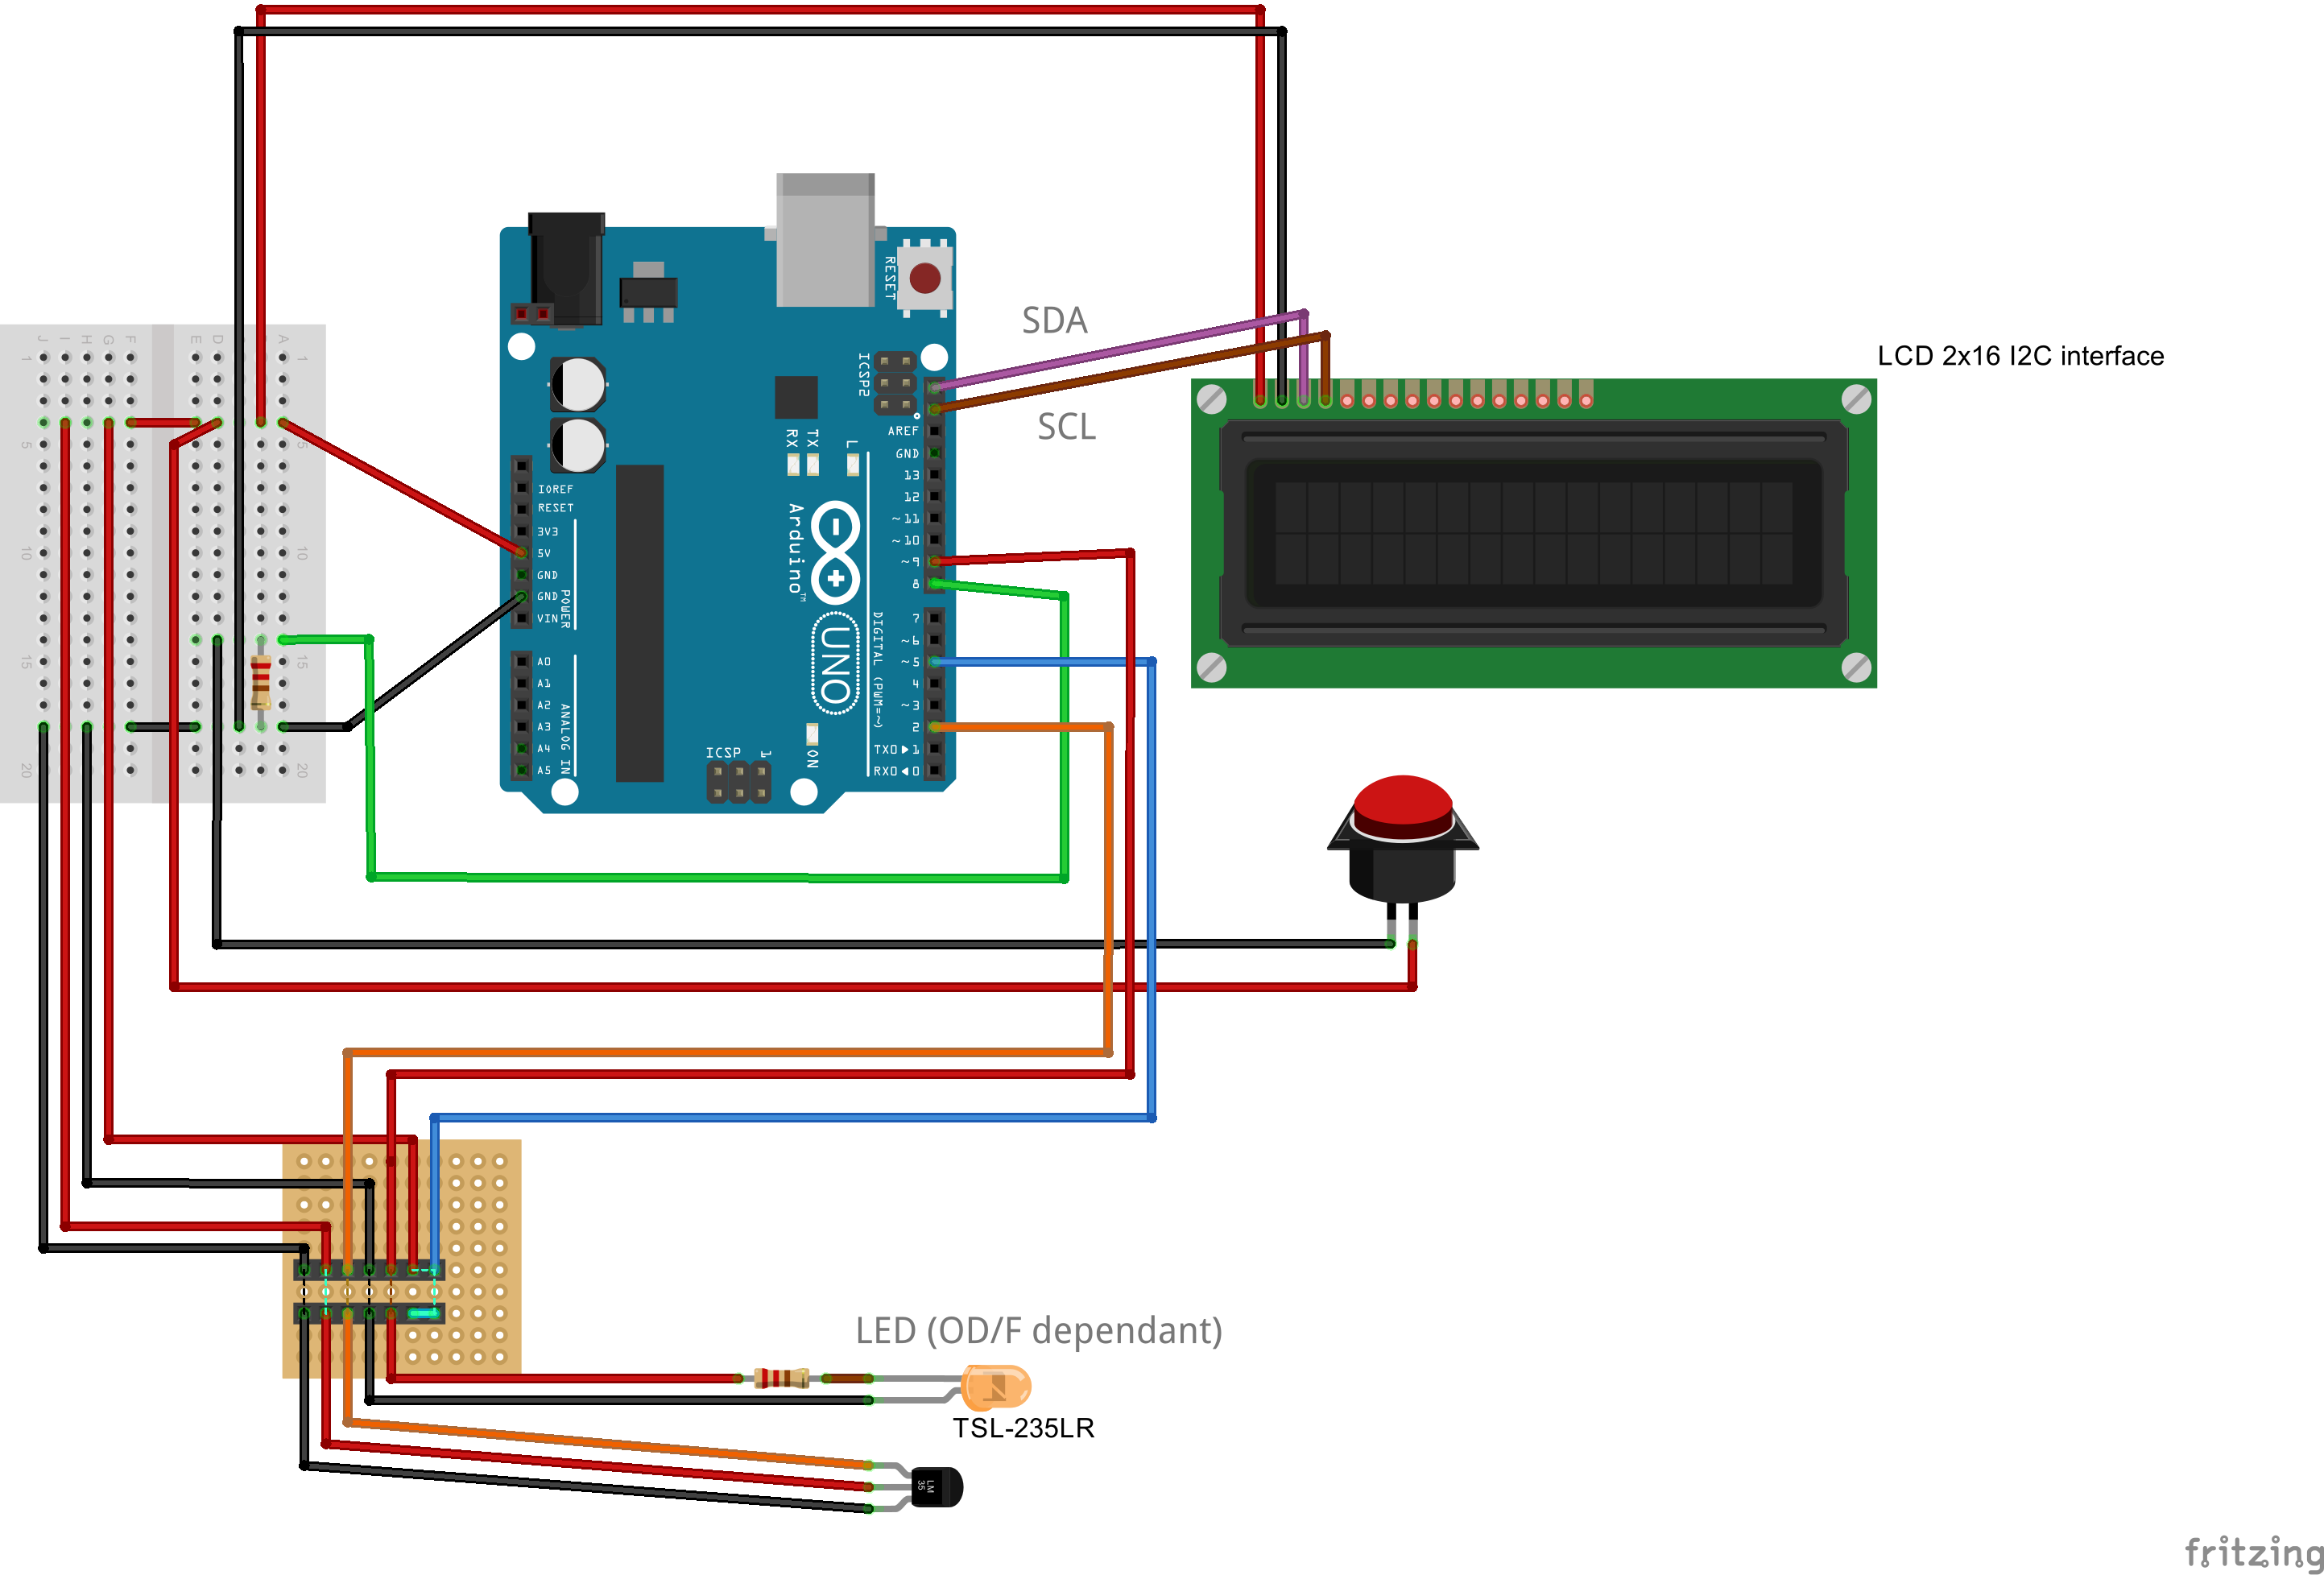
| - | = | + | === Optical Density === |
| + | {{Team:Aachen/Figure|Aachen ODdevice Steckplatine.png|align=center|title=Breadboard of our OD device|subtitle=To build your own OD device, connect the parts as shown in this diagram.|width=900px}} | ||
| + | |||
| + | If you want to build our OD device, make sure to use the following secret ingredients: | ||
| + | * Filter: [http://www.leefilters.com/lighting/colour-details.html#019 Fire 019] | ||
| + | * LED: [http://www.mouser.de/ProductDetail/Dialight/550-2505F/?qs=0KZIkTEbAAvqMAW7suDOXg== 600 nm] Dialight 550-2505F | ||
| + | |||
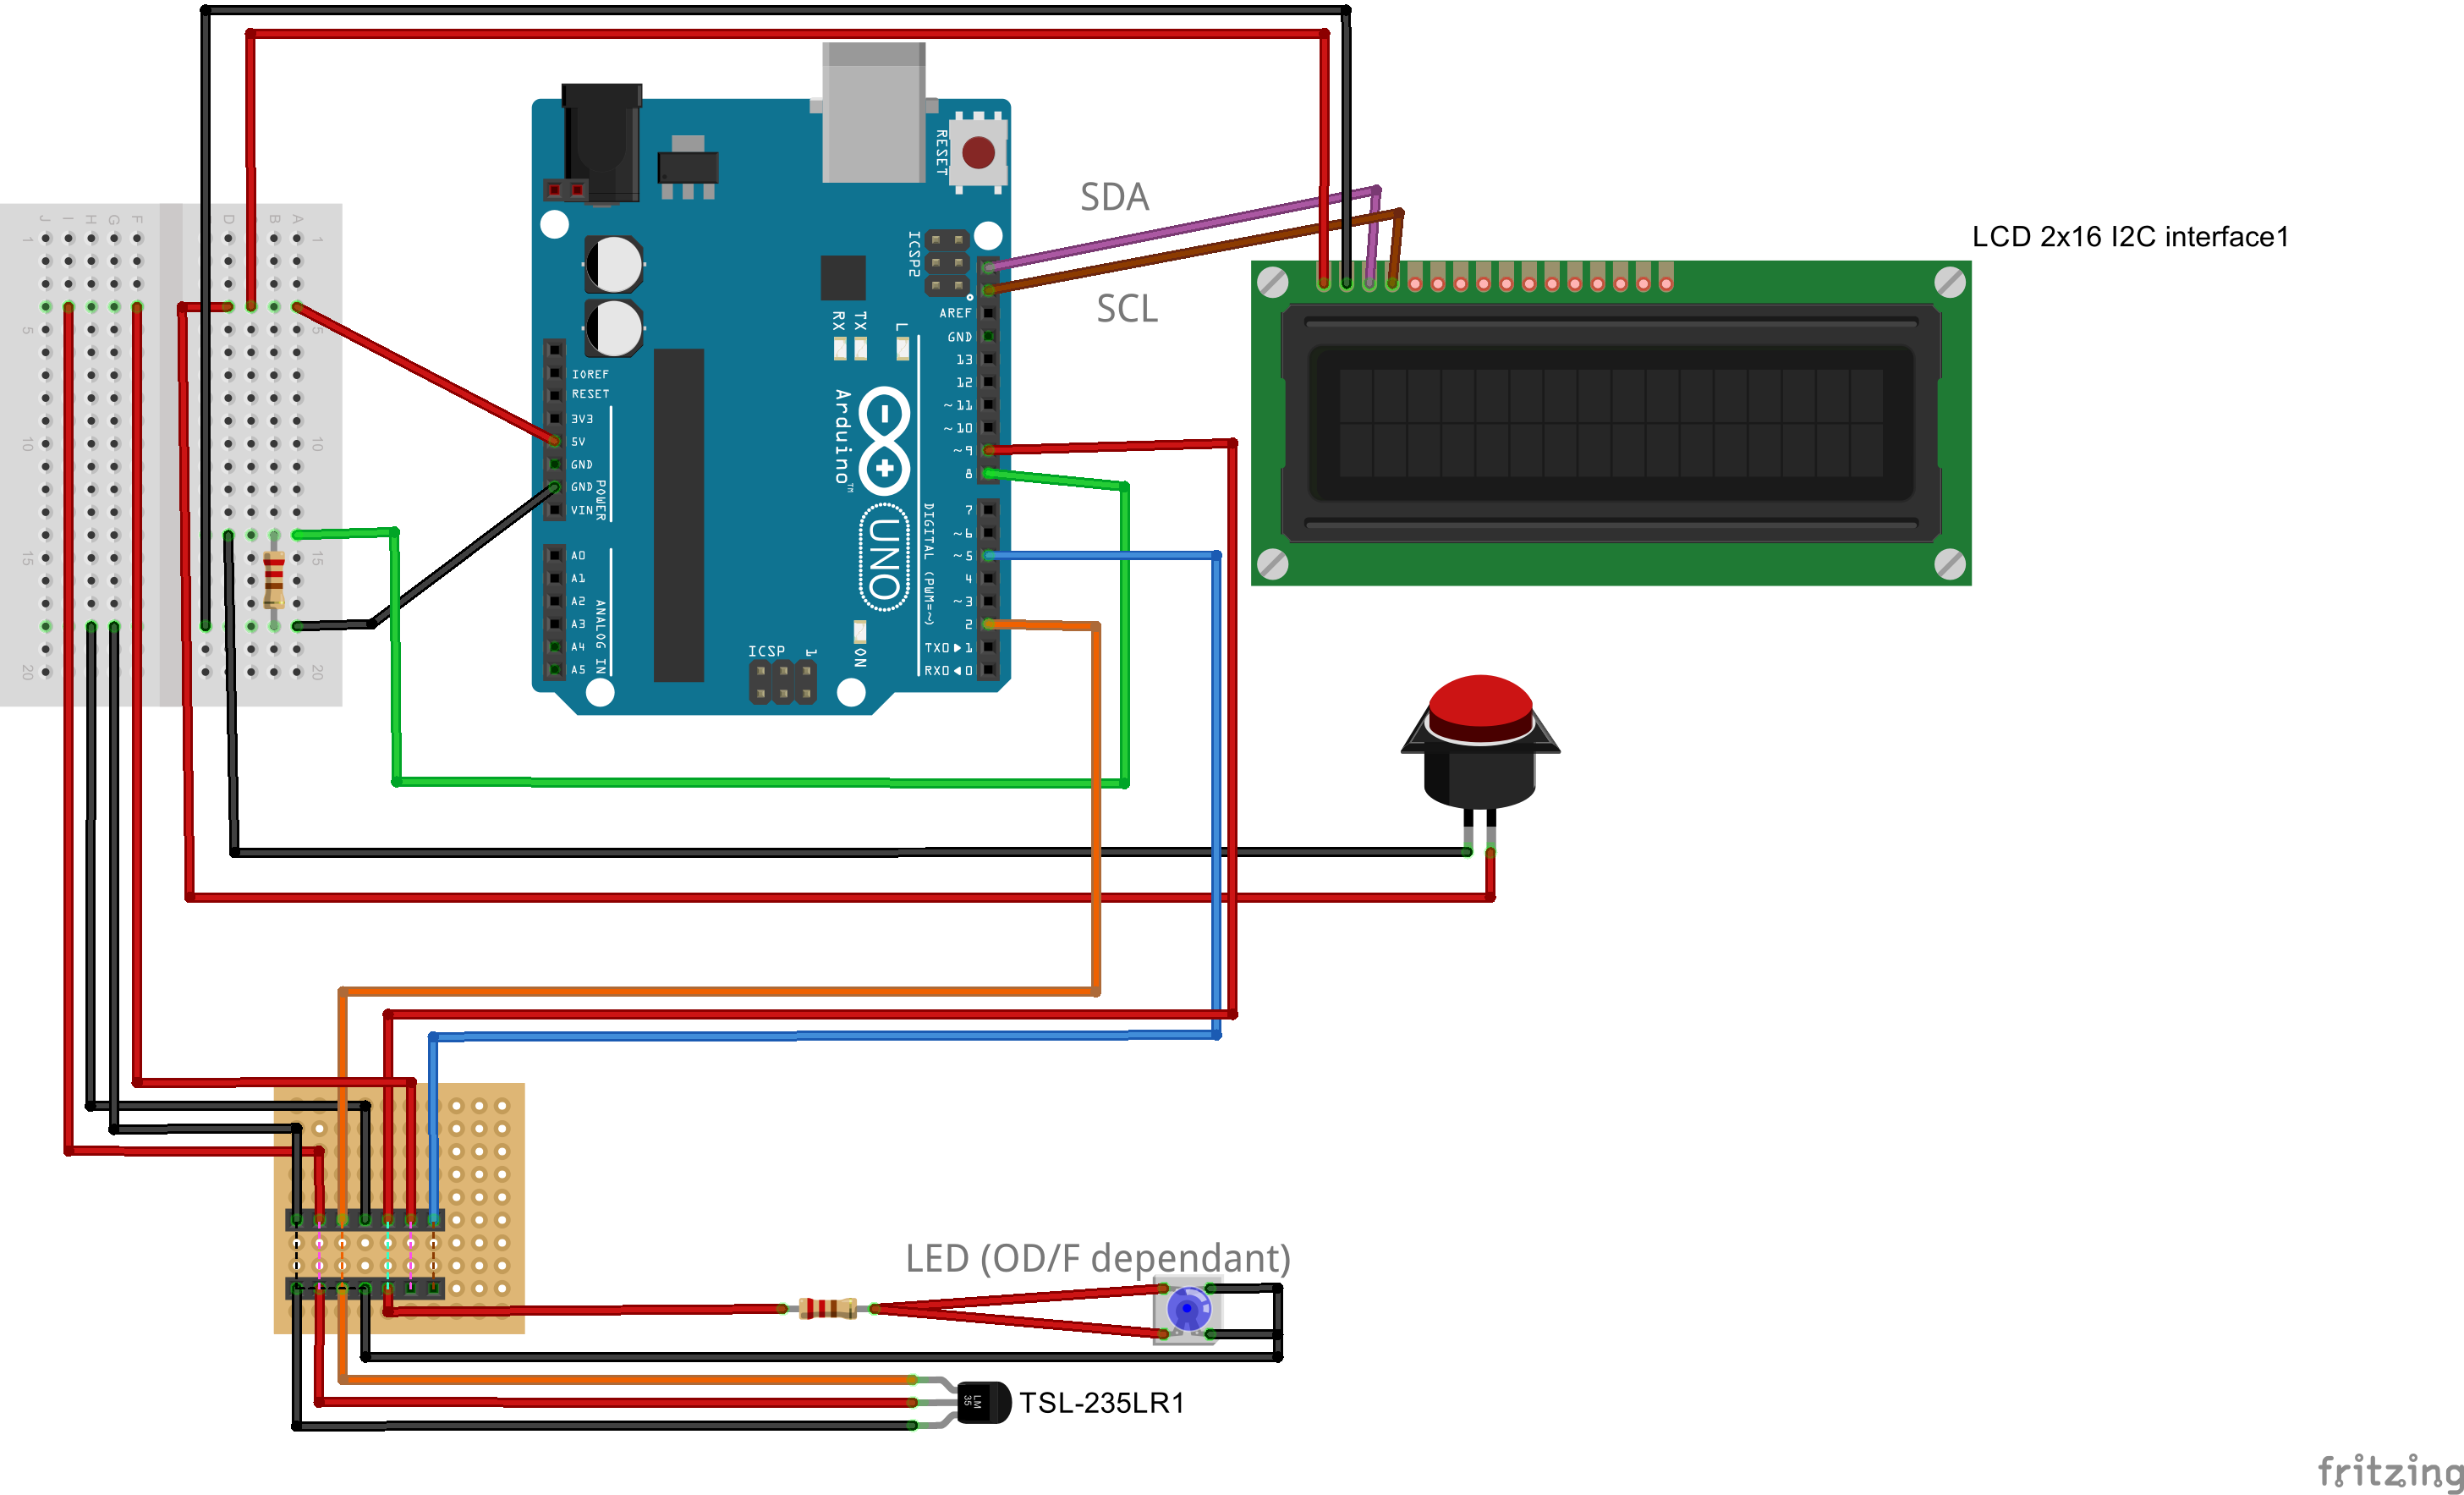
| + | === Fluorescence === | ||
| + | |||
| + | {{Team:Aachen/Figure|Aachen_Fdevice_Steckplatine.png|align=center|title=Our novel biosensor approach|subtitle=Expression of the TEV protease is induced by HSL. The protease cleaves the GFP-REACh fusion protein to elecit a fluorescence response.|width=900px}} | ||
| + | If you want to build the OD device, make sure to use the following secret ingredients: | ||
| + | * Filter: [http://www.leefilters.com/lighting/colour-details.html#736 Twickenham Green 736] | ||
| + | * LED: [http://www.leds.de/Low-Mid-Power-LEDs/SuperFlux-LEDs/Nichia-Superflux-LED-blau-3lm-100-NSPBR70BSS.html 480 nm] NSPBR70BSS LED | ||
| + | |||
| + | === Combined Device === | ||
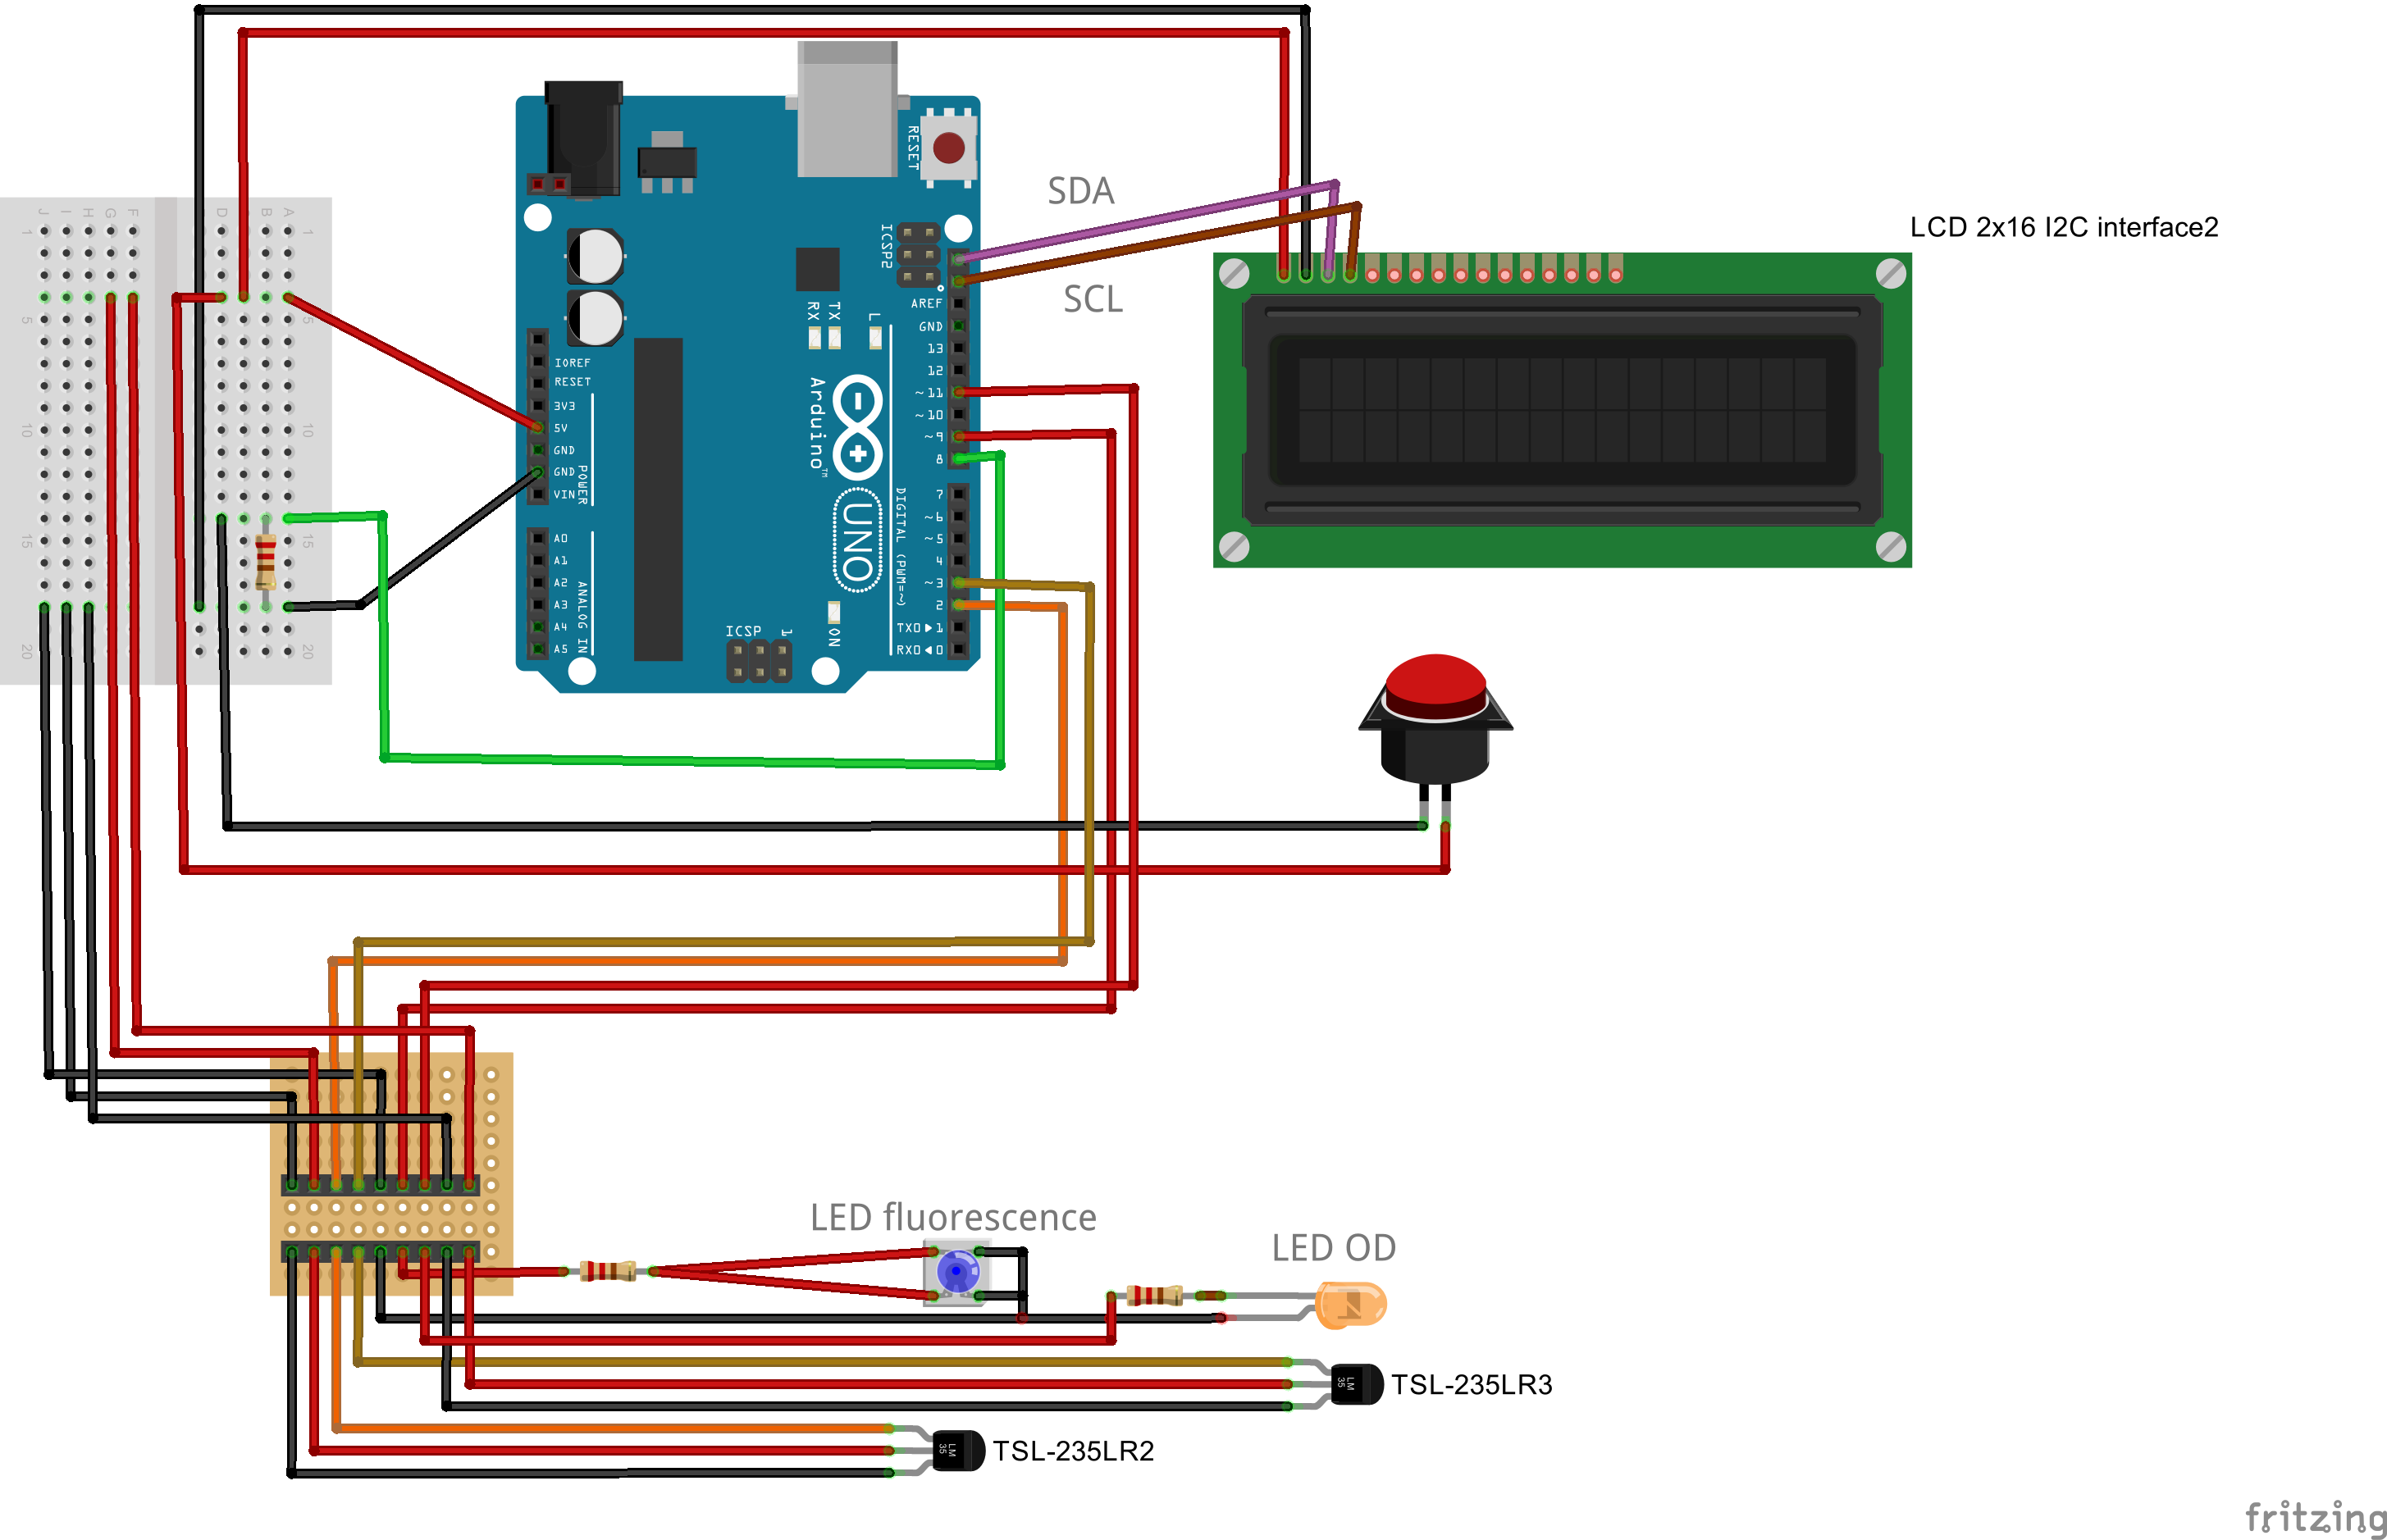
Even though evaluation of the measurements have been performed in two separate device, it is fairly well possible to put everything into one casing. | Even though evaluation of the measurements have been performed in two separate device, it is fairly well possible to put everything into one casing. | ||
All you need to do is choosing another lid, and connect a second light to frequency sensor to your Arduino. | All you need to do is choosing another lid, and connect a second light to frequency sensor to your Arduino. | ||
Right at the bottom we present you the differences in wiring things up. | Right at the bottom we present you the differences in wiring things up. | ||
| - | |||
| - | |||
| - | |||
Building the combined device is straight forward and very similar to the single device. You will need a slightly larger connector, a different lid for your case, and maybe more cables. The changed fritzing-layout is presented below. | Building the combined device is straight forward and very similar to the single device. You will need a slightly larger connector, a different lid for your case, and maybe more cables. The changed fritzing-layout is presented below. | ||
{{Team:Aachen/Figure|Aachen_ODF_combined_Steckplatine.png|align=center|title=Our novel biosensor approach|subtitle=Expression of the TEV protease is induced by HSL. The protease cleaves the GFP-REACh fusion protein to elecit a fluorescence response.|width=900px}} | {{Team:Aachen/Figure|Aachen_ODF_combined_Steckplatine.png|align=center|title=Our novel biosensor approach|subtitle=Expression of the TEV protease is induced by HSL. The protease cleaves the GFP-REACh fusion protein to elecit a fluorescence response.|width=900px}} | ||
| - | |||
| - | |||
| - | |||
| - | |||
| - | |||
| - | |||
| - | |||
| - | |||
| - | |||
| - | |||
| - | |||
| - | |||
| - | |||
| - | |||
| - | |||
| - | |||
| - | |||
| - | |||
| - | |||
| - | |||
| - | |||
| - | |||
| - | |||
| - | |||
| - | |||
| - | |||
| - | |||
| - | |||
| - | |||
| - | |||
{{Team:Aachen/Footer}} | {{Team:Aachen/Footer}} | ||
Revision as of 13:09, 14 October 2014
|
|
|
|
 "
"
