Team:CU-Boulder/Notebook/CC9 Team/Induced
From 2014.igem.org
Jimmynovik (Talk | contribs) |
Jimmynovik (Talk | contribs) |
||
| Line 251: | Line 251: | ||
|- | |- | ||
|} | |} | ||
| + | |||
PCR Settings: 30 cycles as follows | PCR Settings: 30 cycles as follows | ||
- 98 °C Denature 30 sec | - 98 °C Denature 30 sec | ||
Revision as of 00:07, 14 October 2014
Made overnight cultures of….
- Qi gRNA P44251 (AmpR) NOTE: plate from Andrew is labeled P44231 - Qi wr cas9 P44250 (AmpR) - BW 23115 Kan casA (KanR)
5/13/14 Glycerol stocks - Stocks made from overnight cultures (3 from each) - 500 ?L bacteria + 500 ?L 40% glycerol stock
- Glass tube containing #P44250 broke and was discarded – overnight repeated
Mini Prep Protocol done per manufacturer’s instructions with following exceptions: -Done with P44250 on 5/13/14 -Done with P44251 on 5/14/14 -Step 1: Cultures split into 3 separate 1.5 mL aliquots. Supernatant was removed from all three, pellets resuspended in a small amount of EB Buffer and moved into single tube. Centrifuged again and supernatant was removed before proceeding to Step 2.
5/14/14
| Nano Drop of Mini Prep | |||
|---|---|---|---|
| Sample | 260/280 Ratio | 260/230 Ratio | DNA Concentration |
| P44250 | 1.94 | 2.17 | 49.4 ng/?L |
| P44251 | 1.94 | 2.47 | 52.7 ng/?L |
- Samples were blanked with EB Buffer
Restriction Digest - NEBcutter V2.0 used to check digestion cut sites (done in silico) - Digest reaction performed as shown below (from NEB) - Incubated for 1 hour at 37°C - No heat inactivation performed
| P44250 | P44251 | |
|---|---|---|
| Cutsmart Buffer | 5.0 ?L | 5.0 ?L |
| XbaI | 1.0 ?L | 1.0 ?L |
| XhoI | 1.0 ?L | -- |
| SpeI | 1.0 ?L | -- |
| EcoRI-HF | -- | 1.0 ?L |
| DNA (200 ng) | 4.0 ?L | 4.0 ?L |
| MQ H2O | 38.0 ?L | 39.0 ?L |
| Total Volume | 50.0 ?L | 50.0 ?L |
Agarose Gel Electrophoresis -1% agarose gel prepared -2 ?L loading dye added to 18 ?L of each sample for loading into each lane -1Kb+ DNA Ladder used -Overnight staining in EtBr done to better visualize faint bands
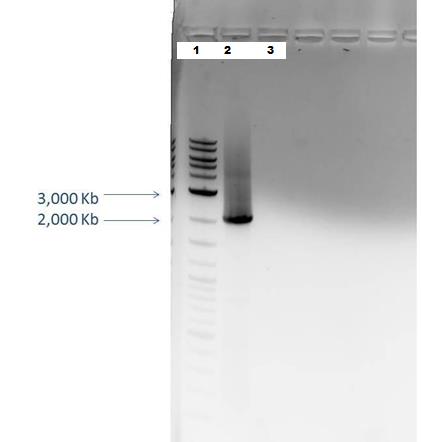
Lane 1: 2-Log DNA Ladder Lane 2: P44250 digest Lane 3: P44251 digest
P50 plasmid should have 3 segments after digestion: 4221 bp, 1740 bp, 970 bp
P51 plasmid should have 2 segments after digestion: 540 bp, 2045 bp
-This is demonstrated in the gel image shown below.
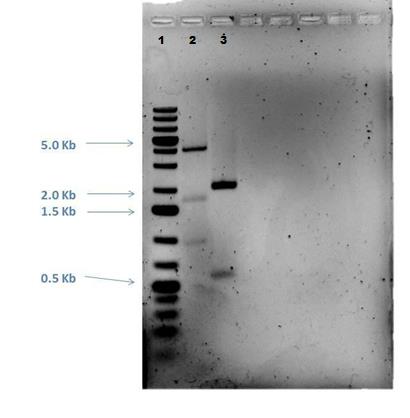
Plate Streaking
-Used to check the TetR gene in the P44250 plasmid
-2 mL LB containing 50 mg/ ?L Tet added to plate and allowed to soak in
-Plates left at room temperature overnight
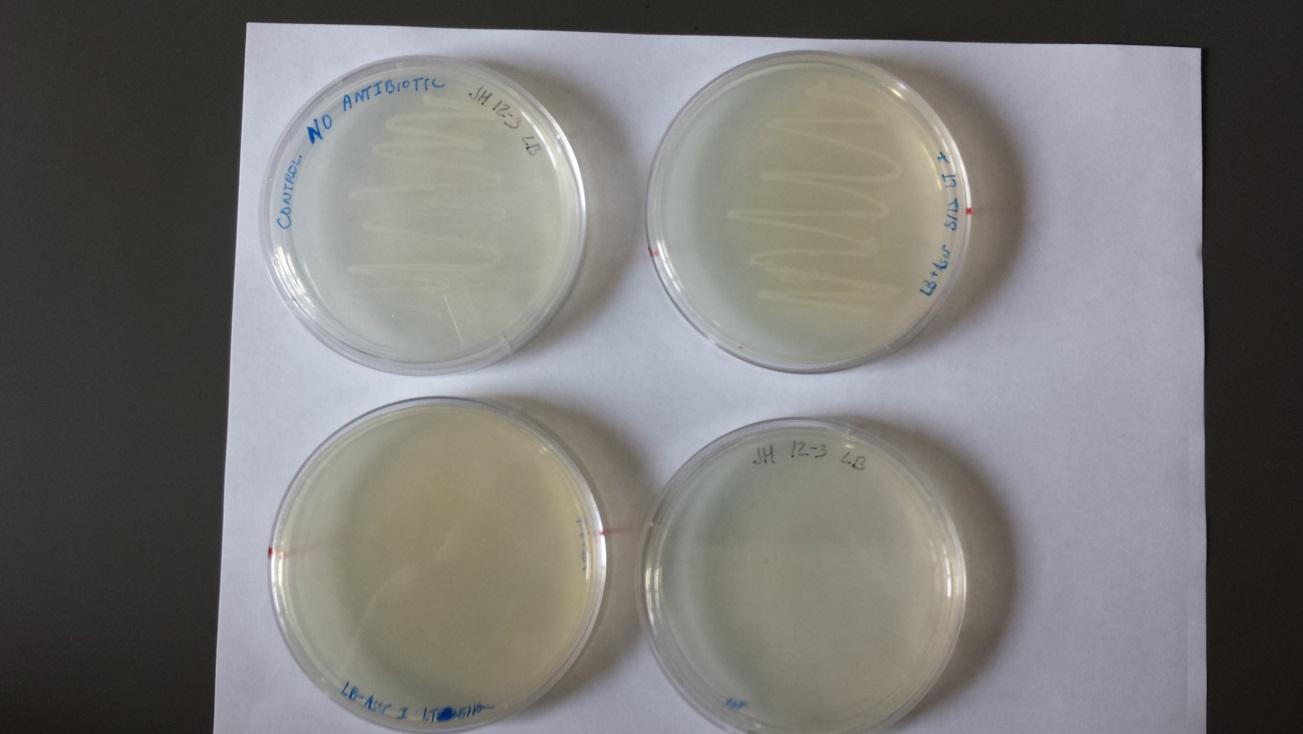
- LB only plate – negative control - Amp plate - Amp + Tet - Tet
5/15/14
Dry Lab
- gRNA designed for Kanamycin
- Plasmid design – considering Gibson assembly and cPEC
Analysis of streak plates from 5/14/15 Results: (See Below) LB: Slightly less growth than Amp plate Amp plate: Normal Growth Amp + Tet: No bacteria present Tet: No bacteria present Results were inconsistent with expectations. There is some concern regarding the potency of the tetracycline used. Further research revealed that the TetR gene is a repressor for TetO which part of the bi-directional promoter for cas9. Thus TetR is inhibited with presence of tetracycline. We will use TetR as a regulator for cas9.
5/16/14 Dry Lab - gRNA designs modified - Primer design for Gibson assembly of our plasmid
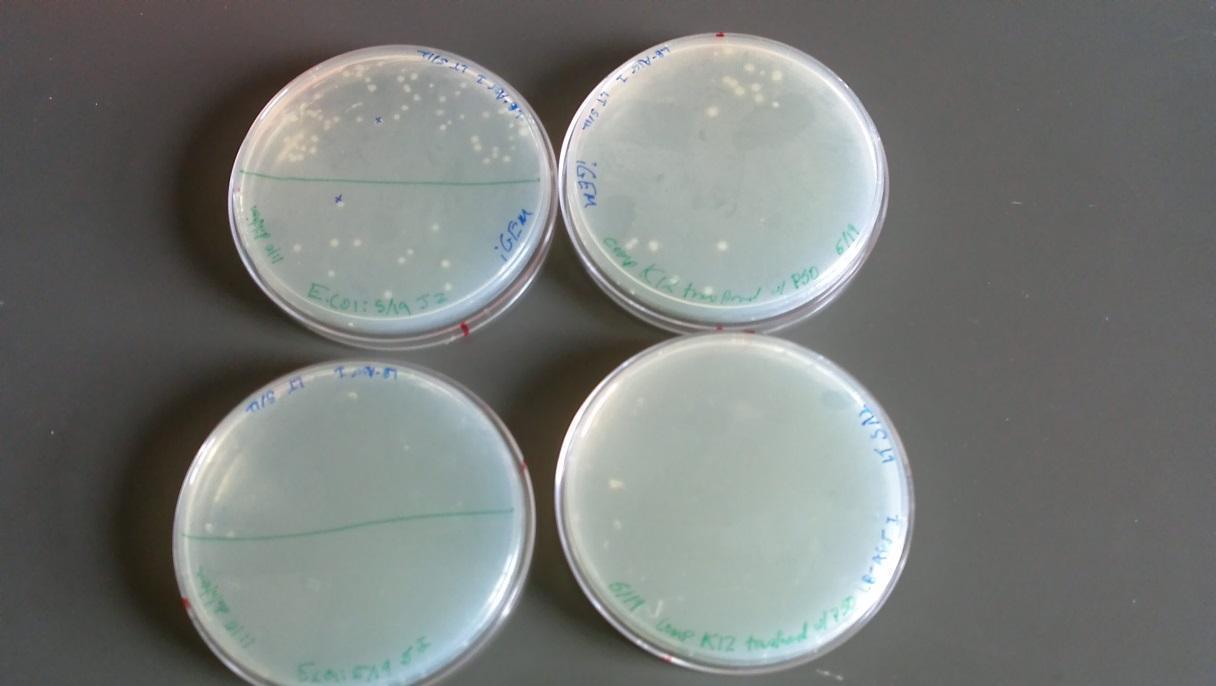
Week 2 5/19/14 Transformation: 1 ?L P44250 (cas9) plasmid added to K12 E. coli strain Heat shock done according to protocol (45 sec @ 42°C) Cultures incubated at 37°C for 1.5 hours 4 Plates with K12 and the plasmid were plated by streaking as follows: - Amp, Amp (? plate with 1:10 dilution, ? plate 1:1), Amp + Kan, Amp + Kan (? plate with 1:10 dilution, ? plate 1:1) 5/20/14 Plates from 5/19/14 (shown below).
Two individual colonies were taken and grown overnight from the Amp plate (marked with “x” in upper left plate of above image). There was no growth on the two plates with Amp and Kan (K12 strain does not contain Kan resistance).
5/22/14 Transformation: (Chemically competent BWF+ cells with P44250 plasmid) 1 ?L P44250 (cas9) plasmid added to conjugated BWF+ strain Transformation protocol followed with following exceptions: -200 ?L SOC added to each sample -Incubated for 2 hours -1:10 dilution made (10 ?L into 90 ?L SOC) -Cultures plated on Amp plates, one with full concentration and another with the 1:10 dilution
5/23/14
Arrival of primers previously ordered
All were reconstituted in MQ H2O to 100 ?M concentration
Results of plates from 5/22/14:
- BFW+ w/ P50 plasmid: growth at full and 1:10 dilution (Top left of image)
- BFW+ w/ P50 plasmid full strength: No growth (Bottom left of image)
- BW only: full strength showed minor growth (Bottom right of image)
- BW only: No growth at full and 1:10 dilution (Top right of image)
(*This was an unexpected result – it may be that these two plates were mislabeled)
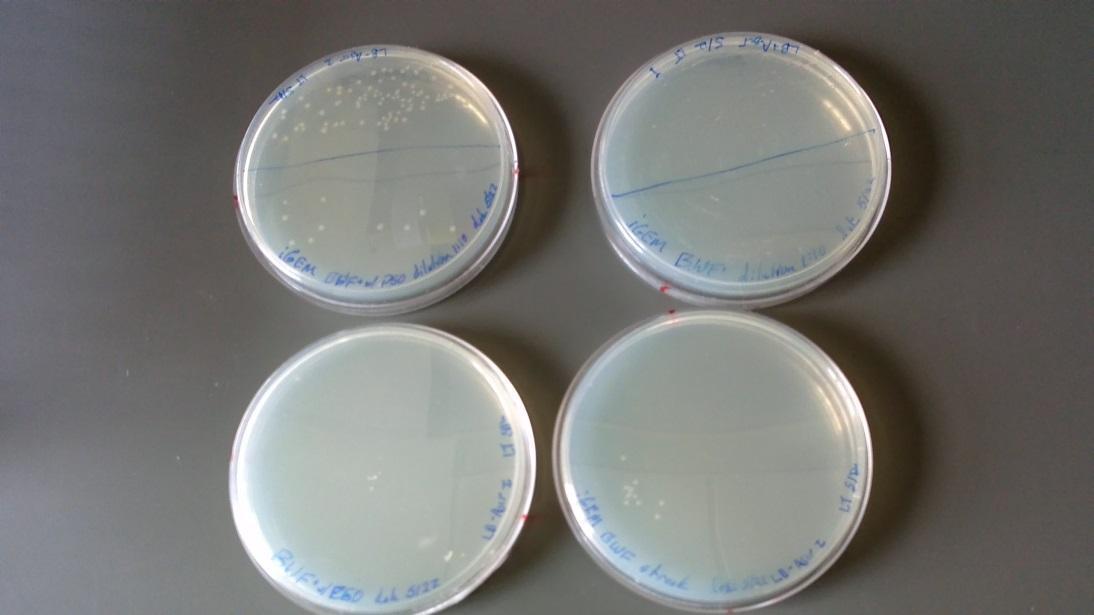
Single colonies taken from the BFW+ w/ P50 plasmid plate in the 1:10 dilution and placed in 2 ?L liquid culture overnight with the following antibiotics:
- AMP
- Kan
- AMP + Kan
- Tet
5/24/14
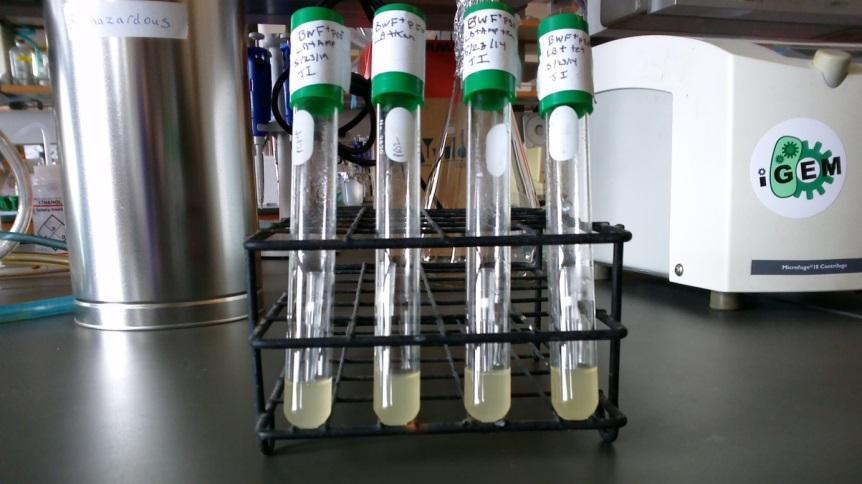
As shown the image below, overnight cultures from 5/23/14 are all cloudy demonstrating bacterial growth.
PCR Reaction – Used to amplify out cas9 from P44250 plasmid and CMR from PSB1C3 plasmid
*DNA samples diluted so each contains 0.5 ng/?L
| Cas9 | CMR | |
|---|---|---|
| Q5 Master Mix volume | 25 ?L | 25 ?L |
| dcas9 Primer volume | 2.5 ?L | -- |
| dCMR Primer volume | -- | 2.5 ?L |
| DNA added | 2.5 ?L | 2.5 ?L |
| Q5 Polymerase volume | 0.5 ?L | 0.5 ?L |
| Nuclease Free H2O | 20 ?L | 20 ?L |
| Final Reaction Volume | 50.0 ?L | 50.0 ?L |
PCR Settings: 30 cycles as follows - 98 °C Denature 30 sec - 70 °C Anneal 30 sec - 72 °C Extension 2.5 min
Week 3
5/25/14 Gel electrophoresis performed on PCR reactions from 5/24/14. 1% gel made from 0.514 g agarose with 50 mL 1X TAE and 5 ?L EtBr. Lane 1: 5 ?L 2-Log DNA Ladder Lane 2: CMR sample* (~2 Kb size) Lane 3: Cas9 sample* (~5 Kb size)
- Each contained 8 ?L reaction sample + 2 ?L loading dye
Gel Results:
Lane 1 – Ladder Lane 2 – Although band of correct size visible for CMR sample (~2Kb), there may be contamination Lane 3 – No bands visible – This is perhaps due to having the extension time too short in the PCR reaction (Advisors suggest 60 sec per 1000 bases).
5/27/14 Repeat of PCR using same protocol as listed on 5/24/14 except for different times on the thermocycler as follows:
| Cas9 | CMR | |
|---|---|---|
| Initial Denature | 98°C/2 min | 98°C/2 min |
| Denature | 98°C/30 sec | 98°C/30 sec |
| Anneal | 69°C/30 sec | 72°C/30 sec |
| Extend | 69°C/ 2.5 min | 72°C/2.5 min |
| Final Extension | 72°C/6 min | 72°C/5 min |
- Thermocycler containing CMR stopped after 1 cycle and held at 98°C for ~3hours. Machine was reset and run. This sample may no longer be viable.
5/28/14
Dry lab – primer designs
Repeat of PCR for the CMR reaction, same as described on 5/24/14 and shown below.
| Reactants | CMR |
|---|---|
| Q5 Master Mix | 25 ?L |
| dCMR Primer | 2.5 ?L |
| Q5 Polymerase | 0.5 ?L |
| CMR DNA | 2.0 ?L |
| Nuclease Free H2O | 20 ?L |
| Final Reaction Volume | 50.0 ?L |
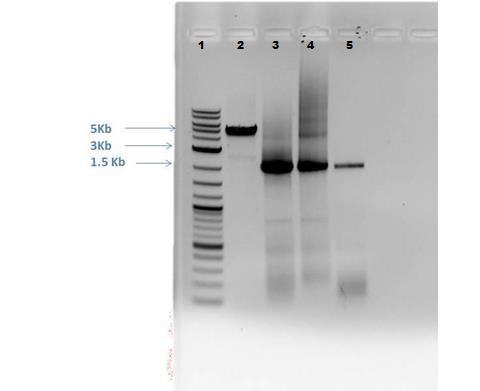
5/29/14 Gel electrophoresis: 1% gel ran at 110V for ~40 minutes.
| Lane | Sample | Amount | Loading dye amount |
|---|---|---|---|
| 1 | 2-Log DNA Ladder | 0.5 ?L | -- |
| 2 | Cas9 | 5.0 ?L | 1.0 ?L |
| 3 | CMR 1 (from 5/24) | 5.0 ?L | 1.0 ?L |
| 4 | CMR 2 (from 5/27) | 5.0 ?L | 1.0 ?L |
| 5 | CMR 3 (from 5/28) | 5.0 ?L | 1.0 ?L |
Results from Gel (shown below): Lane 2: Cas9 band visible of appropriate size (approximately 5,000 bp) Lane 3: CMR 1- slight smearing Lane 4: CMR 2 – smearing present Lane 5: CMR 3- clean, no smearing All CMR lanes have band present of correct size (approx. 2,000 bp)
Gel extraction performed on cas9, CMR1, and CMR2 lanes using E.Z.N.A. Gel extraction kit following the protocol. Following amounts: - Cas9: 110 ?L buffer with 0.1103 g sample - CMR1: 53 ?L buffer with 0.0533 g sample - CMR2: 90 ?L buffer with 0.0904 g sample
Nanodrops performed to determine DNA concentration and purity with the following results:
| Sample | ng/ ?L | 260/280 | 260/230 | **ng/ ?L | **260/280 | **260/230 |
|---|---|---|---|---|---|---|
| Gel-Cas9 | 7.3 | 2.20 | 0.57 | 5.2 | 2.06 | 0.52 |
| Cas9 | 483.2 | 1.78 | 0.72 | 36.3 | 1.85 | 1.72 |
| Gel-CMR1 | 9.6 | 2.02 | 0.63 | 6.5 | 2.35 | 0.90 |
| Gel-CMR2 | 8.3 | 2.06 | 0.83 | 5.0 | 2.21 | 0.69 |
| CMR2 | 618.8 | 1.66 | 0.61 | 44.5 | 1.89 | 1.41 |
| CMR 3 | 535.8 | 1.73 | 0.61 | 17.8 | 1.89 | 1.31 |
| CMR1 | 516.6 | 1.69 | 0.61 | 68.5 | 1.84 | 1.74 |
- Trial 2 completed on 5/30/14 shown in these columns
Values for the ratios should be between 2.0 and 2.2 for a pure sample. The values for Trial #1 are much too low. In order to increase sample purity, a DNA cleanup is performed following the protocol given in the E.Z.N.A. gel extraction kit in amounts shown below. - 25 ?L samples - 25 ?L binding buffer - Washed 2x with 700 ?L SPW - 30 ?L elution buffer added, allowed to rest 4 minutes - Centrifuged on max for 2 min
5/30/14
After the DNA cleanup protocol – nanodrop performed again with results listed in above table as Trial #2
Restriction Digestion performed on Cas9 and CMR1 with DPN1 (to remove any methylation present) using standard digestion protocol with the following amounts: 26 ?L sample 1.0 ?L DPN1 (100 fold dilution) 3.0 ?L 10X CutSmart Buffer
Gibson Assembly performed to join pSB1C3 backbone with cas9 PCR product. Protocol for Gibson was followed for the reaction.
| Reactants | Volume |
|---|---|
| Gibson Master Mix | 10 ?L |
| Cas9 | 1.6 ?L (50 ng) |
| Cmr | 2.4 ?L (143 ng) |
| Nuclease Free H2O | 6 ?L |
| Final Reaction Volume | 20.0 ?L |
Product was transformed into competent cells following the Gibson transformation protocol that included a positive control.
Week 4
6/2/14
Grow Gibson colonies in 6 mL LB media + 30 ?L chloroamp
Transform Gibson colonies following protocol and with amounts as shown: - BWF+ w/cas9: 15 ?L into 135 ?L SOC - BW w/cas9: 15 ?L into 135 ?L SOC - BWF+ (no cas9): 30 ?L into 270 ?L SOC - BW (no cas9): 30 ?L into 270 ?L SOC
90 ?L of the above four reactions plated as follows and incubated: - BWF+ w/cas9: Amp + Kan - BW w/cas9: Amp + Kan - BWF+ (no cas9): (2 Plates) Amp + Kan and Kan only - BW (no cas9): (2 Plates) Amp + Kan and Kan only - All four reactions also plated together on Quad plate with Chloramp - BWF+ (Not transformed) on Kan + Tet (plated both at full strength and as 1:10 dilution)
6/3/14
Analysis of Plates from 6/2/14: Only one colony was present on Gibson plate (BWF+ w/cas9) This colony was taken and suspended in O/N culture (LB and Choroamp) MiniPrep performed on the O/N cultures *Renamed the product GAcasC (Gibson Assembly w/cas and Chloroamp) NanoPrep on GAcasC
| ng/ ?L | 260/280 | 260/230 |
|---|---|---|
| 201.0 | 1.88 | 2.24 |
Digest performed according to protocol on GAcasC and P50 plasmid using EcoRV and BamHI as follows:
| Reactants | GAcasC | P50 |
|---|---|---|
| Buffer 3 | 2.5 ?L | 2.5 ?L |
| EcoRV | 0.5 ?L | 0.5 ?L |
| BamHI | 0.5 ?L | 0.5 ?L |
| BSA (1:4 dilution) | 1.0 ?L | 1.0 ?L |
| DNA (250 ng) | 1.25 ?L | 5.0 ?L |
| MQ H2O | 19.25 ?L | 15.5 ?L |
| Total Volume | 25.0 ?L | 25.0 ?L |
1% Gel made for electrophoresis. Each sample had 1 ?L of loading dye added, 5 ?L of DNA ladder and 5 ?L of each sample was loaded. Gel ran 120V for ~1 hour.
| Well | Loaded |
|---|---|
| 1 | DNA Ladder |
| 2 | GAcasC digest |
| 3 | CmR1 Dpn1 product |
| 4 | Cas9 Dpn1 product |
| 5 | P50 digestion product |
Gel Results: Lane 2 should have multiple products which are not present in the gel. The other lanes are as expected.
PCR using Q5 is used to amplify the P51 CRISPR backbone using primers CRE1 & CRE4 provided by Andrew. Primers were diluted 1:10 from 100 mM stock
| Reactants | Volume |
|---|---|
| Q5 Master Mix | 25 ?L |
| CRE1 Primer | 2.5 ?L |
| CRE4 Primer | 2.5 ?L |
| P51 DNA | 2.0 ?L |
| Q5 Polymerase | 0.5 ?L |
| Nuclease Free H2O | 17.5 ?L |
| Final Reaction Volume | 50.0 ?L |
Thermocycler set as follows for the reaction:
| Initial Denature | 98°C/30 sec |
|---|---|
| Denature | 98°C/20 sec |
| Anneal | 60°C/20 sec |
| Extend | 72°C/3 min |
Restriction Digestion performed on P51 with DPN1 (to remove any methylation present) using standard digestion protocol with the following amounts: 26 ?L sample 1.0 ?L DPN1 (100 fold dilution) 3.0 ?L 10X CutSmart Buffer
PCR performed to dimerize each of the gRNA primers previously designed (729, 666, 756, SC1, and SC2) following the cPEC protocol and using the following amounts:
| Reactants | Volume |
|---|---|
| Q5 Master Mix | 25.0 ?L |
| Primer | 1.7 ?L |
| Primer | 2.0 ?L |
| Q5 Polymerase | 0. 5 ?L |
| Nuclease Free H2O | 19.5 ?L |
| Final Reaction Volume | 50.0 ?L |
Nanodrop performed on some of these products (due to timing) to check for purity and concentration (results below). It is assumed that the other samples have high enough DNA levels to proceed.
| Sample | ng/ ?L | 260/280 | 260/230 |
|---|---|---|---|
| 729 | 405.5 | 1.78 | 0.67 |
| SC2 | 393.2 | 1.80 | 0.67 |
| CasC | 455.2 | 1.5 | 0.60 |
cPEC performed to combine the P51 amplification and the each of the dimerized gRNAs separately following the cPEC protocol and using the following amounts:
| Reactants | Volume |
|---|---|
| Q5 Master Mix | 12.5 ?L |
| Insert (our primer dimers) | 1.7 ?L |
| Template DNA | 2.0 ?L |
| Q5 Polymerase | 0.25 ?L |
| Nuclease Free H2O | 10.05 ?L |
| Final Reaction Volume | 25.0 ?L |
Repeat of Gibson to combine cas9 and CmR (pSB1C3 backbone) with cas9 PCR product. Gibson protocol was followed for the reaction and included a positive control (same as reaction completed on 5/30/14).
| Reactants | Volume |
|---|---|
| Gibson Master Mix | 10 ?L |
| Cas9 | 1.6 ?L (50 ng) |
| Cmr | 2.4 ?L (143 ng) |
| Nuclease Free H2O | 6 ?L |
| Final Reaction Volume | 20.0 ?L |
Product was transformed into competent cells following the Gibson transformation protocol that included a positive control.
O/N cell cultures made from plates in order to perform a Tet titration tomorrow. 2 tubes of each were made by taking a single colony and mixing with 5 mL of LB and antibiotics as listed below before incubation.
| Sample | Antibiotic |
|---|---|
| BWF+ w/ cas | 5 ?L Kan + 10 ?L Amp |
| BW w/ cas | 5 ?L Kan + 10 ?L Amp |
| BWF+ | 5 ?L Kan |
| BW | 5 ?L Kan |
| BWF+ (not transformed) | 5 ?L Kan + 10 ?L Tet |
6/4/14
Tet titration on O/N cultures was performed by using different concentrations (from 0-1000 ng/mL) of anhydrotetracycline plus a chloramp control.
- Cancelled as cell growth had already neared plateau values
| Sample | 0 ng/mL | 0.5 ng/mL | 5 ng/mL | 20 ng/mL | 50 ng/mL | 250 ng/mL | 1000 ng/mL | Chloro |
|---|---|---|---|---|---|---|---|---|
| BW | 2.38 | 2.401 | 2.389 | 2.382 | 2.386 | 2.398 | 2.373 | 2.379 |
| BWF+ | 2.379 | 2.376 | 2.428 | 2.390 | 2.378 | 2.365 | 2.378 | 2.386 |
| BWcas | 2.391 | 2.356 | 2.367 | 2.355 | 2.366 | 2.330 | 2.362 | 2.382 |
| BWF+ cas | 2.438 | 2.447 | 2.448 | 2.434 | 2.436 | 2.415 | 2.419 | 2.415 |
| BWF+ Tet | 2.135 | 2.146 | 2.141 | 2.152 | 2.128 | 2.127 | 2.134 | 2.134 |
New O/N cell cultures made to do the titration on 6/5/14. Same amounts as shown above were used except only one of each was made. No cells added to O/N culture on 6/4/14, that is why procedure was repeated.
6/5/14
Since the Gibson Assembly does not seem to be working, cPEC was performed to combine the CmR backbone with Cas9. Three different cycles were run in an attempt to optimize the protocol; the following amounts were used in all three reactions:
| Reactants | Volume |
|---|---|
| Q5 Master Mix | 10.0 ?L |
| Cas9 DNA | 5.0 ?L |
| CmR DNA | 5.0 ?L |
| Nuclease Free H2O | 0.00 ?L |
| Final Reaction Volume | 20.0 ?L |
Thermocycler was varied for each of the three cPEC reactions as listed below:
| cPEC1 | cPEC2 | cPEC3 | |
|---|---|---|---|
| Initial Denature | 98°C/30 sec | 98°C/30 sec | 98°C/30 sec |
| Denature | 98°C/10 sec | 98°C/20 sec | 98°C/10 sec |
| Anneal | 56°C/30 sec | 60°C/20 sec | 66°C/30 sec |
| Extend | 72°C/90 sec | 72°C/30 sec | 72°C/90 sec |
| # of cycles | 10 | 15 | 10 |
| Final Extension | 72°C/10 min | 72°C/10 min | 72°C/10 min |
| _t | |||
| Nanodrop done on the three cPEC casC reactions with results listed below: | |||
CasC1 489.3 1.80 0.72 CasC2 577.7 1.76 0.59 CasC3 542.5 1.80 0.74
_t
DNA cleanup done on these three casC cPEC reactions, followed by another nanodrop to examine purity with the results below.
| Sample | ng/ ?L | 260/280 | 260/230 |
|---|---|---|---|
| CasC1 | 13.4 | 1.99 | 1.61 |
| CasC2 | 11.1 | 2.02 | 1.15 |
| CasC3* | 9.9 | 1.84 | 1.21 |
| _t | |||
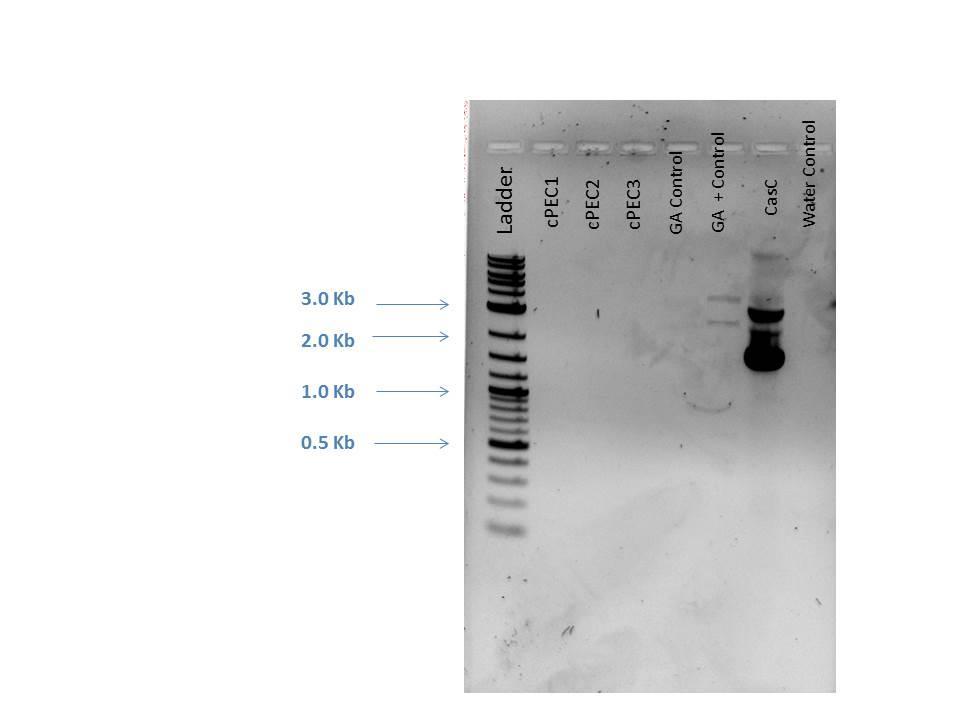
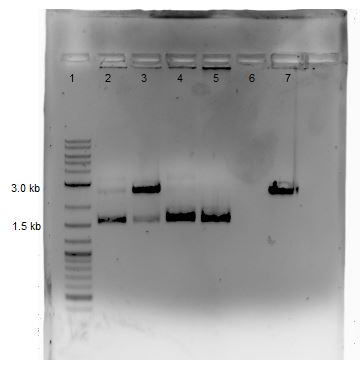
| 1% Gel made for electrophoresis. Each sample had 1 ?L of loading dye added, 5 ?L of DNA ladder and 5 ?L of each sample was loaded. Gel ran 122V for ~50 min. | |||
1 2-Log DNA Ladder 2 cPEC1 3 cPEC2 4 cPEC3 5 GA Control 6 GA Positive Control 7 CasC 8 H2O Control
_t
Titration experiment was done to determine the optimal concentration of anhydrous tetracycline (ATC) to be used and to determine if the cas9 protein was lethal to the cells. It was decided to use BWF+ w/cas9 and w/o cas9 for this experiment. Starting ODs were taken of a 1:10 dilution from liquid cultures grown overnight. This was used to calculate the amount to be added to 50 mL LB to start the experiment with an OD close to 0.05. ODs were taken periodically as the cells grew as shown below.
| Time 0 | Time 1 | Time 2 | Time 3 | Time 4 | Time 5* | Time 6 | |
|---|---|---|---|---|---|---|---|
| BWF+ | 0.041 | 0.047 | 0.114 | 0.283 | 0.597 | 0.065 | 0.171 |
| BWF+ w/cas9 | 0.035 | 0.046 | 0.110 | 0.262 | 0.530 | 0.059 | 0.154 |
- At Time 5, the cultures were again diluted down. The experiment was cancelled after Time 6 due to time constraints and issues with the plates.
6/6/14
Plates with the Gibson Assembly products have shown very slow growth. Seven colonies are visible on the Gibson plate (shown with positive control plate below).
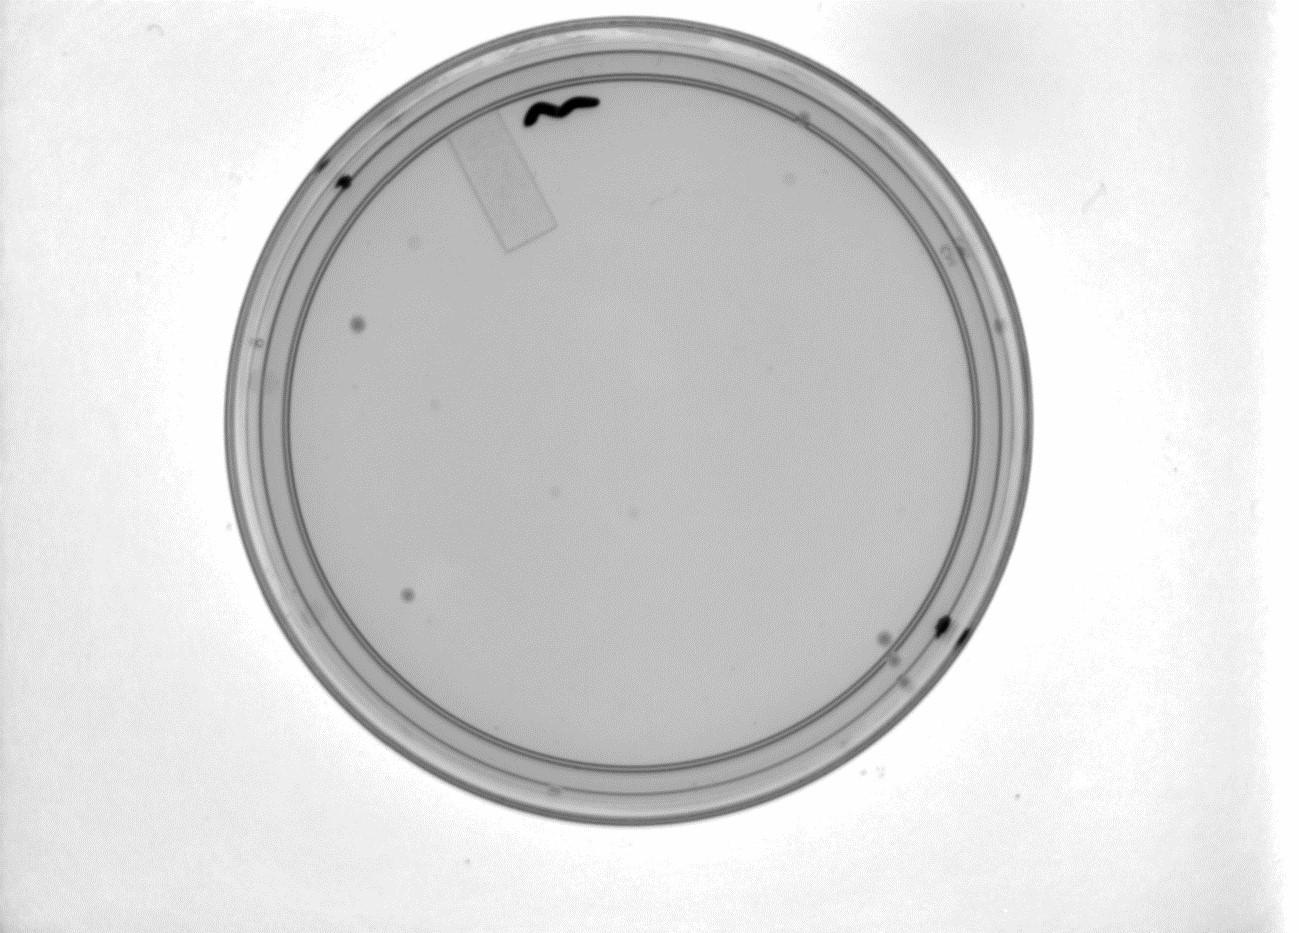

Above left: Gibson Assembly plate with 7 colonies. Above Right: Gibson Assembly positive control plate.
Week 5
6/9/14
Mini-preps were done following manufacturer's protocol except samples were centrifuged 4 minutes at the end (step 9). Ten samples were done that included 7 GA colonies, 1 GA control (labeled GA8), P50, and P51. All were subjected to a nanodrop and a restriction digestion with BamHI and EcoRV was performed on all the samples all except P51. The nanodrop results are shown below:
| Sample | ng/ ?L | 260/280 | 260/230 |
|---|---|---|---|
| GA1 | 80.5 | 1.88 | 2.04 |
| GA2 | 87.8 | 1.90 | 2.14 |
| GA3 | 53.4 | 1.89 | 1.72 |
| GA4 | 67.1 | 1.88 | 2.02 |
| GA5 | 49.5 | 1.92 | 1.86 |
| GA6 | 84.2 | 1.90 | 2.07 |
| GA7 | 54.6 | 1.94 | 2.08 |
| GA8 | 59.8 | 1.86 | 1.60 |
| P50 | 91.3 | 1.88 | 2.12 |
| P51 | 65.8 | 1.88 | 2.03 |
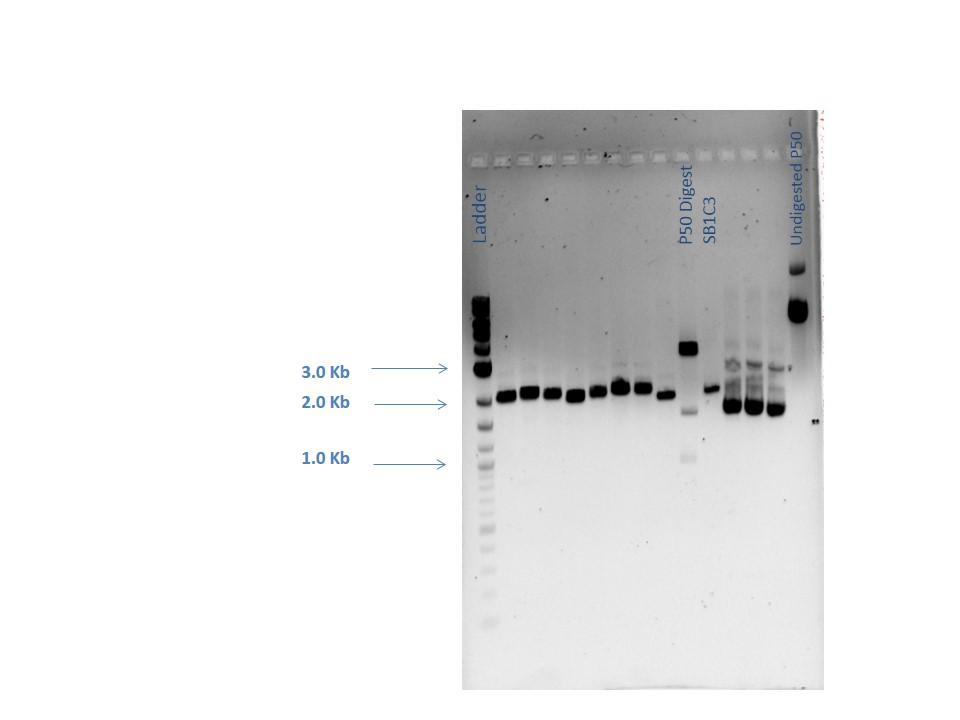
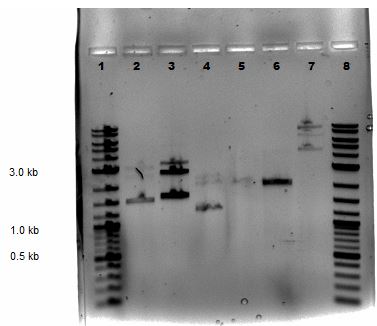
Samples from the digestion reaction were run on a 1% agarose gel (shown below). From these results, it appears that none of the Gibson Assembly colonies contain the correct products.
| Lane | Sample |
|---|---|
| 1 | 2-Log DNA Ladder |
| 2 | GA1 |
| 3 | GA2 |
| 4 | GA3 |
| 5 | GA4 |
| 6 | GA5 |
| 7 | GA6 |
| 8 | GA7 |
| 9 | GA8 |
| 10 | P50 Digest |
| 11 | SB1C3 |
| 12 | Undigested GA1 |
| 13 | Undigested GA2 |
| 14 | Undigested GA3 |
| 15 | Undigested P50 |
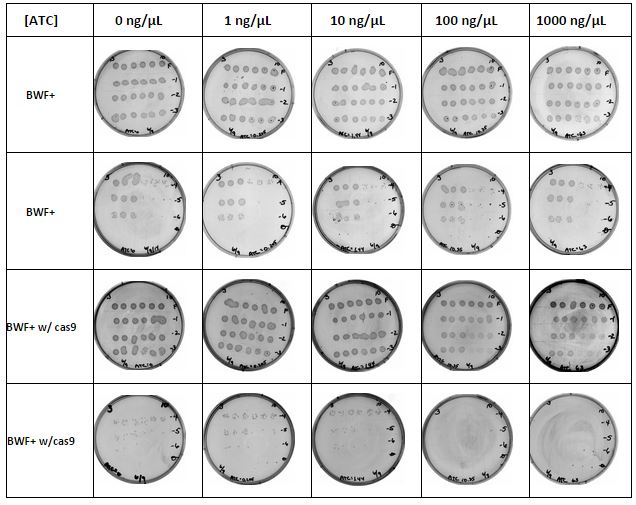
Working stock of ATC was made and filter sterilized which was used to remake the ATC plates for the titration experiment. Working stock of ATC was made and filter sterilized which was used to remake the ATC plates for the titration experiment. 20 plates were made with ? containing Kan and ? containing Amp and Kan. The plates were made with increasing amounts of ATC.
gRNAs from cPEC were transformed and plated according to protocol with controls.
AmilCP restriction digestion was performed on the original and PCR amplified samples and the products run on a 1% agarose gel as shown below:
| Reactants | PCR AmilCP | Original AmilCP |
|---|---|---|
| Buffer 3 | 1.25 ?L | 1.25 ?L |
| BxsI | 1.0 ?L | 2.5 ?L |
| DNA (125 ng) | 4.0 ?L | 1.25 ?L |
| Nuclease Free H2O | 6.25 ?L | 7.5 ?L |
| Final Reaction Volume | 12.5 ?L | 12.5 ?L |
6/10/14
cPEC was performed to join the gRNA (as primer dimers) with the p51 plasmid and AmilCP.
First, primers had to be dimerized. Master mixes of all gRNA primers were created and aliquots made by adding 5 ?L of each to 40 ?L nuclease free H2O (N.F. H2O). Two separate primer mixes were made (one for p51 and one for AmilCP) using 5 ?L of each forward and reverse primer dimer that were added to 40 ?L of N.F. H2O to produce a dilution (1:1:8). 5 ?L of each primer mix was added to 25 ?L of the Q5 master mix and 20 ?L N.F. H2O to make a 50 ?L total reaction for each sample.Products were checked by gel electrophoresis (shown below).
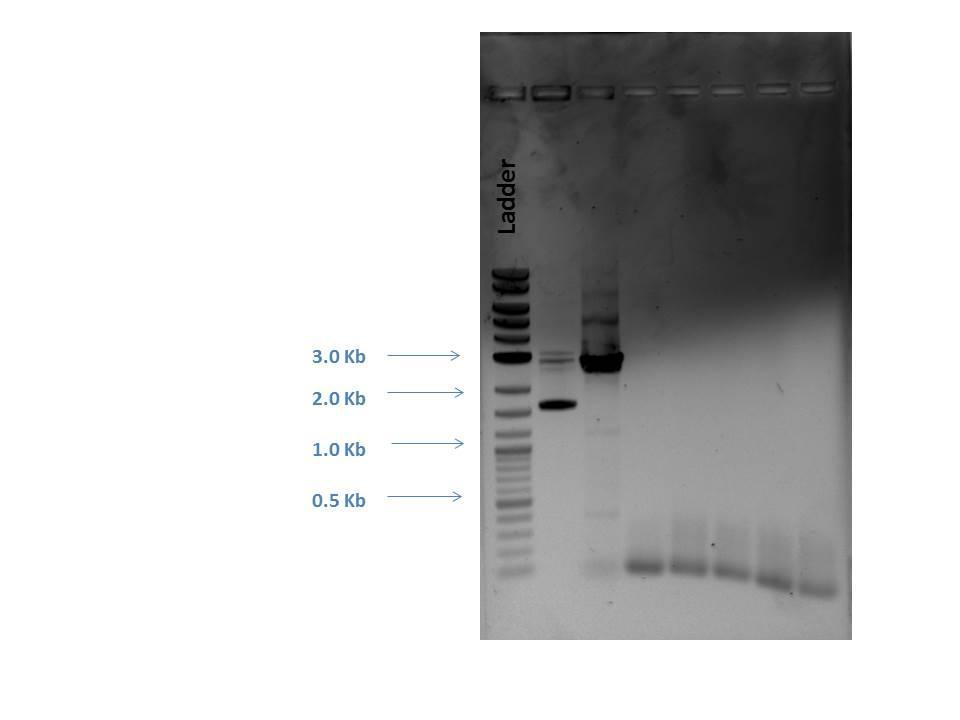
Next, a gel purification of a PCR P51 product was performed (to select for linear DNA). This product was digested with DpnI. A PCR cleanup was made of other P51 product that was not gel extracted. All of these steps were done following their recommended protocols.
Finally, cPEC reaction was done to combine the gel extracted P51 product with each of the gRNAs using the following amounts. The thermocycler set the same as on 6/3/14:
| Reactants | Volume |
|---|---|
| Q5 Master Mix | 25.0 ?L |
| Primer Mix | 2.5 ?L |
| DNA (1:10 dilution) | 1.0 ?L |
| Nuclease Free H2O | 25.5 ?L |
| Final Reaction Volume | 54.0 ?L |
| _t | |
| Following the cPEC reactions, Nanodrops were taken to assess the concentration and purity of the samples: |
P51 416.9 1.82 0.67 AmilCP 430.5 1.82 0.67 158 472.2 1.80 0.73 756 479.6 1.78 0.73 666 475.8 1.80 0.73 729 485.4 1.79 0.75 SC1 464.6 1.80 0.73 SC2 475.1 1.80 0.74
| Titration Experiment: Done to determine the optimal concentration of anhydrous tetracycline (ATC) to be used and to determine if the cas9 protein was lethal to the cells. The plan is to make 50 mL of BWF+ w/cas9 and BWF+ w/o cas9 with a starting OD600 of 0.05. These will be placed in an incubator and allowed to grow until reaching 0.5. They will then be diluted again to 0.05 (in 50 mL). Serial dilutions will be made and plated on the prepared plates which will be incubated overnight. | |
| Starting ODs were taken of a 1:10 dilution from liquid cultures grown overnight. This was used to calculate the amount to be added to 50 mL LB to start the experiment with an OD close to 0.05. ODs were taken periodically as the cells grew as shown below. | |
BWF+ 0.544 460 ?L BWF+ w/cas9 0.556 450 ?L
T0 0.059 0.058 T1 0.081 0.078 T2 0.180 0.168 T3 0.291 0.272 T4 0.398 0.366 T5 0.538 0.489 T6* 0.968 0.874 T7 0.165 0.153 T8 0.414 0.396 T9† 0.561 0.490 T10 0.057 0.056
GE P51 13.7 1.94 1.18 GE AmilCP PCR 27.3 1.81 1.19 GE cas9 PCR 7.8 1.98 0.62 AmilCP DpnI digest 644.8 1.6 0.65 P50 PCR 493.9 1.8 0.73 GA1 MP 107.9 1.87 1.99 GA2 MP 144.9 1.88 2.11 GA3 MP 168.3 1.92 2.29 GA4 MP 131.1 1.91 1.93 GA5 MP 310.6 1.88 2.34 729-1 125.3 1.88 2.11 729-2 178.3 1.90 2.17 729-3 172.6 1.84 1.81 756-1 420.7 1.87 2.25 756-2 106.8 1.89 1.99
| 6/12/14 | |
| Transformations done of all 6 gRNA cPEC reactions, P50 (+control), and P51 PCR (-control) | |
| Gel extraction of Cas9 done to protocol followed by a nanodrop (results below). | |
Cas9 5.5 2.12 0.59
| P50 PCR amplification performed using the following amounts: | |
| - | 25 ?L Master Mix |
| - | 2.5 ?L of forward primer (10 ?M) |
| - | 2.5 ?L of reverse primer (10 ?M) |
| - | 1.0 ?L DNA (1:50 dilution) |
| - | 19.0 ?L NF H2O |
| Two samples prepared with different thermocycler settings as follows: | |
Initial Denature 98°C/30 sec 98°C/2 min Denature 98°C/30 sec 98°C/30 sec Anneal 69°C/30 sec 68°C/30 sec Extend 72°C/3.5 min 72°C/5.5 min
- of cycles 34 30
Final Extension 72°C/2 min 72°C/5 min
| Overnight cultures prepared on GA1-GA5, 729-1, 729-2, 729-3, and 759-1, 759-2 |
| Colonies taken from SC1 plate for overnight cultures (SC-1, SC-2) with 5 mL LB, 10 ?L Amp (50 ng/mL) |
| 6/13/14 |
| Mini-prep done on O/N cultures SC1-1 and SC1-2 followed by a nanodrop. Remainder of culture was spun down into a pellet and frozen. |
SC1-1 30.7 2.02 2.06 SC1-2 32.5 1.94 1.48
_t
Restriction Digestion done following manufacturer’s protocols on the samples as listed below. All were incubated at 37°C for 1 hour followed by 20 minute heat inactivation at 80°C.
| Sample | Buffer 3 | 10X BSA | Enzyme 1 | Enzyme 2 | Enzyme Mix* | DNA (200 ng) | MQ H2O | Total Volume |
|---|---|---|---|---|---|---|---|---|
| 756-1 | 2.0 ?L | 2.0 ?L | 0.5 ?L EagI | 0.5 ?L XbaI | -- | 1.0 ?L | 14.0 ?L | 20.0 ?L |
| 756-2 | 2.0 ?L | 2.0 ?L | 0.5 ?L EagI | 0.5 ?L XbaI | -- | 1.87 ?L | 13.13 ?L | 20.0 ?L |
| GA1 | 2.0 ?L | 2.0 ?L | -- | -- | 1.0 ?L | 1.85 ?L | 13.15 ?L | 20.0 ?L |
| GA2 | 2.0 ?L | 2.0 ?L | -- | -- | 1.0 ?L | 1.38 ?L | 13.62 ?L | 20.0 ?L |
| GA3 | 2.0 ?L | 2.0 ?L | -- | -- | 1.0 ?L | 1.19 ?L | 13.81 ?L | 20.0 ?L |
| GA4 | 2.0 ?L | 2.0 ?L | -- | -- | 1.0 ?L | 1.53 ?L | 13.47 ?L | 20.0 ?L |
| GA5 | 2.0 ?L | 2.0 ?L | -- | -- | 1.0 ?L | 0.64 ?L | 14.36 ?L | 20.0 ?L |
| P51 | 2.0 ?L | 2.0 ?L | -- | -- | 1.0 ?L | 4.0 ?L | 11.0 ?L | 20.0 ?L |
| Cas9 | 2.0 ?L | 2.0 ?L | -- | -- | 1.0 ?L | 2.0 ?L | 13.0 ?L | 20.0 ?L |
- Enzyme Mix is a 1:1:23 dilution of EcoRI and BamHI
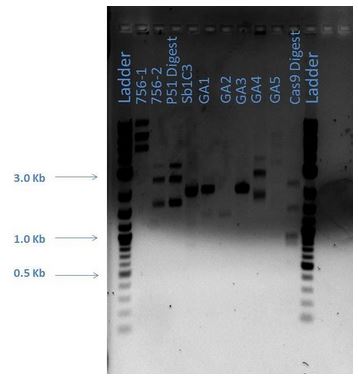
Digested products are run on a 1% agarose gel. The following lists the sample loaded into each lane.
| Lane | Sample |
|---|---|
| 1 | 2-Log DNA Ladder |
| 2 | 756-1 |
| 3 | 756-2 |
| 4 | P51 Digest |
| 5 | Sb1C3 |
| 6 | GA1 |
| 7 | GA2 |
| 8 | GA3 |
| 9 | GA4 |
| 10 | GA5 |
| 11 | Cas9 Digest |
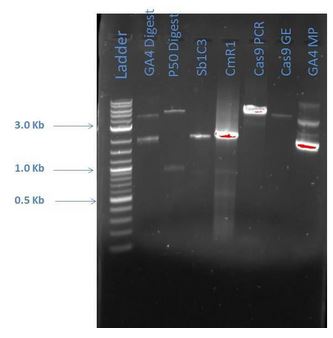
From the above gel, it does not appear that are products are as expected. A repeat digest is done of GA4 and P50. These new products were run on a 1% agarose gel with reagents as comparisons (5 ?L sample plus 1 ?L loading dye for each) as shown below:
| Lane | Sample |
|---|---|
| 1 | 2-Log DNA Ladder |
| 2 | GA4 |
| 3 | P50 Digest |
| 4 | Sb1C3 |
| 5 | CmR1 |
| 6 | Cas9 PCR |
| 7 | Cas9 GE |
| 8 | GA4 MP |
6/14/14
Gibson Assembly performed both with and without 2% DMSO. Each 20 ?L reaction contained 10 ?L Gibson Master Mix with the following as listed:
Reaction #1
- 6.5 ?L GE Cas9
- 3.5 ?L GE AmilCP
Reaction #2 - 1 ?L P50 PCR Product (1:10) - 5 ?L GE AmilCP - 4 ?L MQ H2O
Reaction #3 - 1 ?L P50 PCR Product (1:10) - 5 ?L GE AmilCP - 4 ?L 1:10 dilution of 2% DMSO Bacterial Transformation: Done according to protocol - GA1-GA3 diluted 1:4 transformed with 2 ?L (100 ?L each) - BWF+ w/Cas9 from S.B. (25 ?L full strength and 25 ?L 1:10 dilution) - BWF+ (25 ?L full strength and 25 ?L 1:10 dilution) - NEB competent cells with P51 (50 ?L) - Competent cells with P51 (50 ?L) for comparison
Week 6
6/15/14
GA colonies picked for overnight cultures from 2 plates (11 total- 3 from Plate 1, 8 from plate 2), placed in 5 mL LB with 170 ng/ ?L Amp.
6/16/14
Mini-prep was done to protocol on all overnight cultures followed by a nanodrop with results listed below:
| Sample | ng/ ?L | 260/280 | 260/230 |
|---|---|---|---|
| 1-1 | 17.5 | 2.08 | 1.94 |
| 1-2 | 54.1 | 1.93 | 1.96 |
| 1-3 | 30.4 | 2.00 | 1.78 |
| 2-1 | 45.8 | 1.93 | 1.90 |
| 2-2 | 45.4 | 1.92 | 1.89 |
| 2-3 | 46.9 | 1.93 | 1.97 |
| 2-4 | 53.5 | 1.96 | 2.01 |
| 2-5 | 53.5 | 1.94 | 2.04 |
| 2-6 | 41.9 | 1.95 | 1.84 |
| 2-7 | 59.3 | 1.94 | 1.99 |
| 2-8 | 46.5 | 1.94 | 1.98 |
Next, a restriction digest was performed on all the samples listed above. EcoRV was used in a 1:100 dilution with Buffer D (both from Promega). Samples were incubated for 1 hour at 37°C and heat inactivation performed for 5 minutes at 80°C. The following amounts were used for all the samples except 1-1 (DNA increased to 6.0 ?L and MQ H2O was not added). - 1.0 ?L Buffer D - 3.0 ?L Enzyme - 3.0 ?L sample DNA - 3.0 ?L MQ H2O - Total Reaction Volume = 10 ?L
Digested products are run on a 1% agarose gel. The following lists the sample loaded into each lane.
| Lane | Sample |
|---|---|
| 1 | 2-Log DNA Ladder |
| 2 | 1-1 |
| 3 | 1-2 |
| 4 | 1-3 |
| 5 | 2-1 |
| 6 | 2-2 |
| 7 | 2-3 |
| 8 | 2-4 |
| 9 | 2-5 |
| 10 | 2-6 |
| 11 | 2-7 |
| 12 | 2-8 |
Repeated digestion (protocol above) on select samples to run again for more definition on gel. Samples are run on a 1% agarose gel. The following lists the sample loaded into each lane.
| Lane | Sample |
|---|---|
| 1 | 2-Log DNA Ladder |
| 2 | 1-1 |
| 3 | 1-2 |
| 4 | 2-1 |
| 5 | sb1c3 |
| 6 | Digested sb1c3 |
| 7 | Digested p50 |
| 8 | 2-Log DNA Ladder |
Bacterial Transformation: Done according to protocol
- 7 CPEC products including p51 as the negative control (10 ?L 1:4 dilution) with 40 ?L DH5? - BWF+ w (40?L)/ S.B. cas9 (1 ?L) - BWF+ (1 ?L)
Gibson Assembly products 1-1 thru 1-8 and 2-1 thru 2-3 pelleted down and frozen
6/17/14
| Sample | Buffer | Enzyme 1 | EnzymeMix* | DNA (200 ng) | MQ H2O | Total Volume |
|---|---|---|---|---|---|---|
| GA x 1-1 | 1.0 ?L cutsmart | 3.0 ?L XbaI (1:50) | -- | 3.0 ?L | 3.0 ?L | 10.0 ?L |
| GA x 1-2 | 1.0 ?L cutsmart | 3.0 ?L XbaI (1:50) | -- | 3.0 ?L | 3.0 ?L | 10.0 ?L |
| GA x 2-1 | 1.0 ?L cutsmart | 3.0 ?L XbaI (1:50) | -- | 3.0 ?L | 3.0 ?L | 10.0 ?L |
| p50 linear | 1.0 ?L cutsmart | 3.0 ?L SepI (1:50) | -- | 3.0 ?L | 3.0 ?L | 10.0 ?L |
| GA H 1-1 | 1.0 ?L Fast green digest | -- | 3.0 ?L | 3.0 ?L | 3.0 ?L | 10.0 ?L |
| GA H 1-2 | 1.0 ?L Fast green digest | -- | 3.0 ?L | 3.0 ?L | 3.0 ?L | 10.0 ?L |
| GA H 2-1 | 1.0 ?L Fast green digest | -- | 3.0 ?L | 3.0 ?L | 3.0 ?L | 10.0 ?L |
| p50 | 1.0 ?L Fast green digest | -- | 3.0 ?L | 3.0 ?L | 3.0 ?L | 10.0 ?L |
- Enzyme mix: 1:1:23 dilution of xhoI and HindIII
Digested products are run on a 1% agarose gel. The following lists the sample loaded into each lane.
| Lane | Sample |
|---|---|
| 1 | 2-Log DNA Ladder |
| 2 | GA x 1-1 |
| 3 | GA x 1-2 |
| 4 | GA x 2-1 |
| 5 | p50 |
| 6 | sb1c3 |
| 7 | GA H 1-1 |
| 8 | GA H 1-2 |
| 9 | GA H 2-1 |
| 10 | p50 |
| 11 | 2-Log DNA Ladder |
6/18/14
Colony PCR is used to rapidly screen colonies from cPEC reactions. A colony is pricked using a pipette tip, avoiding scooping up any LB agar since this inhibits the PCR reaction. There are ~10^9 cells are in each colony - just barely touching the colony and transferring a tiny fraction of it is more than sufficient for this reaction. This tip is rubbed into the PCR tube . Tips were then ejected into 3ml LB+AMP for O/N culture.The following was added to each tube to make a 25 ?L reaction. - 12.5 ?L 2X Master Mix - 1.25 ?L of forward primer (10 ?M) - 1.25 ?L of reverse primer (10 ?M) - 10.0 ?L MQ H2O
For this reaction, the thermocycler was programmed as follows (note the longer time to initially lyse the cells and denature the DNA).
| Initial Denature | 98°C/10 min |
|---|---|
| Denature | 98°C/30 sec |
| Anneal | 65°C/30 sec |
| Extend | 72°C/30 sec |
| # of cycles | 35 |
| Final Extension | 72°C/5 min |
6/19/14 Glycerol stocks done to protocol for two colonies from each gRNA that were indicated positive by colony PCR results.
Week 7
6/23/14 Chemically competent cells of SBcas9 • BWF+. Done according to protocol.
6/25/14 Mini prep done to protocol on CPEC products.
Nanodrops were taken to assess the concentration and purity of the samples:
| Sample | ng/ ?L | 260/280 | 260/230 |
|---|---|---|---|
| 2H | 65.2 | 1.88 | 2.21 |
| 3E | 56.3 | 1.91 | 2.01 |
| 4E | 38.9 | 1.93 | 2.22 |
| 5B | 54.1 | 1.86 | 1.54 |
| 6B | 69.4 | 1.88 | 2.12 |
| 7B | 66.6 | 1.82 | 1.56 |
| 8B | 69.7 | 1.83 | 1.75 |
| 9B | 61.1 | 1.89 | 1.81 |
| 10C | 52.2 | 1.86 | 1.65 |
| 11B | 43.9 | 1.86 | 1.33 |
| 12B | 57.5 | 1.83 | 1.53 |
Sequencing 12 CPEC products: 12.5 ?L DNA + 2.5 ?L 10?m primer (CRE22)
| CPEC product | |
|---|---|
| 1 | 1A |
| 2 | 1C |
| 3 | 2B |
| 4 | 2C |
| 5 | 3B |
| 6 | 3H |
| 7 | 4C |
| 8 | 4D |
| 9 | 5E |
| 10 | 5F |
| 11 | 6C |
| 12 | 6F |
6/26/14 Sequencing: Total volume 0f 15 ?L
| CPEC Product | DNA ?L | Primer CRE22 | MQ H2O | |
|---|---|---|---|---|
| 1 | 2B | 12.5?L | 2.5 ?L | -- |
| 2 | 2C | 12.0?L | 2.5?L | 0.5?L |
| 3 | 3B | 10.3?L | 2.5?L | 2.2?L |
| 4 | 3H | 11?L | 2.5?L | 1.5?L |
| 5 | 4E | 12.5?L | 2.5?L | -- |
| 6 | 5E | 11.3?L | 2.5?L | 1.2?L |
| 7 | 11B | 12.5?L | 2.5?L | -- |
| 8 | 2H | 8?L | 2.5?L | 4.5?L |
| 9 | 6B | 8?L | 2.5?L | 4.5?L |
| 10 | 7B | 8?L | 2.5?L | 4.5?L |
| 11 | 8B | 8?L | 2.5?L | 4.5?L |
| 12 | 9B | 8?L | 2.5?L | 4.5?L |
| 13 | 4C | 8?L | 2.5?L | 4.5?L |
| 14 | 3E | 10?L | 2.5?L | 2.5?L |
| 15 | 5B | 10?L | 2.5?L | 2.5?L |
| 16 | 10C | 10?L | 2.5?L | 2.5?L |
| 17 | 12B | 10?L | 2.5?L | 2.5?L |
Bacterial Transformation of SBcas9• ER: Done according to protocol.
6/27/14 Mini prep done to protocol on CPEC products. Nanodrops were taken to assess the concentration and purity of the samples:
| Sample | ng/ ?L | 260/280 | 260/230 |
|---|---|---|---|
| 1A | 66.9 | 1.90 | 2.26 |
| 1C | 61.3 | 1.92 | 2.20 |
| 2B | 57.8 | 1.91 | 2.27 |
| 3B | 69.4 | 1.88 | 1.14 |
| 3H | 51.7 | 1.89 | 2.24 |
| 9B | 33.6 | 1.99 | 1.62 |
| 10C | 49.8 | 1.93 | 2.09 |
| 11B | 40.5 | 1.94 | 2.01 |
| 12B | 51.9 | 1.89 | 1.17 |
Sequenced all of the above products (total volume of 15 ?L: 10 ?L DNA+ 2.5 ?Lprimer (CRE22)+2 .5 ?L MQ H2O Exceptions: -9B received 12.5 ?L DNA + 2.5 ?L primer (CRE22) -12B received p51 seq1 as the primer
Glycerol stock of all the above samples to protocol: 1:1 w/ 40% glycerol for a total volume of 500 ?L each.
Positive sequencing results: 1A, 1C, 2B, 3B, 3H, 9B, 10C, 11B, 12B
Bacterial Transformation of SBcas9• ER and PUC19 as the positive control: Done according to protocol.
Prepared 5mL O/N cultures in LB+AMP of colonies selected from glycerol stocks
Mini preps done to protocol on the below samples Nanodrops were taken to assess the concentration and purity of the samples:
| Sample | ng/ ?L | 260/280 | 260/230 |
|---|---|---|---|
| 1A | 78.7 | 1.90 | 2.08 |
| 1C | 54.3 | 1.88 | 1.76 |
| 2B | 335.4 | 1.48 | 0.91 |
| 3B | 52.1 | 1.91 | 1.96 |
| 3H | 59.7 | 1.89 | 2.03 |
Week 8
6/30/14 Bacterial Transformation of BWF+ w/ 158, 723, SC1, p51: Done according to protocol.
7/1/14
Nanodrops were taken to assess the concentration of the samples to use in a cPEC reaction.
| Sample | ng/ ?L |
|---|---|
| p50 Amplicon | 27.3 |
| GE AmilCP | 493.9 |
- Gel extracted
cPEC performed to combine the p50 amplicon with AmilCP following the cPEC protocol and using the following amounts:
| Reactants | Volume |
|---|---|
| Q5 Master Mix | 12.5 ?L |
| Insert (AmilCP) | 5 ?L |
| Template DNA p50 | 2.0 ?L (1:20 dilution) |
| 25% DMSO | 2.0 ?L |
| Nuclease Free H2O | 3.5 ?L |
| Final Reaction Volume | 25.0 ?L |
Thermocycler conditions:
| cPEC | |
|---|---|
| Initial Denature | 98°C/30 sec |
| Denature | 98°C/10 sec |
| Anneal | 60°C/30 sec |
| Extend | 72°C/105 sec |
| # of cycles | 10 |
| Final Extension | 72°C/10 min |
Successful Bacterial Transformation of BWF+ w/ 158, 723, SC1, p51 (from 6/30) . O/N cultures of each were then made.
7/4/14 Electroporation of p50 amplicon • AmilCP with Marcello 7/7/14 Electroporation was unsuccessful. Redone using Bacterial Transformation done to protocol. Primer design for qPCR Streaked p50 on plate Week 9 7/8/14 mini prepped p50 done to protocol Colony PCR done to protocol on the p50+AmilCP transformation product . Selected 12 colonies. *PCR tube lids opened in thermocycler for samples: 8, 12, and positive control Colony PCR products are run on a 1% agarose gel. The following lists the sample loaded into each lane.
| Lane | Sample |
|---|---|
| 1 | 2-Log DNA Ladder |
| 2 | 1 |
| 3 | 2 |
| 4 | 3 |
| 5 | 4 |
| 6 | 5 |
| 7 | 6 |
| 8 | 7 |
| 9 | 8 |
| 10 | 9 |
| 11 | 10 |
| 12 | 11 |
| 13 | 12 |
| 14 | (+) control |
| 15 | (-) control |
7/9/14 Mini prepped colony PCR samples: 1,7,8,10,11, and p50 Followed by nanodrop with results listed below:
| Sample | ng/ ?L | 260/280 | 260/230 |
|---|---|---|---|
| 1 | 89 | 1.90 | 2.22 |
| 7 | 110.9 | 1.88 | 2.22 |
| 8 | 134.4 | 1.85 | 1.77 |
| 10 | 140.9 | 1.87 | 2.10 |
| 11 | 93.6 | 1.89 | 2.21 |
| p50 | 191.7 | 1.87 | 2.35 |
The above samples (except 8) were sent for sequencing. Total volume 0f 15 ?L
| Product | DNA ?L | Primer CRE22 | MQ H2O | |
|---|---|---|---|---|
| 1 | 1 | 6.0?L | 5.0 ?L | 4.0?L |
| 2 | 7 | 5.0?L | 5.0?L | 5.0?L |
| 3 | 10 | 4.0?L | 5.0?L | 6.0?L |
| 4 | 11 | 6.0?L | 5.0?L | 4.0?L |
Transformation done to protocol on all gRNAs into BWF+
7/10/14 Site directed Mutagenesis (SDM) performed on original p50, 1, 7, 10, 11 to remove Xba1 from p50 Primer names: p50TetRXba1F and p50TetRXba1R Primer Mix: 1 ?L forward + 1 ?L reverse + 18 ?L MQ H2O
PCR run on the following samples of p50: p50 DNA dilution for original, 1,7,10, and 11 p50 DNA sample original- 1:38 dilution p50 DNA sample 1- 1:18 dilution p50 DNA sample 7- 1:22 dilution p50 DNA sample 10- 1:28 dilution p50 DNA sample 11- 1:19 dilution
| Reactants | Volume |
|---|---|
| Q5 Master Mix | 12.5 ?L |
| 10 ?M primer mix | 2.5 ?L |
| DNA p50 | 2.0 ?L |
| Nuclease Free H2O | 8.0 ?L |
| Final Reaction Volume | 25.0 ?L |
Thermocycler conditions:
| Initial Denature | 98°C/30 sec |
| Denature | 98°C/30 sec |
| Anneal | 55°C/30 sec |
| Extend | 72°C/3.5 minutes |
| # of cycles | 15 cycles |
| Final Extension | 72°C/5 minutes |
SDM performed on 6 gRNAs and the original p51 to remove spe1 site
PCR preformed:
| Reactants | Volume |
|---|---|
| Q5 Master Mix | 12.5 ?L |
| 10 ?M primer mix | 2.5 ?L |
| DNA p51 | 2.0 ?L |
| Nuclease Free H2O | 8.0 ?L |
| Final Reaction Volume | 25.0 ?L |
- primer mix: 1 ?L forward primer+ 1 ?L reverse primer +18 ?L MQH2O. Primers varied for each gRNA
- control consisted of DNA only, no primers
Thermocycler conditions:
| Initial Denature 98 | 95°C/30 sec |
| Denature 98 | 95°C/30 sec |
| Anneal 55 | 55°C/1min |
| Extend 72 | 68°C/3min |
| # of cycles | 15 cycles |
| Final Extension 72 | 3 min |
7/11/2014
All PCR gRNAs DPN1 digested: 1. Add 1 ?l of the Dpn I restriction enzyme (10 U/?l) directly to each amplification reaction below the mineral oil overlay. 2. Gently and thoroughly mix each reaction mixture by pipetting the solution up and down several times. Spin down the reaction mixtures in a microcentrifuge for 1 minute and immediately incubate each reaction at 37°C for 1 hour to digest the parental (i.e., the nonmutated) supercoiled dsDNA.
Transformation done to protocol for all gRNAs into DH5?. Full volume (250?l) plated onto Amp plates and incubated o/n. Week 10 7/16 O/N cultures of SDM gRNA p51 (4 colonies) and SC1 (2 colonies) 7/17 Mini prepped all p51 and SC1 cultures to protocol and then nano dropped:
| Sample | ng/ ?L | 260/280 | 260/230 |
|---|---|---|---|
| p51 (1) | 62.5 | 1.90 | 1.65 |
| p51(2) | 87.2 | 1.95 | 2.20 |
| p51(3) | 112.7 | 1.81 | 1.34 |
| p51(4) | 67.1 | 1.92 | 2.24 |
| sc1 (1) | 126.5 | 1.83 | 1.48 |
| sc1(2) | 101.9 | 1.88 | 1.84 |
Restriction digest done to protocol:
| Sample | Buffer Green Fast Digest | Enzyme Mix* | DNA | ||
|---|---|---|---|---|---|
| (200 ng) | MQ H2O | Total | |||
| Volume | |||||
| p51 (1) | 1.0 ?L | 1.0 ?L | 3.0 ?L | 5.0 ?L | 10.0 ?L |
| p51 (2) | 1.0 ?L | 1.0 ?L | 2.0 ?L | 6.0 ?L | 10.0 ?L |
| p51 (3) | 1.0 ?L | 1.0 ?L | 2.0 ?L | 6.0 ?L | 10.0 ?L |
| p51 (4) | 1.0 ?L | 1.0 ?L | 3.0 ?L | 5.0 ?L | 10.0 ?L |
| SC1 (1) | 1.0 ?L | 1.0 ?L | 2.0 ?L | 6.0 ?L | 10.0 ?L |
| SC1 (2) | 1.0 ?L | 1.0 ?L | 2.0 ?L | 6.0 ?L | 10.0 ?L |
- Enzyme Mix contains 1.0 ?L Spe1 + 1.0 ?L BgI1 + 23.0 ?L mqH2O
Samples evaporated after digesting to a total volume of around 4 ?L
Run on a 1% Gel. The following lists the sample loaded into each lane.
| Lane | Sample |
|---|---|
| 1 | 2-Log DNA Ladder |
| 2 | SDM p51 (1) |
| 3 | SDM p51 (3) |
| 4 | SDM SC1 (1) |
| 5 | SDM SC1 (2) |
| 6 | Blank |
| 7 | SDM P51 (4) |
7/19/2014 PCR amplify p50
| Reactants | Volume |
|---|---|
| Q5 Master Mix | 12.5 ?L |
| 10 ?M forward primer | 1.5 ?L |
| 10 ?M reverse primer | 1.5 ?L |
| DNA p50 (1:50) | 1.0 ?L |
| Nuclease Free H2O | 9.0 ?L |
| Final Reaction Volume | 25.0 ?L |
7/21/2014
Restriction digest same gRNAs again
| Sample | Buffer cutsmart | Enzyme Xbal | Enzyme Spe1 | DNA | ||
|---|---|---|---|---|---|---|
| (200 ng) | MQ H2O | Total | ||||
| Volume | ||||||
| p51 (1) | 2.0 ?L | 1.0 ?L | 1.0 ?L | 3.2 ?L | 12.8 ?L | 20.0 ?L |
| p51 (2) | 2.0 ?L | 1.0 ?L | 1.0 ?L | 2.3 ?L | 13.7 ?L | 20.0 ?L |
| p51 (3) | 2.0 ?L | 1.0 ?L | 1.0 ?L | 1.8 ?L | 14.2 ?L | 20.0 ?L |
| p51 (4) | 2.0 ?L | 1.0 ?L | 1.0 ?L | 3.0 ?L | 13.0?L | 20.0 ?L |
| SC1 (1) | 2.0 ?L | 1.0 ?L | 1.0 ?L | 1.6 ?L | 14.4 ?L | 20.0 ?L |
| SC1 (2) | 2.0 ?L | 1.0 ?L | 1.0 ?L | 2.0 ?L | 14.0?L | 20.0 ?L |
| P51 | 2.0 ?L | 1.0 ?L | 1.0 ?L | 4.0 ?L | 12.0?L | |
| P51 | 2.0 ?L | 1.0 ?L | 1.0 ?L | 4.0 ?L | 12.0?L | |
| p51 | 2.0 ?L | 1.0 ?L | 1.0 ?L | 4.0 ?L | 12.0?L |
Enzymes are used as a 1:25 dilution
Run on a 1% Gel. The results were still unclear, the following day samples were sent for sequencing.
Week 11
7/23/2014 Sent p51 SDM 1, 3, 4 and p51 original as a control for sequencing. Confirmation that SDM was successful and p51 no longer has the restriction site spe1 in the gRNA location.
Sequencing: Total volume 0f 15 ?L
| SDM Product | DNA ?L | Primer p51seq5 | MQ H2O | |
|---|---|---|---|---|
| 1 | SDM1p51 | 8.0?L | 2.5 ?L | 4.5?L |
| 2 | SDM3p51 | 4.4?L | 2.5?L | 8.1?L |
| 3 | SDM4p51 | 7.5?L | 2.5?L | 5.0?L |
| 4 | p51 control | 4.2?L | 2.5?L | 8.3?L |
Mini prepped 10 o/n cultures of SDM of p50. Done to protocol. Glycerol stocks make of all 10 cultures. Mini prepped previous gibson colonies 1 and 2. SDM of p51 for all samples were confirmed
Nanodrops were taken to assess the concentration and purity of the samples:
| Sample | ng/ ?L | 260/280 | 260/230 |
|---|---|---|---|
| p50 | 123.7 | 1.84 | 2.15 |
| SDM1 | 179.6 | 1.88 | 2.19 |
| SDM2 | 117.4 | 1.90 | 2.21 |
| SDM3 | 140.4 | 1.84 | 1.81 |
| SDM4 | 162.6 | 1.89 | 2.22 |
| SDM5 | 117.3 | 1.89 | 2.00 |
| SDM6 | 176.4 | 1.88 | 2.01 |
| SDM7 | 177.0 | 1.87 | 2.30 |
| SDM8 | 250.1 | 1.89 | 2.25 |
| SDM9 | 298.3 | 1.90 | 2.31 |
| SDM10 | 136.0 | 1.91 | 2.17 |
| Gibson1 | 110.8 | 1.89 | 2.14 |
| Gibson2 | 160.3 | 1.87 | 2.15 |
| _t | |||
| Restriction digest done to protocol: | |||
SDM p50 (1) 2.0 ?L 1.0 ?L 1.2 ?L 15.8 ?L 20.0 ?L SDM p50 (2) 2.0 ?L 1.0 ?L 2.0 ?L 15.0 ?L 20.0 ?L SDM p50 (3) 2.0 ?L 1.0 ?L 1.4 ?L 15.6 ?L 20.0 ?L SDM p50 (4) 2.0 ?L 1.0 ?L 1.2 ?L 15.8?L 20.0 ?L SDM p50 (5) 2.0 ?L 1.0 ?L 2.0 ?L 15.0 ?L 20.0 ?L SDM p50 (6) 2.0 ?L 1.0 ?L 1.2 ?L 15.8 ?L 20.0 ?L SDM p50 (7) 2.0 ?L 1.0 ?L 1.2 ?L 15.8?L 20.0 ?L SDM p50 (8) 2.0 ?L 1.0 ?L 1.0 ?L 16.0?L 20.0 ?L SDM p50 (9) 2.0 ?L 1.0 ?L 1.0 ?L 16.0?L 20.0 ?L SDM p50 (10) 2.0 ?L 1.0 ?L 1.5 ?L 15.5?L 20.0 ?L p50control 2.0 ?L 1.0 ?L 2.0 ?L 15.0?L 20.0 ?L
| *Enzyme Mix contains 1.0 ?L Spe1 + 1.0 ?L Xba1 + 48.0 ?L mqH2O |
| Restriction Digest for gibson done to protocol: |
(200 ng) MQ H2O Total Volume Gibson 1 2.0 ?L 1.0 ?L 2.0 ?L 15.0 ?L 20.0 ?L Gibson 2 2.0 ?L 1.0 ?L 1.2 ?L 15.8 ?L 20.0 ?L
| *EcoRv dilution (1:25) | ||
| Run on a 1% Gel. The following lists the sample loaded into each lane. |
1 2-Log DNA Ladder 2 SDM p50 (1) 3 SDM p50 (2) 4 SDM p50 (3) 5 SDM p50 (4) 6 SDM p50 (5) 7 SDM p50 (6) 8 SDM p50 (7) 9 SDM p50 (8) 10 SDM p50 (9) 11 SDM p50 (10) 12 p50 control 13 p50 undigested 14 Gibson 1 15 Gibson 2 16 sb1c3 17 blank
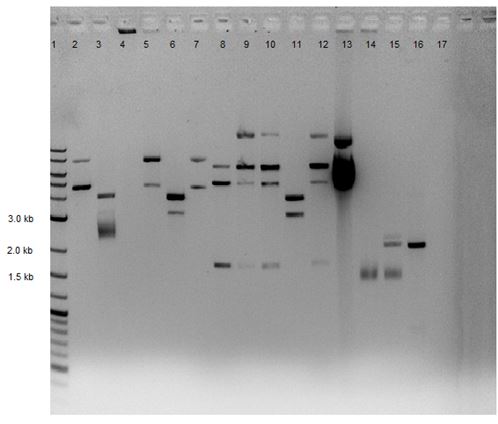
|
| 7/25/2014 |
| Restriction digest done to protocol: |
(250 ng) MQ H2O Total Volume SDM p50 (1) 2.0 ?L 1.0 ?L 1.5 ?L 20.0 ?L 25.0 ?L SDM p50 (2) 2.0 ?L 1.0 ?L 2.0 ?L 19.5 ?L 25.0 ?L SDM p50 (3) 2.0 ?L 1.0 ?L 1.8 ?L 19.7 ?L 25.0 ?L SDM p50 (4) 2.0 ?L 1.0 ?L 1.5 ?L 20.0?L 25.0 ?L SDM p50 (5) 2.0 ?L 1.0 ?L 2.0 ?L 19.5 ?L 25.0 ?L SDM p50 (6) 2.0 ?L 1.0 ?L 1.5 ?L 20.0 ?L 25.0 ?L SDM p50 (10) 2.0 ?L 1.0 ?L 2.0 ?L 19.5?L 25.0 ?L p50control 2.0 ?L 1.0 ?L 2.0 ?L 19.5?L 25.0 ?L
| *Enzyme mix: 5.5?L Xba1 + 5.5?L Spe1 for a total volume of 11?L | ||
| Run on a 1% Gel. Results were not as anticipated. Restriction Ligation was repeated. | ||
| Restriction Ligation | ||
(200 ng) MQ H2O Total Volume SDM p50 (1) 5.0 ?L -- 1.0 ?L -- 1.0 ?L 1.0 ?L 42.0 ?L 50.0 ?L SDM p50 (4) 5.0 ?L -- 1.0 ?L -- 1.0 ?L 1.0 ?L 42.0 ?L 50.0 ?L SDM p50 (6) 5.0 ?L -- 1.0 ?L -- 1.0 ?L 1.0 ?L 42.0 ?L 50.0 ?L Litimus28i 5.0 ?L -- -- 1.0 ?L 1.0 ?L 1.5 ?L 41.5?L 50.0 ?L Litimus+Ic3 5.0 ?L 1.0 ?L -- -- 1.0 ?L 0.8 ?L 42.2 ?L 50.0 ?L PsBGA1 (RFP) 5.0 ?L 1.0 ?L -- 1.0 ?L -- 3.8 ?L 39.2 ?L 50.0 ?L
| Sequenced SDMp50 was not the correct product, the above project did not continue. |
| 8/18/2014 |
| O/N cultures of MG, Bw+Kan, Bw-kan |
| 8/19/2014 |
| O/N cultures were all made competent according to protocol |
| O/D recordings: |
11:00 .042 .026 .071 11:34 .086 .035 .088 12:10 .239 .078 .223 12:20 .328 .098 .296 12:28 -- -- .325 12:47 -- .196 -- 1:10 -- .308 -- 1:15 -- .320 --
| The cells were all pulled at the time they were at an O/D nearest .325. All O/D’s were diluted to .30 |
| Once the cells were made competent they were transformed using a gRNA target, gRNA scramble, and a sb1c3 strain. |
 "
"
