 "
"
Team:SUSTC-Shenzhen/Modeling/Interlab
From 2014.igem.org
Zhangysh1995 (Talk | contribs) |
Zhangysh1995 (Talk | contribs) |
||
| Line 31: | Line 31: | ||
===Experiment I: Total RNA extraction, reverse transcription and qPCR=== | ===Experiment I: Total RNA extraction, reverse transcription and qPCR=== | ||
| - | ====Introduction==== | + | ===='''Introduction'''==== |
OD (Optical density) is the density of light absorbed by the E. coli culture, and it is directly proportional to culture density. We calculated culture volumes according to ratio of OD. After that we did reverse transcription and qPCR to identify mRNA of GFP in each sample for three replicates. | OD (Optical density) is the density of light absorbed by the E. coli culture, and it is directly proportional to culture density. We calculated culture volumes according to ratio of OD. After that we did reverse transcription and qPCR to identify mRNA of GFP in each sample for three replicates. | ||
| - | ====Materials==== | + | ===='''Materials'''==== |
StepOnePlus™ Real-Time PCR System (Life Technologies), E.Z.N.A.® Bacterial RNA Kit ( Omega bio-tek), GoScript™ Reverse Transcription System (Promega), SYBR® Select Mater Mix (Life Technologies) | StepOnePlus™ Real-Time PCR System (Life Technologies), E.Z.N.A.® Bacterial RNA Kit ( Omega bio-tek), GoScript™ Reverse Transcription System (Promega), SYBR® Select Mater Mix (Life Technologies) | ||
| - | ====Protocols==== | + | ===='''Protocols'''==== |
* RNA extration was done following instruction in the kit. Final concentration: | * RNA extration was done following instruction in the kit. Final concentration: | ||
<html><div class="table-responsive"></html> | <html><div class="table-responsive"></html> | ||
| Line 92: | Line 92: | ||
# All samples are run for three replicates. | # All samples are run for three replicates. | ||
| + | ===='''Results'''==== | ||
| + | {{SUSTC-Image|wiki/images/a/a4/Amplification_Plot_Rn_vs_Cycle.jpg|qPCR}} | ||
| + | Fig 1.1 Amplification plot for qPCR | ||
| + | {{SUSTC-Image|wiki/images/a/a5/SUSTC-Shenzhen_Inter-lab_Melt_Curve.jpg|qPCR}} | ||
| + | Fig 1.2 Melt curve for qPCR | ||
| + | {{SUSTC-Image|wiki/images/f/f9/SUSTC-Shenzhen_Inter-lab_Ct-forqPCR.png|qPCR}} | ||
| + | Fig 1.3 Ct for qPCR | ||
| + | |||
| + | '''Analysis''' | ||
| + | We took an experiment to find the relation between OD600 and bacterial number and knew that if OD600 is less than 1, OD600 is about a linear relation with the number of bacterial. | ||
| + | {{SUSTC-Image|wiki/images/1/17/SUSTC-Shenzhen_Inter-lab_OD%26Cell_number.jpg|qPCR}} | ||
| + | Fig 1.4 OD and Cell number | ||
{{SUSTC-Shenzhen/main-content-end}} | {{SUSTC-Shenzhen/main-content-end}} | ||
{{SUSTC-Shenzhen/wiki-footer}} | {{SUSTC-Shenzhen/wiki-footer}} | ||
{{SUSTC-Shenzhen/themeJs}} | {{SUSTC-Shenzhen/themeJs}} | ||
Revision as of 05:18, 6 October 2014
Inter-lab Study
Methods to test Fluorescence Density
Contents |
What is Inter-lab Study?
Inter-lab study is part of a new tack called Measurement this year. All team are encouraged to participate in it. See more details HERE(https://2014.igem.org/Tracks/Measurement/Interlab_study).
The aim of what we did is to get fluorescence statistics. To achieve this, we did four different sets of experiments:
- Total RNA extraction, reverse transcription and qPCR; (From transcription level)
- Measure with Fluorescence microscope and Image-Pro Plus 6.0 (IPP 6.0); (From protein expression level)
- Measure with Flow cytometry; (From protein expression level)
- Measuren with fluorescence spectrophotometer (From protein expression level)
Plasmid Construction
- 3A assembly was used to construct BBa_J23101 + BBa_E0240 and BBa_J23115 + BBa_E0240. Construction was completed on 9th, Aug. And samples were sent to be sequenced.
- We also tried to construction in Extra Credit Opportunity. But results of electrophoresis with BBa_J04450+BBa_J23101/J23115 show anther segments which we cannot figure out what it was until now.
Measurement
Experiment I: Total RNA extraction, reverse transcription and qPCR
Introduction
OD (Optical density) is the density of light absorbed by the E. coli culture, and it is directly proportional to culture density. We calculated culture volumes according to ratio of OD. After that we did reverse transcription and qPCR to identify mRNA of GFP in each sample for three replicates.
Materials
StepOnePlus™ Real-Time PCR System (Life Technologies), E.Z.N.A.® Bacterial RNA Kit ( Omega bio-tek), GoScript™ Reverse Transcription System (Promega), SYBR® Select Mater Mix (Life Technologies)
Protocols
- RNA extration was done following instruction in the kit. Final concentration:
| Sample name | I20260 | J23101 | J23115 |
|---|---|---|---|
| RNA concentration | 476.4ng/uL | 456.6ng/uL | 446.0ng/uL |
- Reverse Transcription
Step1:
| Sample name | I20260 | J23101 | J23115 |
|---|---|---|---|
| RNA | 2.10uL | 2.19uL | 2.24uL |
| Random primer | 1.00uL | 1.00uL | 1.00uL |
| dd Water | 1.90uL | 1.81uL | 1.76uL |
| Total | 5.00uL | 5.00uL | 5.00uL |
Incubated at 70℃ for 5 minutes, immediately put on ice for 5min, then centrifuge for 30 seconds, at last put on ice.
Step2: Using promega GoScriptTM Reverse Transcription System, incubated at 25℃ for 5 minues, then incubated at 42℃ at 60min, again at 70℃ for 15 minutes.
- qPCR
Holding Stage: 50.0℃ for 2min, 95℃ for 2min. Cycling Stage: 95℃ for 15sec, 55.0℃ for 15sec, 72.0℃ for 1 min; 40 cycles. Melt Curve Stage: 60.0℃ for 1min, 95℃ for 15sec.
- The gene coding Kanamycin is recognized as reference gene which is run in the qPCR.
- All samples are run for three replicates.
Results
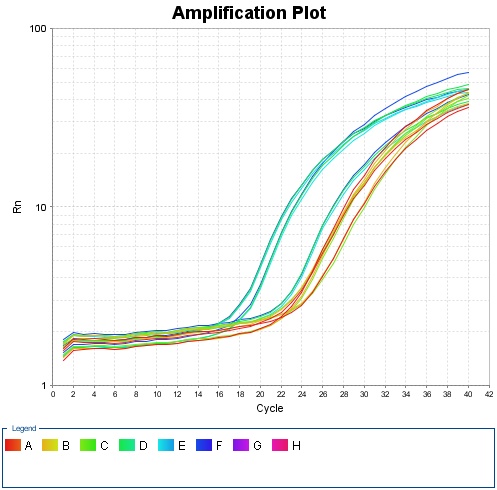
Fig 1.1 Amplification plot for qPCR
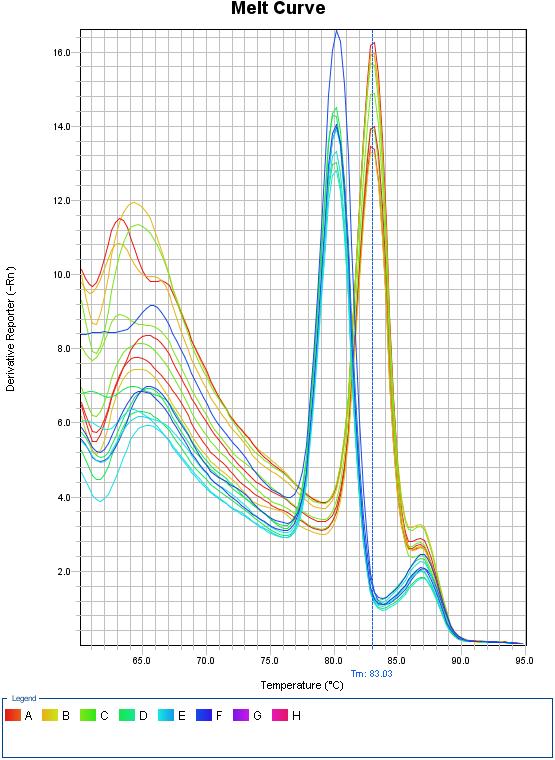
Fig 1.2 Melt curve for qPCR
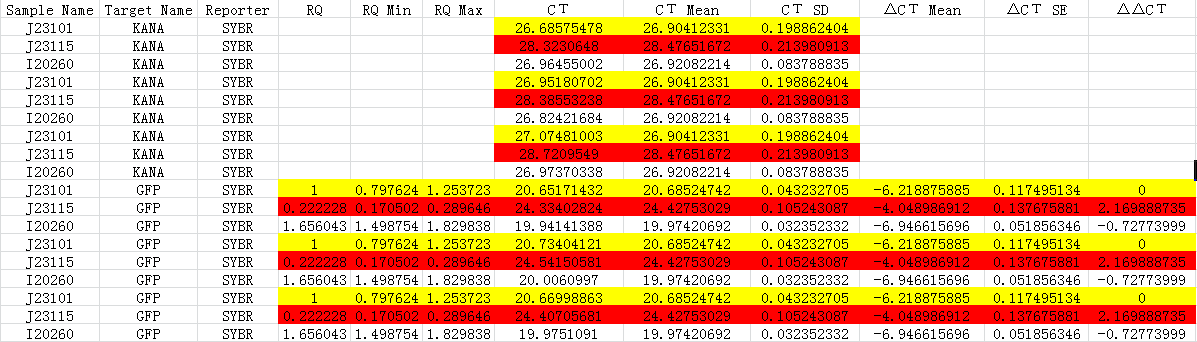
Fig 1.3 Ct for qPCR
Analysis
We took an experiment to find the relation between OD600 and bacterial number and knew that if OD600 is less than 1, OD600 is about a linear relation with the number of bacterial.
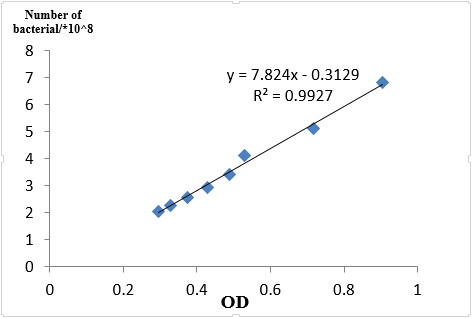
Fig 1.4 OD and Cell number