 "
"
Team:SUSTC-Shenzhen/Modeling/Interlab
From 2014.igem.org
Inter-lab Study
Methods to test Fluorescence Density
Contents |
What is Inter-lab Study?
Inter-lab study is part of a new tack called Measurement this year. All teams are encouraged to participate in it. See more details HERE(https://2014.igem.org/Tracks/Measurement/Interlab_study).
The aim of what we did is to get fluorescence statistics. To achieve this, we did four different sets of experiments:
- Total RNA extraction, reverse transcription and qPCR; (From transcription level)
- Measure with Fluorescence microscope and Image-Pro Plus 6.0 (IPP 6.0); (From protein expression level)
- Measure with Flow cytometry; (From protein expression level)
- Measure with fluorescence spectrophotometer (From protein expression level)
Plasmid Construction
- 3A assembly was used to construct BBa_J23101 + BBa_E0240 and BBa_J23115 + BBa_E0240. Construction was completed on 9th, Aug. And samples were sent to be sequenced.
- We also tried to construction in Extra Credit Opportunity. But results of electrophoresis with BBa_J04450+BBa_J23101/J23115 show anther segments which we cannot figure out what it was until now.
Measurement
Experiment I: Total RNA extraction, reverse transcription and qPCR
Introduction
OD (Optical Density) is the density of light absorbed by the E. coli culture, and it is directly proportional to culture density. We calculated culture volumes according to ratio of OD. After that we did reverse transcription and qPCR to identify mRNA of GFP in each sample for three replicates.
Materials
StepOnePlus™ Real-Time PCR System (Life Technologies), E.Z.N.A.® Bacterial RNA Kit ( Omega bio-tek), GoScript™ Reverse Transcription System (Promega), SYBR® Select Mater Mix (Life Technologies)
Protocols
- RNA extration was done following instruction in the kit. Final concentration:
| Sample name | I20260 | J23101 | J23115 |
|---|---|---|---|
| RNA concentration | 476.4ng/uL | 456.6ng/uL | 446.0ng/uL |
- Reverse Transcription
Step1:
| Sample name | I20260 | J23101 | J23115 |
|---|---|---|---|
| RNA | 2.10uL | 2.19uL | 2.24uL |
| Random primer | 1.00uL | 1.00uL | 1.00uL |
| dd Water | 1.90uL | 1.81uL | 1.76uL |
| Total | 5.00uL | 5.00uL | 5.00uL |
Incubated at 70℃ for 5 minutes, immediately put on ice for 5min, then centrifuge for 30 seconds, at last put on ice. Step2: Using promega GoScriptTM Reverse Transcription System, incubated at 25℃ for 5 minues, then incubated at 42℃ at 60min, again at 70℃ for 15 minutes.
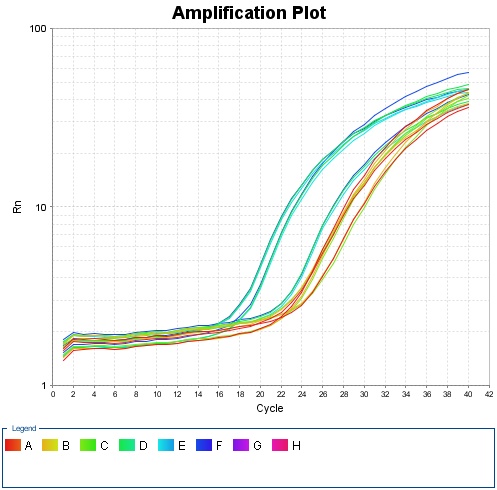
- qPCR
Holding Stage: 50.0℃ for 2min, 95℃ for 2min.
Cycling Stage: 95℃ for 15sec, 55.0℃ for 15sec, 72.0℃ for 1 min; 40 cycles.
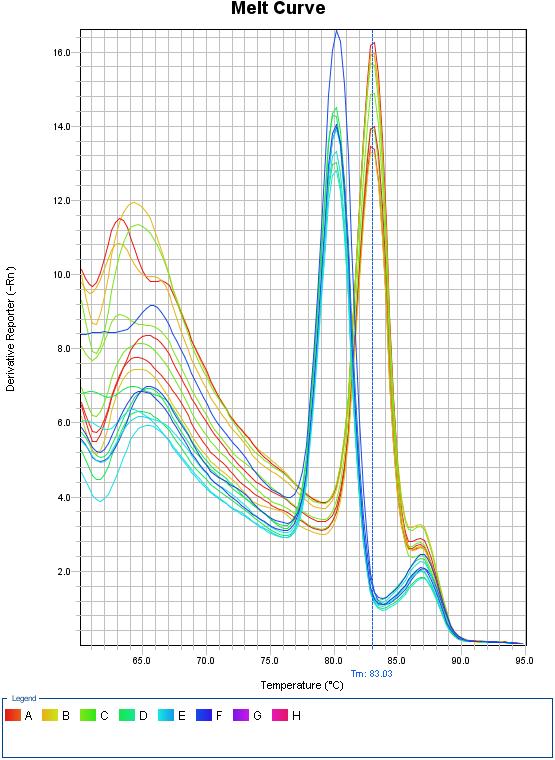
Melt Curve Stage: 60.0℃ for 1min, 95℃ for 15sec.
- The gene coding Kanamycin is recognized as reference gene which is run in the qPCR.
- All samples are run for three replicates.
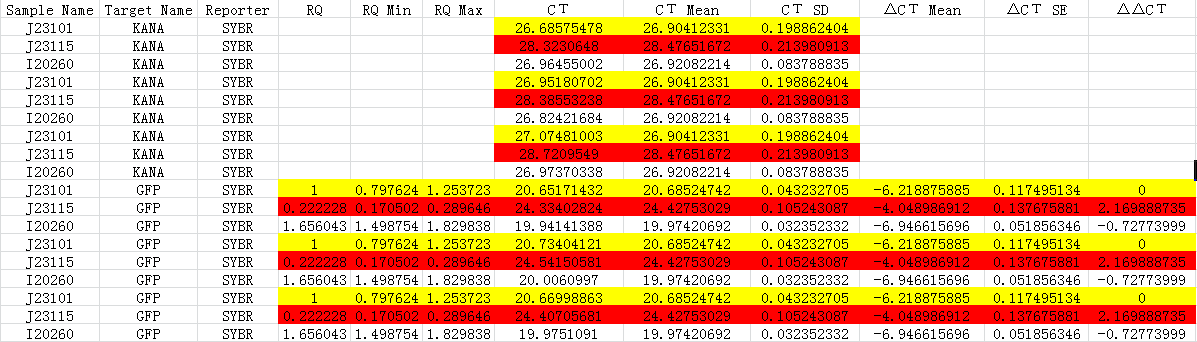
Results
| Position | A | B | C | D | E | F | G | H |
|---|---|---|---|---|---|---|---|---|
| 1 | J23101_Kana | J23101_Kana | J23101_Kana | J23101_GFP | J23101_GFP | J23101_GFP | - | - |
| 2 | J23115_Kana | J23115_Kana | J23115_Kana | J23115_GFP | J23115_GFP | J23115_GFP | - | - |
| 3 | I20260_Kana | I20260_Kana | I20260_Kana | I20260_GFP | I20260_GFP | I20260_GFP | - | - |
Analysis
We took an experiment to find the relation between OD600 and bacterial number and knew that if OD600 is less than 1, OD600 is about a linear relation with the number of bacterial.
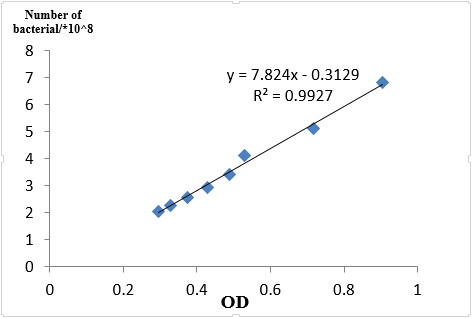
In case of different growth statues of bacterial, we reshaked bacterial according to 1:100 of germ solution. Finally, the OD600 of J23101 =0.436, J23115 =0.511, I20260=0.560.So when we get the OD600 of each sample, we made the same number of bacterial to extract RNA, J23101 = 3.00ml, J23115 =2.56ml, I20260=2.34ml, all the number in culture is about 3.09*108.
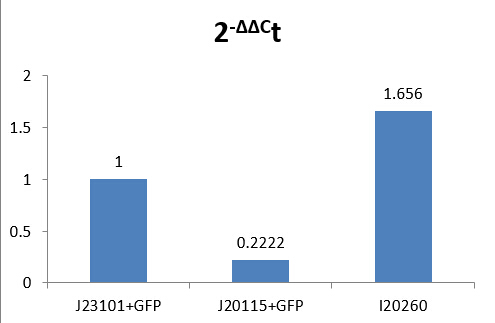
We made J23101 as the control group, 2-ΔΔCT to calculate the relative amount of mRNA.
Equation 1: $$X=X_0(1+E_x)^n$$
X: numbers of target gene after n turn of cycle
X0: initial number of target gene
Ex: amplification efficiency of target gene
n: Cylcles
Equation 2: $$X_t=X_0(1+E_x)^{C_{t,x}} =K_x$$
Xt: number of target gene reaching threshold set
Ct,x: cycle for target gene reaching threshold
Kx: a constant number
Equation 3: (for reference gene): $$R_t=R_0(1+E_r)^{C_{t,r}} =Kr$$
Rt: number of reference gene reaching threshold
Ct,r: cycle for reference gene reaching threshold
Kx: another constant number
Xt over Rt is $$\frac{X_t}{R_t}= \frac{X_0(1+E_x)^{C_{t,x}}}{ R_0(1+E_r)^{C_{t,r}}}= \frac{K_x}{K_r}=K$$
We suppose the amplification efficiency is the same for target and reference gene: $$E_x=E_r=E$$, then
$$\frac{X_0}{R_0}(1+E_r)^{{C_{t,x}} -{C_{t,r}}}= K$$ or $$ X_n(1+E)^{Δ{C_t}}=K$$
Xn: dealt initial number of target gene
ΔCt: difference in Ct for target and reference gene(Ct,x-Ct,r)
We get: $$X_n=K(1+E)^-ΔC_t $$
Xn(q) of each sample over reference sample Xn(cb):
$$\frac{X_{n,q}}{X_{n,cb}}=\frac{K(1+E)^{-Δ{C_{t,q}}}}{K(1+E)^{Δ{C_{t,cb}}}}=(1+E)^{-ΔΔ{C_t}}$$
The advantage of this method is that standard curve is unnecessary but with two requirements:
1. Amplification efficiency for target and reference gene are the same.
2. Efficiency is the highest, nearly 100%.
To reach these, optimum operation is reached.
According to the results, we got:
-ΔΔCt(I20260)= 0.72773999
-ΔΔCt(J23115)= -2.169888735
Therefore, expression of GFP in I20260 is 20.72773999 time J23101 which is 1.6560, and for J23115 are 2-2.169888735 which is 0.2222.
We make a histogram about the fluorescence intensity of three samples below:
Because there are inevitable differences in RNA extraction, and we cannot controlled all variables. According to a page on Part Registry and by consulting our advisors, we think those data of measurement as believable.
Costs
Time:
Bacteria culture: 4 hours after inoculation again (15 hours before)
RNA extraction: 3.5 hours
Gel electrophoresis: 20 minutes
CT & Melt Curve: 2 hours
Plasmid extraction: 45 minutes
Data analysis: 1day
Total: at least 2 days
※Time for preparation is excluded.
Money:
Bacteria culture: near $0
RNA extraction: $3 per sample per time
Gel electrophoresis: $0.1
CT & Melt Curve: $5.5
Plasmid extraction: $0.8
Data analysis: $0
Total: $9.6 per sample per time
※Instrument fee are excluded.
Experiment II: Measure with Fluorescence microscope and Image-Pro Plus 6.0 (IPP 6.0)
Introduction
Temporary mount are made for J23101, J23115, I20260 respectively and observed under Fluorescence microscope. Pictures are taken for three visual view per sample and dealt with IPP 6.0.
※The operation with pictures is taken from this website: http://www.dxy.cn/bbs/topic/9927949 (BBs in Chinese)
Materials
Microscope slides, Coverslip, Fluorescence microscope (Leica DMI3000B with DFC45C), IPP 6.0
Protocols
- Culture
Isolate a clone from a plate incubated to 3 mL LB broth and culture for 14 hours.
- Slides preparation
- Add 30μL dd water to a slide, then add 10μL bacteria culture. Mix it with pipette.
- Use filter paper to move extra liquid.
- Observe under fluorescence microscope.
- Software using-see video below:
Results
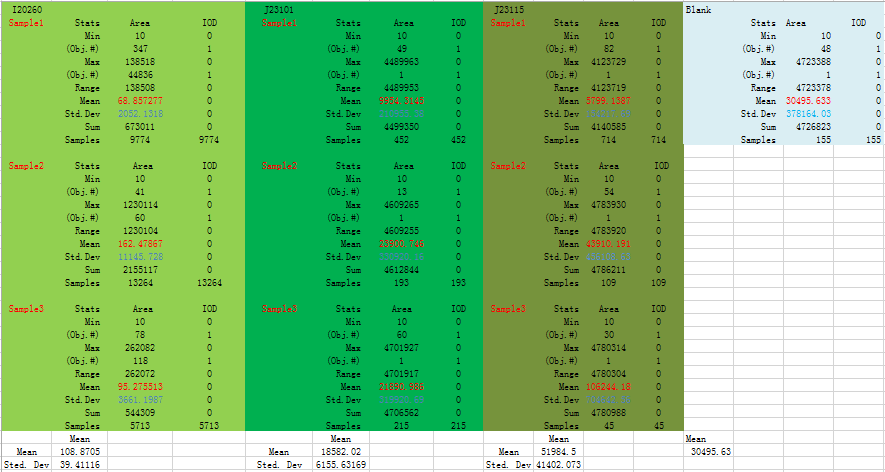
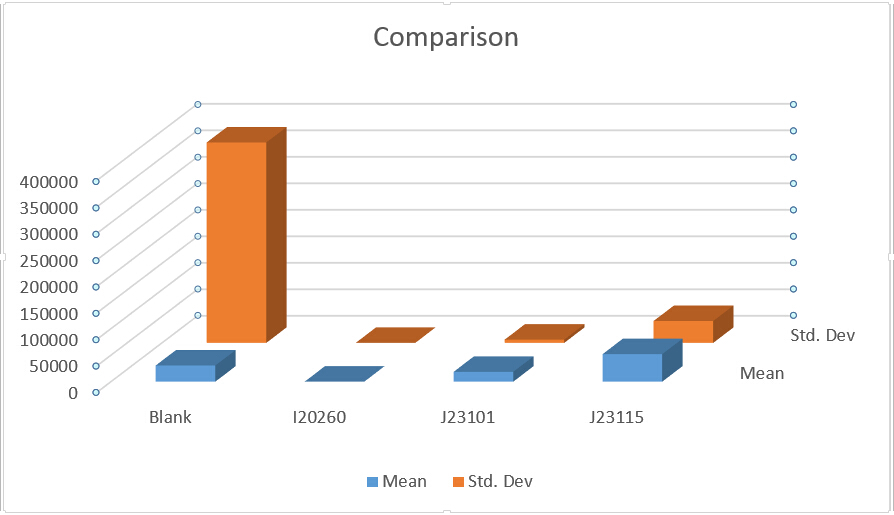
This is data output from IPP:
Analysis
From Fig 2 we could know the strength of expression from low to high is: I20260 J23101 J23115.
We could find that means and Sted. Dev (Standard deviation) differ a lot in three replicates, and even more than half of a mean. From all analysis, this data set is abandoned.
Costs
Time:
Culture: 14hours
Slide preparation: 10 minutes
Observation: 10 minutes
Operation with software: 5 minutes
Total: less than 15hours
Money:
Nearly $0 in total (instrument fee is excluded).
Experiment III: Flow cytometry
Introduction
Flow cytometry was used to directly show the difference in fluorescence intensity.
Materials
BECKMAN COULTER GALLIOS FLOW CYTOMETER (Demo), Culture Broth for three samples
Protocols
- Bacteria were cultured overnight and reinoculated by the ratio of 1:100.
- 100μL culture is transferred to a centrifuge tube and centrifuged for 5minutes at 5000rpm.
- Resuspended with 1 mLPBS and centrifuge for 3minutes at 5000rpm. (Twice)
- Resuspended with 1mL PBS and transfer to tube used for Flow Cyometer.
Results
X axis means fluorescence intensity, and Y axis means number of fluorescence bacterial.
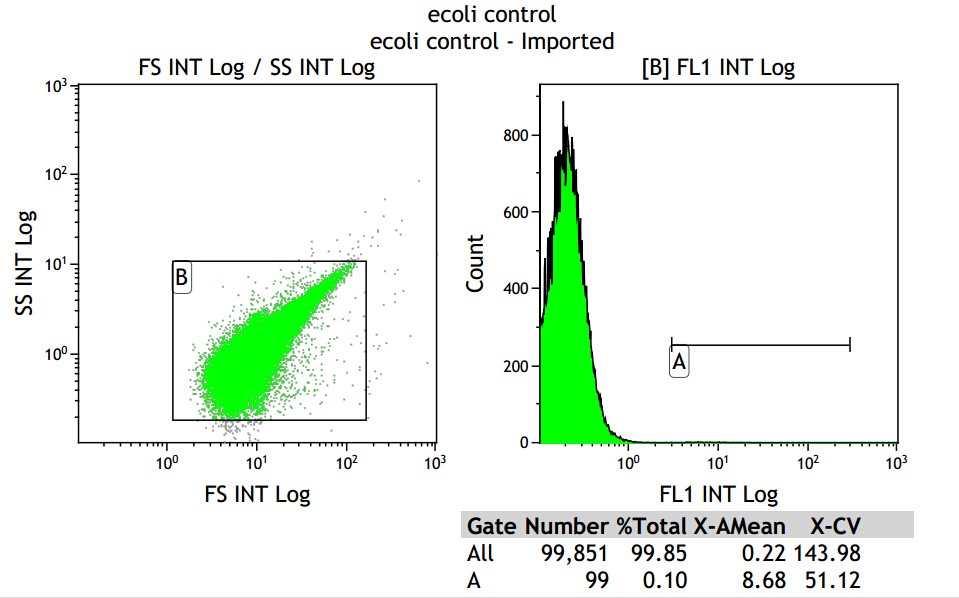
From the control group, we get the mean fluorescence intensity is 8.68, which means we should minus it in the later data.
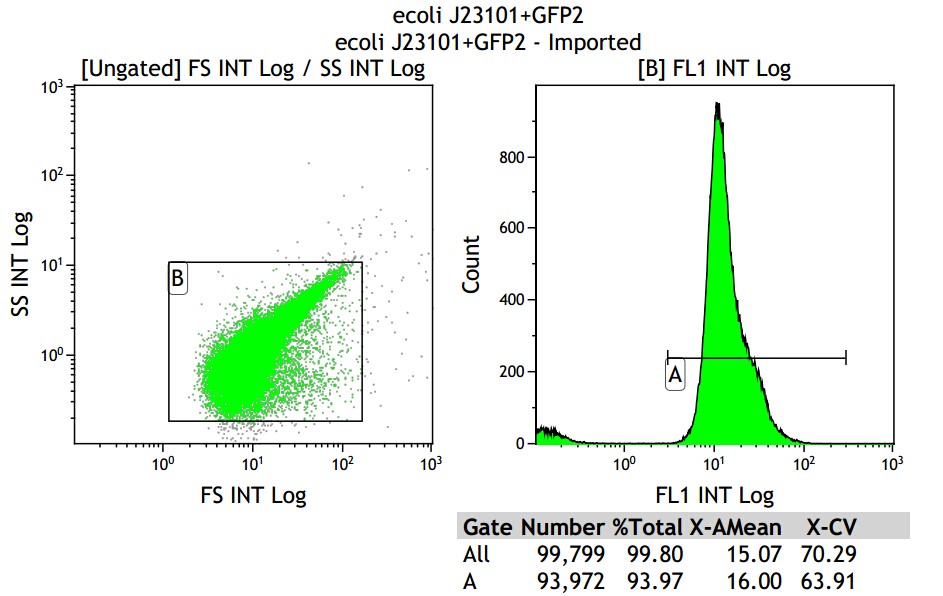
Mean fluorescence intensity is (14.16+16.00+18.50)/3=16.22, which minus 8.68, then real numerical value is 7.54
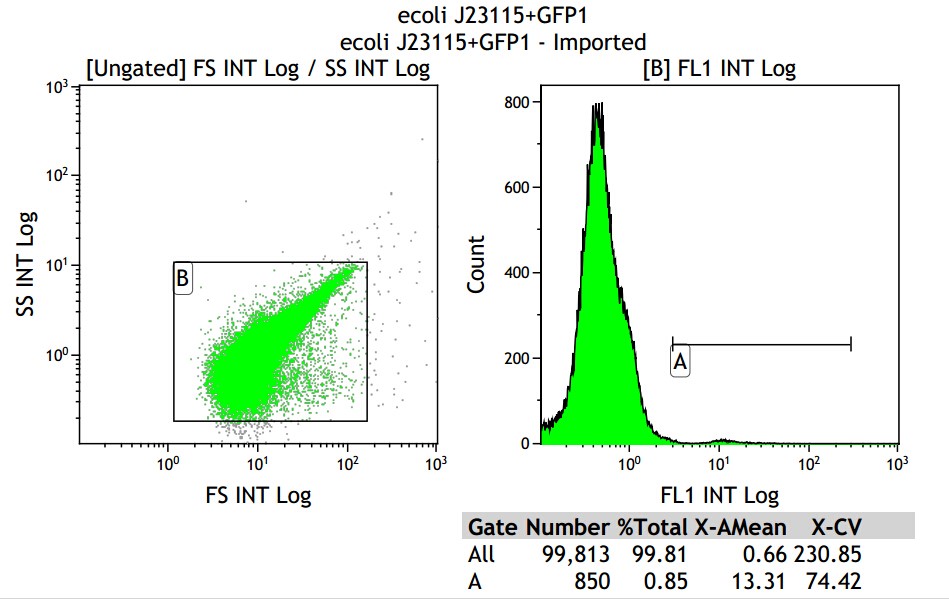
Mean fluorescence intensity is (13.31+10.16+3.39)/3=8.95, but the value 3.39 seems not reasonable, so cut it off will be the best choice, which mean fluorescence intensity changed into (13.31+10.16)/2=11.735, which minus 8.68, real numerical value is 3.05.
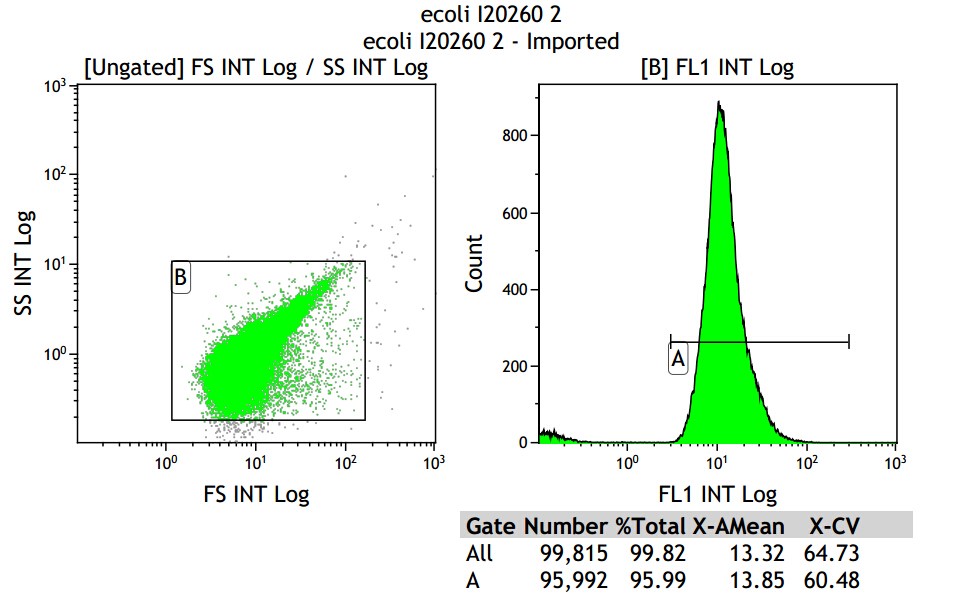
Mean fluorescence intensity is (14.58+13.85+14.06)/3=14.16, which minus 8.68, real numerical value is 5.48
Analysis
We make a histogram about the fluorescence intensity of three samples:
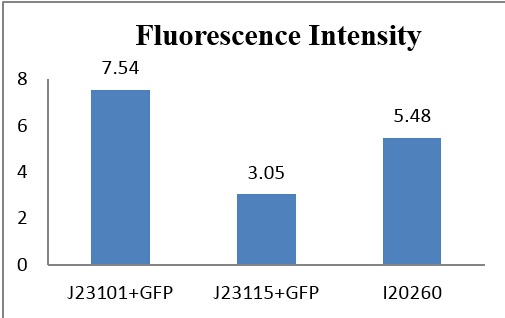
If we make J23101+GFP as 1, the relative histogram shows below:
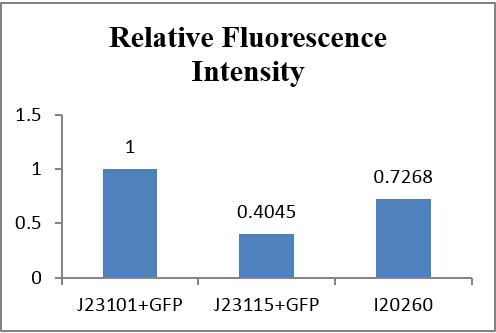
From auto-made results, we can see that the number of J23115 detected with fluorescence were few, although the fluorescence intensity appears to be much more than the control group. Actually, they are similar in numeric expression (compare with the total detected number). From other three experiments, fluorescence intensity of J23115 seems also not be observed clearly. We regard this set of statistics as reasonable.
Costs
Time:
Culture: 15hrs
Fluorescence test: 30 seconds per sample
※Total: At most one day
Money:
$1.00 per sample (Instrument fee is excluded)
Experiment IV: Measurement with Fluorescence Spectrophotometer
Introduction
In this experiment, we used fluorescence spectrophotometer for measurement but forgot to test OD. Therefore we didn’t dealt with the statistics further.
Not all information is shown on this page. If you want to know more please send us an e-mail.