Team:Aachen/Project/2D Biosensor

From 2014.igem.org

(Difference between revisions)
(Achievements)
(Achievements)
Line 163: Line 163:
We developed and optimized a 2D biosensor, which is able to detect IPTG, 3-oxo-C{{sub|12}}-HSL and living ''Pseudomonas aeruginosa'' cells.  
-
{{Team:Aachen/FigureFloat|Aachen_K1319042_Platereader.gif|title=Testing K1319042 in our sensor chips|subtitle=Sensor chips based on [http://parts.igem.org/Part:BBa_K1319042 K1319042] were investigated for fluorescence using a plate reader. Blue color indicates the absence of fluorescence, while red color indicates fluorescence. The upper chip was not induced, while the lower chip was induced with IPTG (2 µL, 100mM).|width=260px}}
+
{{Team:Aachen/FigureFloat|Aachen_K1319042_Platereader.gif|title=Testing K1319042 in our sensor chips|subtitle=Sensor chips based on [http://parts.igem.org/Part:BBa_K1319042 K1319042] were investigated for fluorescence using a plate reader. Blue color indicates the absence of fluorescence, while red color indicates fluorescence. The upper chip was not induced, while the lower chip was induced with IPTG (2.0 µL, 100mM).|width=260px}}
=== Testing our Sensor Chips in a Plate Reader ===

Revision as of 03:02, 18 October 2014

2D Biosensor

With our 2D biosensor technology we are able to detect the pathogen Pseudomonas aeruginosa on solid surfaces. The sensor system is comprised of two distinct but inseparable modules, a biological and a technical part:

  • Sensor chips containing Cellocks, our engineered detective cells that fluoresce in the presence of the pathogen, make up the biological part of Cellock Holmes.
  • Our measurement device WatsOn and the complementary software Measurarty complete our sensing technology on the technical side.


Aachen 15-10-14 Principle of operation 2D sensor ipo.png

Principle of Operation

Cellock Holmes is designed upon a SynBio approach comprising a two-dimensional biosensor and a measurement unit. The two-dimensional biosensor is devised to recognize quorum sensing molecules secreted by the pathogen cells and to generate a distinct fluorescence signal; while the measurement device recognizes and analyzes the produced signal. On the molecular side, we use the REACh construct to transform regular E. coli cells into Cellocks.

Aachen 17-10-14 The basics of quorum sensing ipo.png
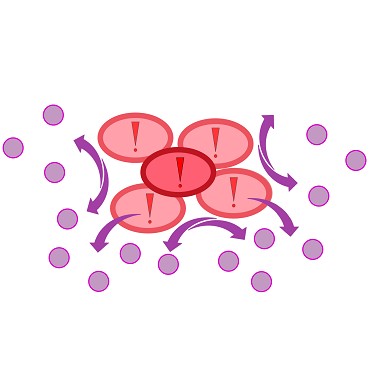
The principle of quorum sensing
Microorganisms can sense the presence of their own kind based on quorum sensing which is a form of chemical communication. Depending on their cell density, quorum sensing allows these cells to activate or deactivate certain gene expression cascades (Waters and Bassler, 2005) for a specific function.

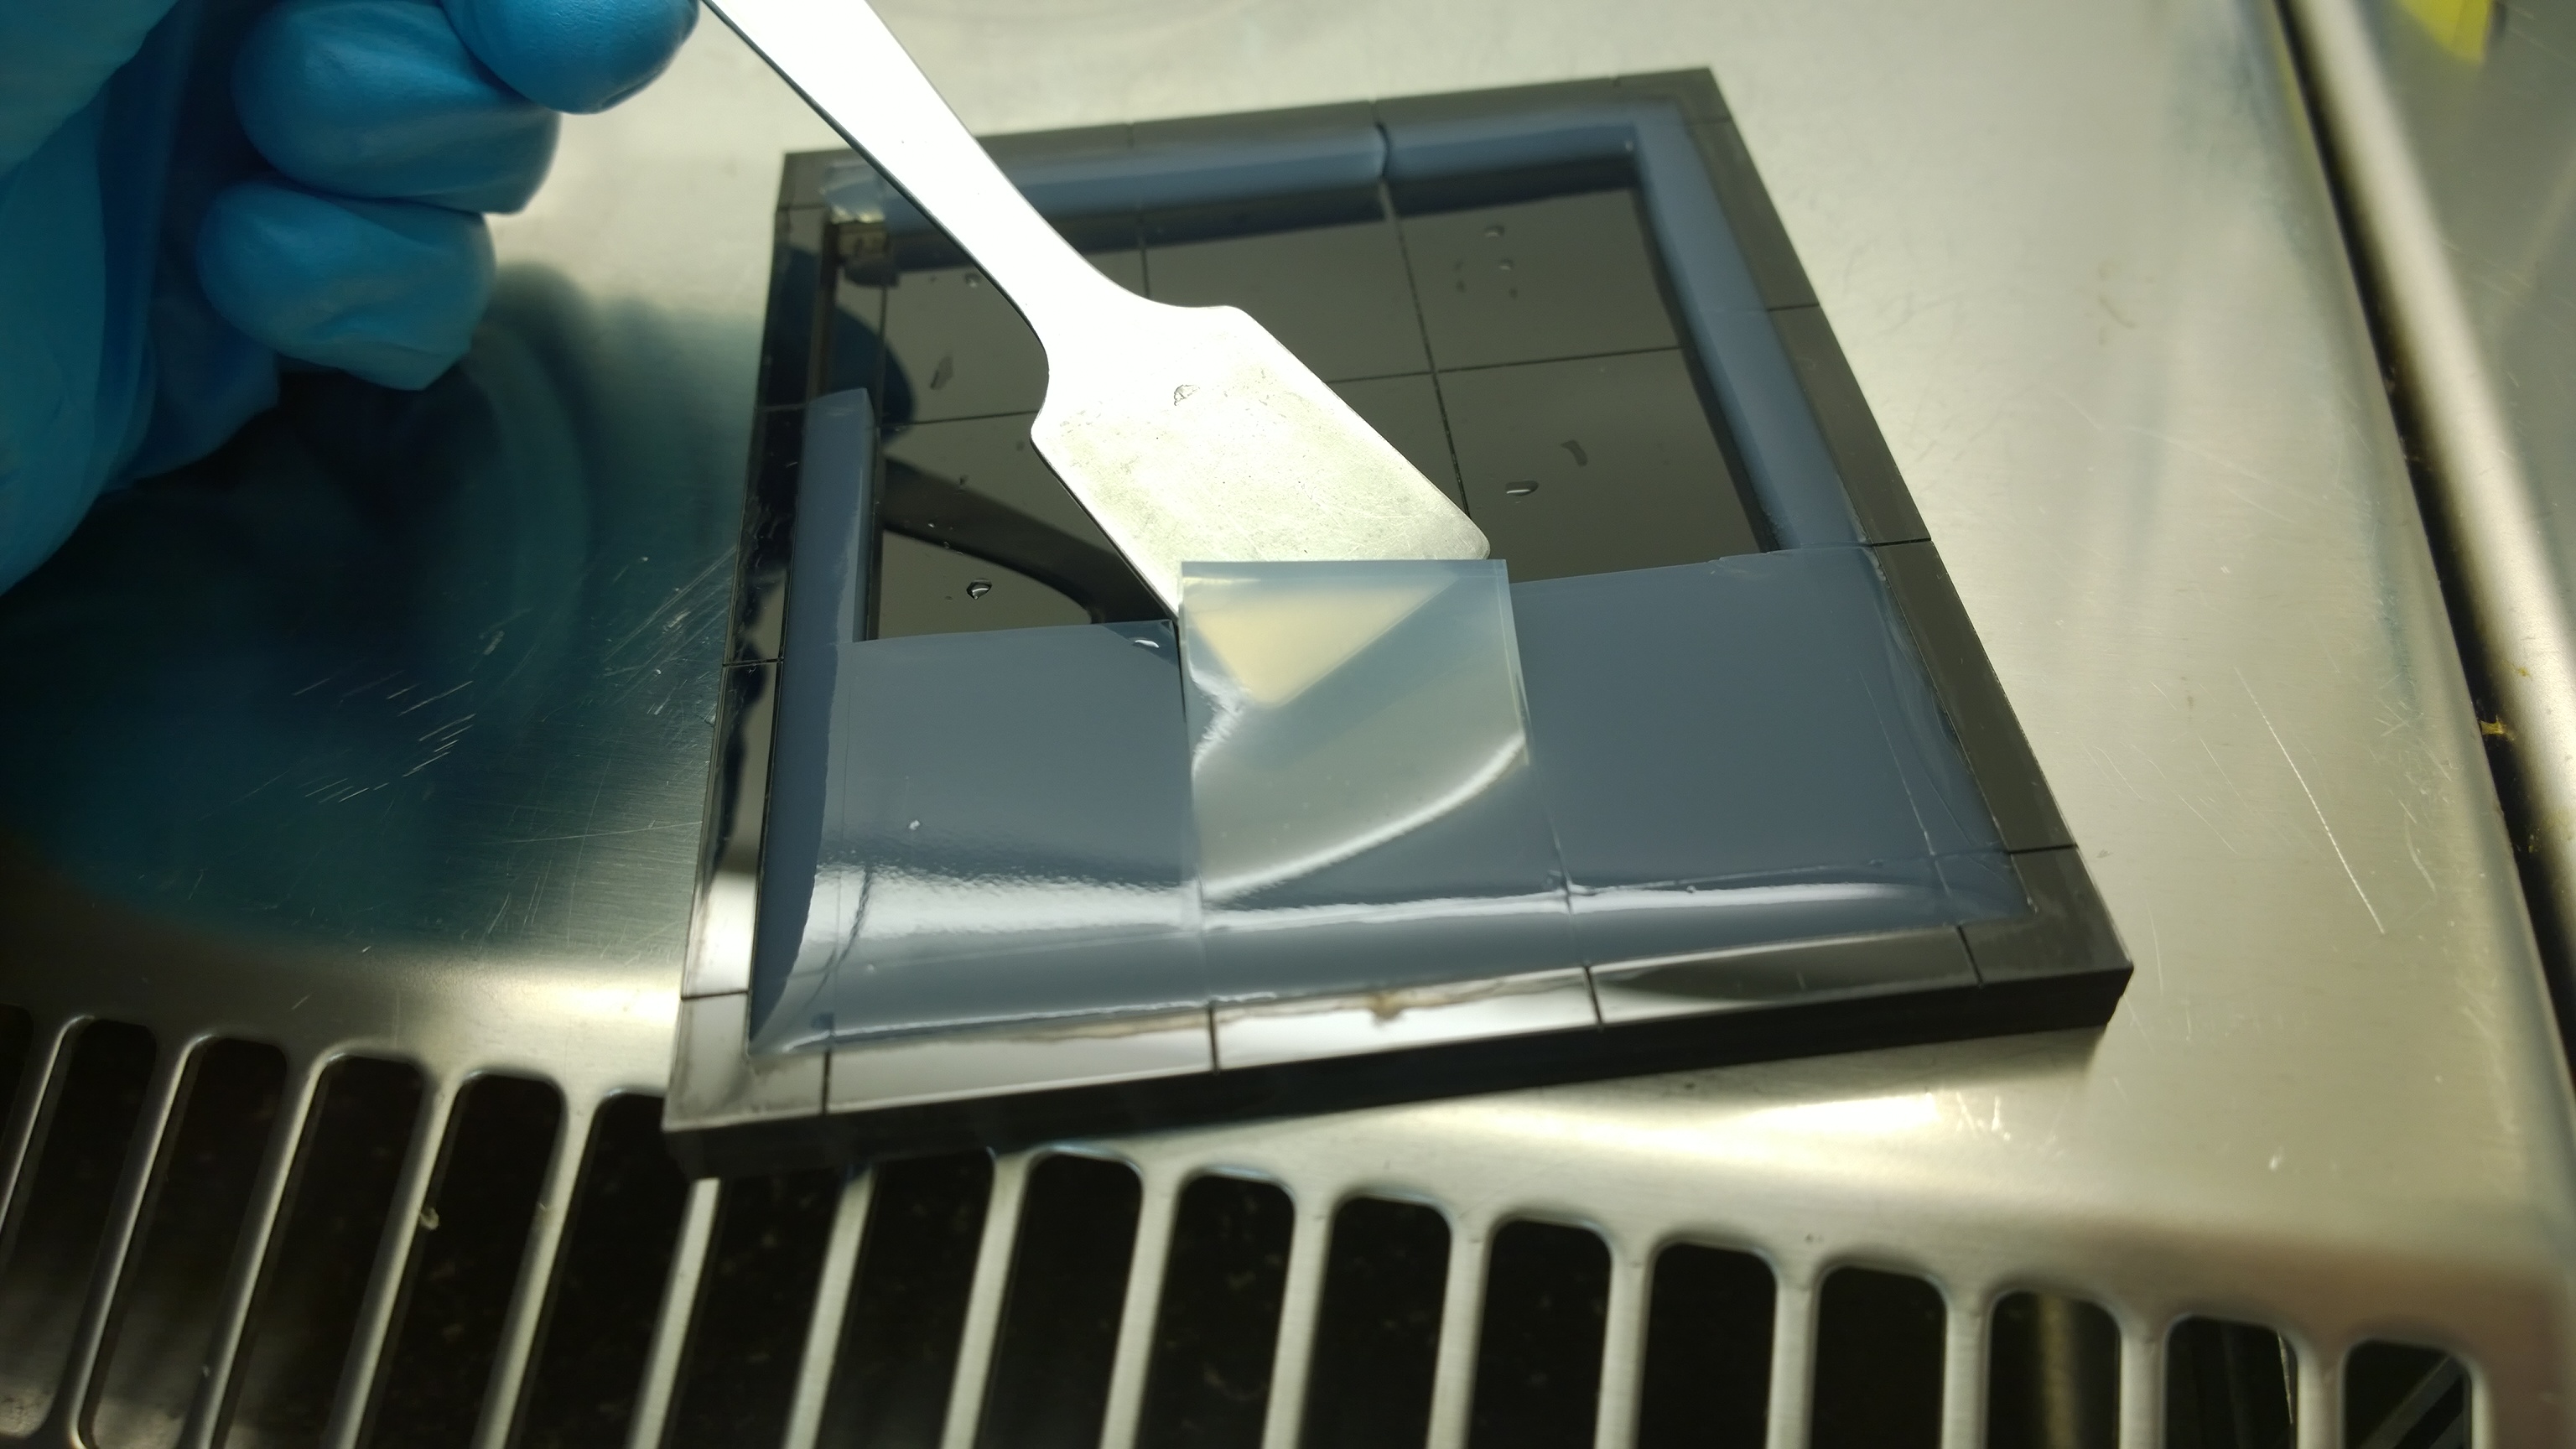
Our sensor cells, Cellocks, are immobilized in agar chips. To make the chips, we mix the Cellocks with liquid LB agar. In the course of our project, we designed a casting mold specifically for the production of our agar chips. When the agar has cooled down, the chips are cut out of the mold and are ready to use. Storage of the readily usable sensor chips is possible for up to two days at 4°C when using LB medium or up to five days if TB medium is used. A detailed description of the sensor chip manufacturing can be found in our Protocols section.

Aachen 14-10-14 Flowsheet OD-device part1 ipo.png
Assay to detect P. aeruginosa using Cellock Holmes
This flow sheet shows the procedure to sample and detect P. aeruginosa: A sampling chip is briefly put onto the potentially contaminated surface, added onto one of our sensor chips and inserted into WatsOn.

Using Cellock Holmes, we developed a simple assay to detect P. aeruginosa. Initially, a so called sampling chip is placed on a solid surface that is potentially contaminated with the pathogen. Subsequently, the sampling chip is removed from the surface and put onto one of our sensor chips. Theorectically, the sensor chips could be directly used for sampling, however, this was avoided in our project to match biosafety regulations and to prevent the spread of genetically modified organisms (GMOs) into the environment. The two layered chip-stack is then put into a petri dish which is inserted into our measurement device WatsOn for evalutation.

Aachen 14-10-14 Flowsheet OD-device part2 ipo.png
Mode of action inside WatsOn
Chips are incubated at 37°C to stimulate cell growth and then illuminated with blue light to excite fluorescence. A picture is taken and analyzed for fluorescence signals using the software Measurarty.

Inside WatsOn, the chips are incubated at 37°C and the sampled populations of microorganisms attached on the sampling chip start to grow and multiply. During incubation the chips can be illuminated with blue light at any time, and a photo of the chips is taken. The software Measurarty then analyzes any fluorescent signal. P. aeruginosa secrets an increasing number of quorum sensing molecules that are recognized by Cellocks, thereby producing a fluorescence signal. For detection of P. aeruginosa, we focused on a quorum sensing molecule called N-3-oxo-dodecanoyl-L-homoserine lactone (for short: 3-oxo-C12-HSL), which is involved in virulence regulation of P. aeruginosa (Jimenez, Koch, Thompson et al., 2012). The incorporation of the 3-oxo-C12-HSL detection system into the Cellocks is explained in detail in the REACh Construct section.


Aachen 14-10-16 Iterative Process iNB.png

Development & Optimization

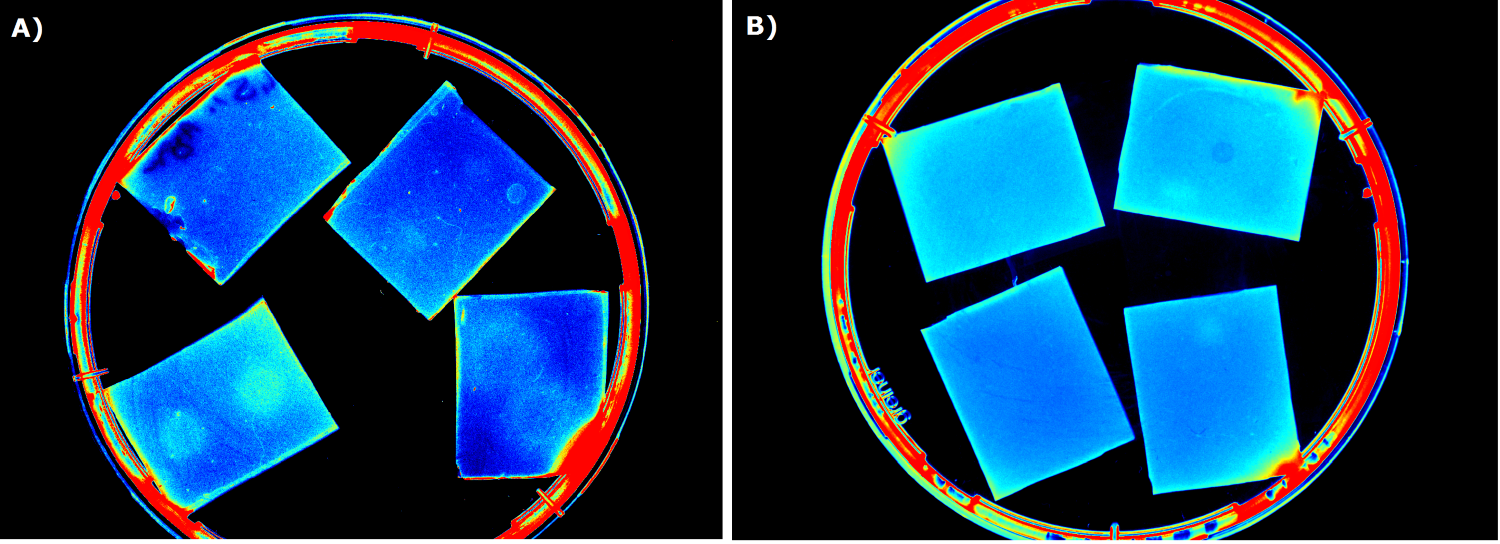
Aachen ILOV GFP HM 1,5h.png
iLOV and GFP in the Gel DocTM
Sensor cells producing iLOV (A) and GFP (B) 1.5 h after induction.

Equipment and medium selection

Our first approach (before developing our own device) was to use the Molecular Imager® Gel Doc™ XR+ from BIO-RAD in our lab to detect fluorescence. This device uses UV and white light illuminators. However, only two different filters were available for the excitation light wavelength, which resulted in very limited possibilities for the excitation of fluorescent molecules. For example, it was possible to detect the expression of iLOV in our sensor chips, but not the expression of GFP. Hence, the Gel Doc™ was not suitable for our project.

Aachen Chip medium geldoc.png
Differend medium in the Gel Doc™
complex media exhibited high background fluorescence while less back- ground fluorescence was observed with the minimal media (HM, M9, NA).
Aachen 5days K131026 neb tb 1,5h.jpg
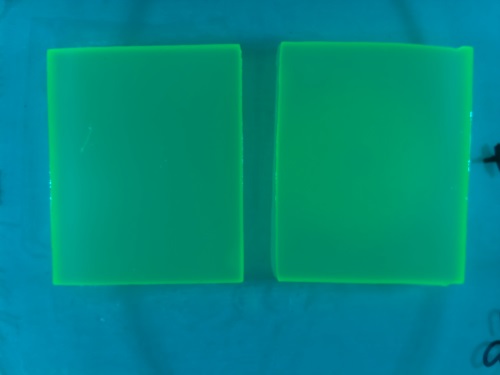
Testing our chips' shelf-life
Chips of [http://parts.igem.org/Part:BBa_K131026 K131026] in NEB were stored five days at 4°C. The right chip was induced with 0.2 µL of 500 µg/mL HSL and an image was taken after 1.5 h.

We tested different media (LB, TB, M9, NA and HM) for the preparation of our sensor chips. The medium compositions can be found in the Protocols section. We screened for an optimized medium composition to minimize background fluorescence and to enhance cell growth. The results of the analysis are presented in the table below. Due to the low background fluorescence in WatsOn and the excellent cell growth, we chose LB medium over the other tested media for sensor chip manufacturing.

LB TB NA M9 HM
Growth of Cellock
+
+
-
-
-
Background fluorescence in GelDoc
+
+
-
-
-
Background fluorescence in WatsOn
-
+
-
-
-

Another set of experiments were conducted to test the long-time storage of the sensor chips. We varied the glycerol content of the chips as well as the storage temperature. Storage at -20°C resulted in the loss of our sensor cells. Adding 5-10% (v/v) glycerol ensured survival of the sensor cells, but resulted in the loss of fluorescence ability. Hence, we concluded that long-time storage of the sensor chips at -20°C is not possible under the tested conditions. However, the 'ready-to-use' sensor chips can be kept at at 4°C for two days when using LB medium, and storage at this temperature for 5 days is possible with chips made from TB medium.

Aachen 2 chipform.jpg
Sensor chip manufacturing using the closed mold
When injecting the liquid agar into a closed mold we encounter problems due to frequent bubble formation.

Optimal Agarose Concentration for Sensor Chip Manufacturing

For the sensor chip manufacturing, agarose was preferred over agar because of the uniform linkage between molecules that results in a better chip homogeneity. In addition, agarose reduced diffusion of the inducer molecules through the chip. A reduction in diffusion is essential for the formation of distinct fluorescent spots on the sensor chips.

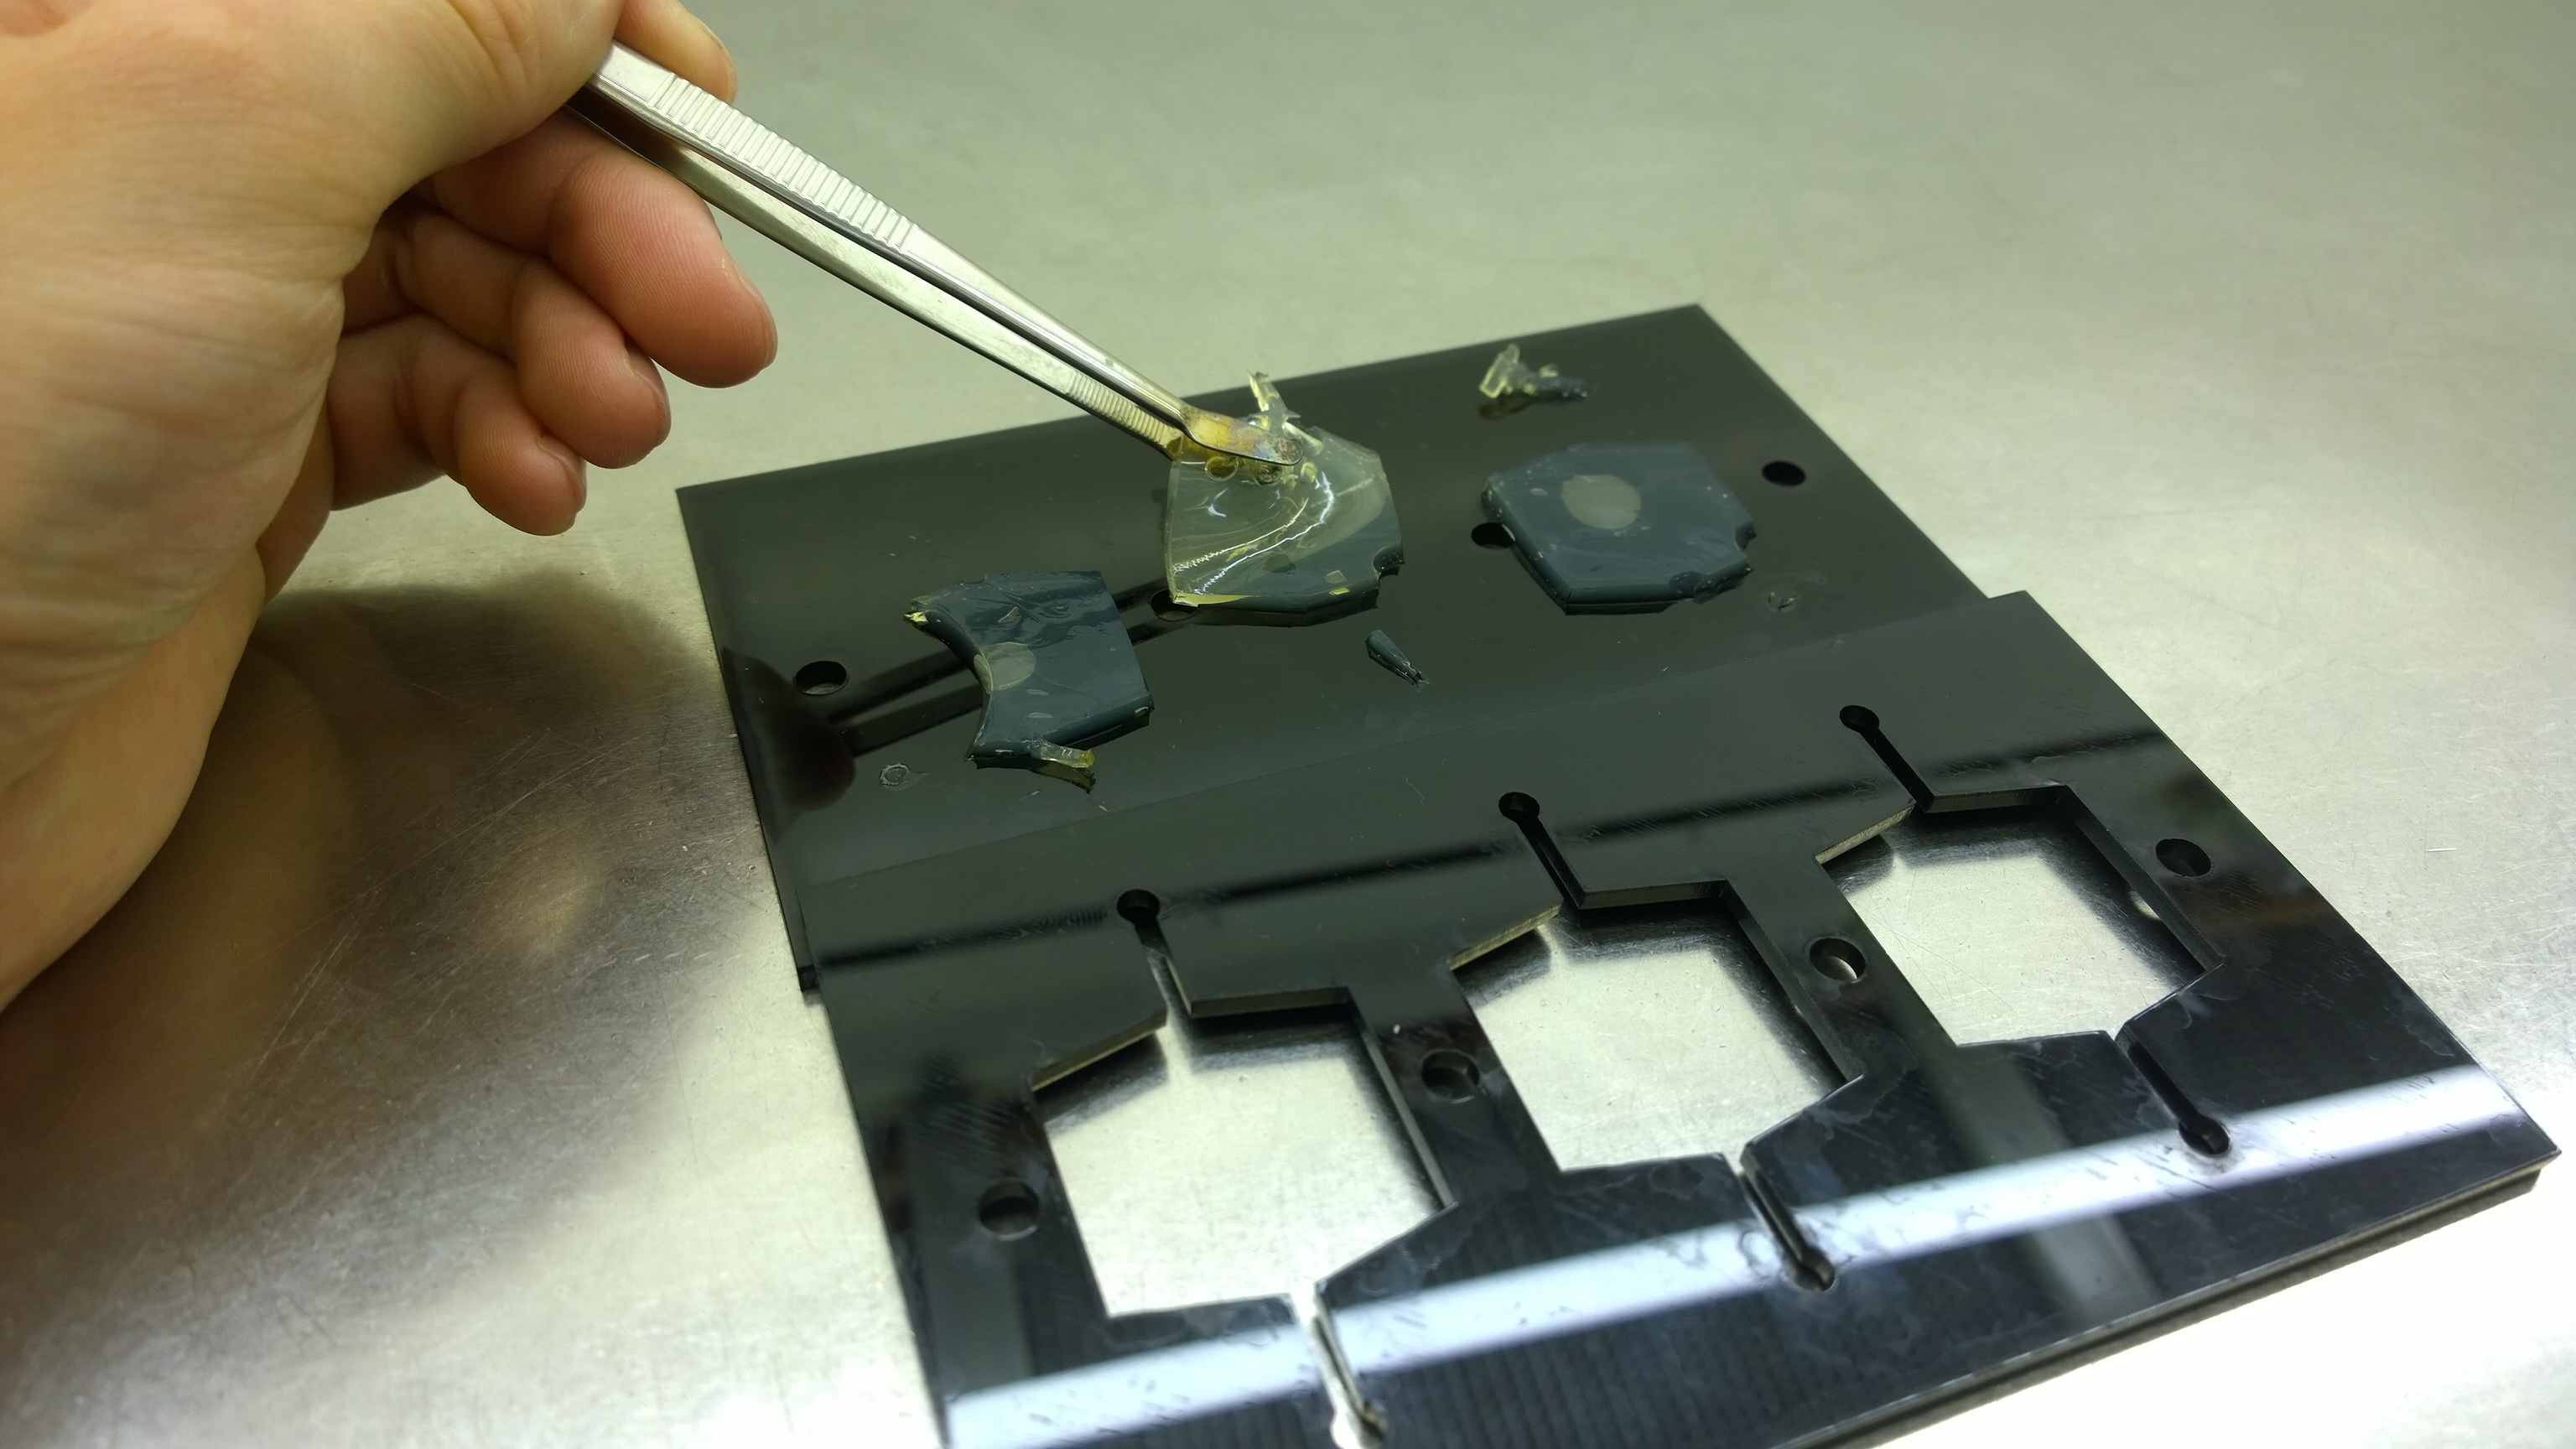
Aachen Final chipform.jpg
The finalized chip mold
An open casting mold was found to be optimal for sensor chip manufacturing, because this approach was fast, easy to handle and generated a reproducible chip quality.

Optimal Chip Configuration

Several approaches were tested for the production of agarose-based sensor chips with reproducible quality. The first approach was to cast every sensor chip individually. To achieve a plain chip surface, a requirement for high quality images, we casted the sensor chips between two microscope slides. However, this approach was not adequate because the agar was too liquid and leaked from the microscope slides. In a second approach, we designed a closed mold into which liquid agar is injected using a pipette, but we encountered a high number of bubbles in the resulting chips. Bubbles in the sensor chips interfered with fluorescence evaluation. Finally, we tried an open casting mold. Once solidified, we cut the agar along precast indentations in the casting mold to form the chips. An advantage of the open mold is the ability to simultaneously produce nine sensor chips while the surface tension of the liquid agar ensures a plane chip surface.

Induction of the Sensor Chips

To test our molecular constructs, we simulated the presence of P. aeruginosa by using IPTG or 3-oxo-C12-HSL. Initial experiments showed that diffusion of the inducers hinder the formation of distinct fluorescent spots. Through this set of experiments we determined that the best compromise between diffusion and spot intensity is an induction volume of 2.0 µL for IPTG and 0.2 µL for HSL. Furthermore, detection of growing P. aeruginosa based on secreted HSLs was possible using the [http://parts.igem.org/Part:BBa_K131026 K131026] construct. The experiments for optimizing the induction of our sensor chips are described in more detail in the Achievements section.

Negative Control

To ensure that the fluorescence signal resulted from the sensor construct and not from the medium or E. coli cells themselves, [http://parts.igem.org/Part:BBa_B0015 B0015] in NEB10β cells was used as negative control during sensor chip induction with IPTG, HSL and P. aeruginosa.

Aachen B0015 IPTG HSL Pseudomonas.png
B0015 in NEB10β was used as a negativ control
Induction with A) 0.2 µL of 100 mM IPTG, image taken after 2.5 h; B) 0.2 µL of 500 µg/mL 3-oxo-C12-HSL, image after 2.5 h; C) with five spots of Pseudomonas aeruginosa liquid culture on the left and one big spot on the right, image taken after 2 h.


Aachen 14-10-15 Medal Cellocks iNB.png

Achievements

We developed and optimized a 2D biosensor, which is able to detect IPTG, 3-oxo-C12-HSL and living Pseudomonas aeruginosa cells.

260px
Testing K1319042 in our sensor chips
Sensor chips based on [http://parts.igem.org/Part:BBa_K1319042 K1319042] were investigated for fluorescence using a plate reader. Blue color indicates the absence of fluorescence, while red color indicates fluorescence. The upper chip was not induced, while the lower chip was induced with IPTG (2.0 µL, 100mM).

Testing our Sensor Chips in a Plate Reader

To establish a prove-of-principle for our sensor chip design, we used our construct [http://parts.igem.org/Part:BBa_K1319042 K1319042], an IPTG inducible iLOV. E. coli cells carrying the this construct were introduced into sensor chips and fluorescence was measured every 15 minutes after induction with 2 µL of 100 mM IPTG. The results are displayed on the left. We observed a distinct difference in fluorescence between the non-induced chip (top) and the induced chip (bottom). The middle of the bottom chip started to exhibit a clear and visible fluorescence that increased over time and spread outwards. The top chip, however, also showed an increase in the measured fluorescence over time which was primarily due to the leaky promoter and background fluorescence.

Detecting 3-oxo-C12-HSL with Sensor Chips

360px
Testing K131026 in our sensor chips
Sensor chips based on [http://parts.igem.org/Part:BBa_K131026 K131026] were investigated for fluorescence using a plate reader. Blue color indicates the absence of fluorescence, while red color indicates fluorescence. The upper chip was not induced, while the lower chip was induced with with 3-oxo-C12-HSL (0.2 µL, 500 µg/mL).

In an initial attempt to detect 3-oxo-C12-HSL, we incorporated the [http://parts.igem.org/Part:BBa_K131026 K131026] construct generated by the 2008 iGEM Team Calgary in our sensor chips. This construct generates a fluorescent signal based on GFP in presence of 3-oxo-C12-HSL molecules produced by P. aeruginosa during quorum sensing (Jimenez, Koch, Thompson et al., 2012). First, we tested the construct by direct induction with 3-oxo-C12-HSL (0.2 µL, 500 µg/mL). The fluorescence measurement was taken every 15 minutes with an excitation wavelength of 496 nm and an emission wavelength of 516 nm. The results of this test are shown on the right.

A distinct fluorescence signal was observed on the induced chip (bottom) compared to the non-induced chip (top). Fluorescence started in the middle of the chip, the point of induction, and then extended outwards while growing in intesnity. The basal level of fluorescence was attributed to leakiness of the promoter and general background fluorescence of growing E. coli cells. In the induced chip (bottom), the background fluorescence was lower than in the non-induced chip (top) because the signal masked the noise. The difference between the induced and non-induced chips indicates a clear response to the HSL and proofed the ability of our 2D sensor chip design to detect HSLs produced by Pseudomonas aeruginosa.


480px
IPTG-inducible superfolder GFP (I746909) in sensor chips
Expression of superfolder GFP ([http://parts.igem.org/Part:BBa_I746909 I746909]) was induced by the addition of IPTG (2 µL, 100mM) on the right chip. The left chip was not induced.


Detecting IPTG with Sensor Chips

The clip displayed on the left side shows the construct [http://parts.igem.org/Part:BBa_I746909 I746909] from the 2007 iGEM Team Cambridge which expresses super folder GFP under the control of a T7 promoter in combination with our 2D sensor chip technology. The [http://parts.igem.org/Part:BBa_I746909 I746909] construct was introduced into BL21(DE3) cells to make the expression IPTG-inducible since the genome of BL21(De3) contains the T7 RNA Polymerase under the control of a lacI promoter.

While the left chip does not show visible fluorescence, the right chip exhibits a strong fluorescence signal. This proves the ability of our sensor chip technology to detect IPTG. The fluorescence response is also high enough to be detected and analyzed by our measurement device WatsOn.


480px
Detection of 3-oxo-C12-HSL with K131026
0.2 µL of 3-oxo-C12-HSL was placed in the middle of the chip and then incubated at 37°C in WatsOn.

Detecting the 3-oxo-C12-HSL with K131026 in our Sensor Chips using WatsOn

The next step towards the final goal of detecting living cells of Pseudomonas aeruginosa was to reproduce the detection of 3-oxo-C12-HSL, already established in the plate reader, in our own WatsOn device. Therefore, we again used E. coli BL21(DE3) cells carrying [http://parts.igem.org/Part:BBa_K131026 K131026] and induced with 0.2 µL 3-oxo-C12-HSL of a concentration of 500 µg/mL. In the clip displayed on the left, the right chip was induced and - as a negative control - the left chip was not induced. Pictures were taken every four minutes.


The result was a clear replication of the success of the plate reader experiment. The induced chip showed a clear fluorescence response eminating from the center, where the induction with HSL took place. This demonstrated the ability of not only our sensor chip technology but also our measurement device WatsOn to successfully detect 3-oxo-C12-HSL.

480px
Detection of Pseudomonas aeruginosa with K131026
Direct detection of Pseudomonas aeruginosa on our sensor chips. Sensor cell carried K131026.


Detecting Pseudomonas aeruginosa with K131026 in our Sensor Chip with WatsOn

After establishing the successful detection of 3-oxo-C12-HSLs with our sensor chips the next step was to detect living cells of Pseudomonas aeruginosa with our measurement device WatsOn. Therefore sensor chips based on [http://parts.igem.org/Part:BBa_K131026 K131026] were prepared and the right chip was induced with 0.2 µL of a Pseudomonas aeruginosa culture while the left chip was not induced (Detection of 3-oxo-C12 HSL with K131026, displayed below). On the induced chip, a clear fluorescence signal was visible in response to P. aeruginosa. The fluorescence signal emerged outward from the induction point and showed a significant difference to the non-induced chip. The results clearly demonstrate the ability of our sensor chip technology and our measurement device WatsOn to detect P. aeruginosa!


Aachen 14-10-16 Outlook Cellocks iNB.png

Outlook

We are committed to improve our sensor chip platform. The current technique of using a simple agarose chip is not sufficient to collect all microorganisms from the sampled surface. Therefore, the aim is to improve the sampling chip by using a different, more adhesive material.

Furthermore, diffusion in the sensor chips will be reduced to limit the spread of the fluorescence signal. Currently, the fluorescence spot grows beyond the point of induction and makes it difficult to differentitate between multiple points of induction. By introducing diffusion barriers into our chips, the growth of the fluorescence spots might be reduced, thus enabling the detection of multiple sources of fluorescence lying close together.

Additionally, the application of our sensor chips in combination with our WatsOn device is currently being evaluated for the detection of signals other than fluorescence. Detecting bio- and chemiluminescence has been identified and will be investigated as an area of potential future application.


References

  • Waters, C. M., & Bassler, B. L. (2005). QUORUM SENSING: Cell-to-Cell Communication In Bacteria. Annual Review of Cell and Developmental Biology, 21(1), 319-346. Available online at http://www.annualreviews.org/doi/full/10.1146/annurev.cellbio.21.012704.131001.
  • Jimenez, P. N., Koch, G., Thompson, J. A., Xavier, K. B., Cool, R. H., & Quax, W. J. (2012). The Multiple Signaling Systems Regulating Virulence in Pseudomonas aeruginosa. Microbiology and Molecular Biology Reviews, 76(1), 46-65. Available online at http://www.ncbi.nlm.nih.gov/pmc/articles/PMC3294424/#B63.