Team:Aachen/Notebook/Software/Measurarty
From 2014.igem.org
(→Source Code) |
|||
| Line 104: | Line 104: | ||
Typically $Q$ is chosen as $Q \in \lbrack 256, 1\rbrack$ and $\delta = \frac{1}{\lvert I \rvert^2}$. | Typically $Q$ is chosen as $Q \in \lbrack 256, 1\rbrack$ and $\delta = \frac{1}{\lvert I \rvert^2}$. | ||
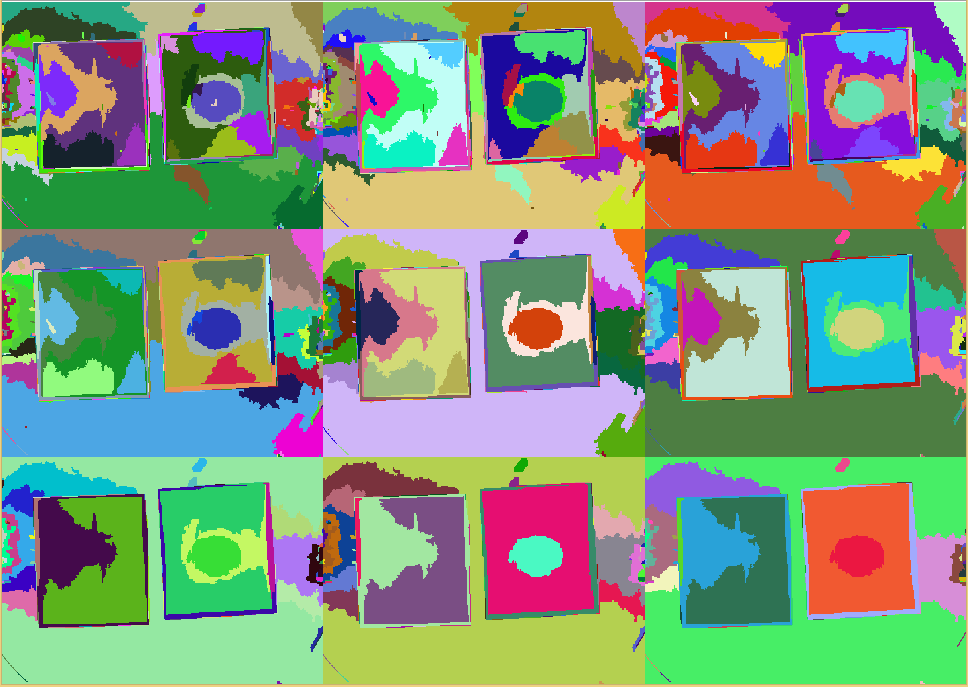
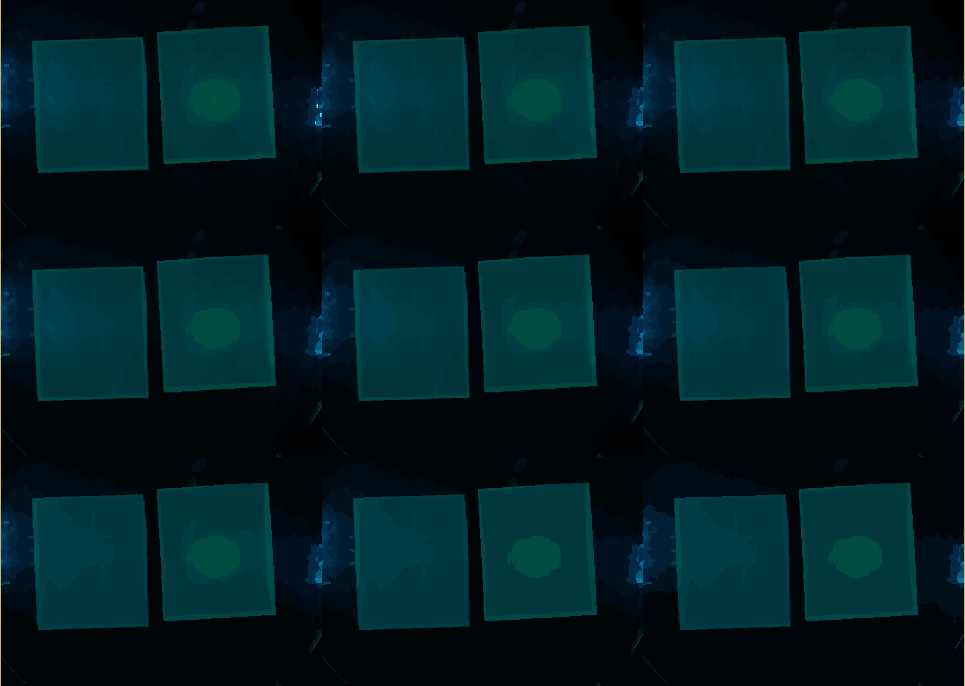
| - | The $Q$ parameter mainly influences the merging process. For an example, see the figure ''SRM Regions'' below. The lower the chosen value for $Q$, more coarse the regions become. Using a union-find structure, the segmentation does not need to be recalculated for each $Q$ level. For the step from $q$ to $\frac{q}{2}$, just the qualification criteria needs to be applied to the regions from the $q$ result. A MATLAB implementation is also available (Boltz, | + | The $Q$ parameter mainly influences the merging process. For an example, see the figure ''SRM Regions'' below. The lower the chosen value for $Q$, more coarse the regions become. Using a union-find structure, the segmentation does not need to be recalculated for each $Q$ level. For the step from $q$ to $\frac{q}{2}$, just the qualification criteria needs to be applied to the regions from the $q$ result. A MATLAB implementation is also available (Boltz, 2009). |
{{Team:Aachen/FigureDual|Aachen_srm_regions_3.PNG|Aachen_srm_regions_2.PNG|title1=SRM regions in random colors|title2=SRM regions (average color)|subtitle1=Different regions from an SRM run starting at $Q=256$ (top left) and going to $Q=1$ (bottom right). Each region is assigned a random color.|subtitle2=Different regions from an SRM run starting at $Q=256$ (top left) and going to $Q=1$ (bottom right). Each region is assigned the average color of that region.|width=425px}} | {{Team:Aachen/FigureDual|Aachen_srm_regions_3.PNG|Aachen_srm_regions_2.PNG|title1=SRM regions in random colors|title2=SRM regions (average color)|subtitle1=Different regions from an SRM run starting at $Q=256$ (top left) and going to $Q=1$ (bottom right). Each region is assigned a random color.|subtitle2=Different regions from an SRM run starting at $Q=256$ (top left) and going to $Q=1$ (bottom right). Each region is assigned the average color of that region.|width=425px}} | ||
| Line 113: | Line 113: | ||
For our purposes we only have one SRM run for $Q=256$. | For our purposes we only have one SRM run for $Q=256$. | ||
| - | In MATLAB, we use the previously mentioned code from MATLAB Fileexchange (Boltz, | + | In MATLAB, we use the previously mentioned code from MATLAB Fileexchange (Boltz, 2009). |
For our Qt-based GUI we implemented the SRM method ourselves. | For our Qt-based GUI we implemented the SRM method ourselves. | ||
| Line 277: | Line 277: | ||
<span class="anchor" id="measurartyrefs"></span> | <span class="anchor" id="measurartyrefs"></span> | ||
| + | * Boltz, S. (2009, October 20). Image segmentation using statistical region merging - File Exchange - MATLAB Central. Image segmentation using statistical region merging. Retrieved December 12, 2013, from http://www.mathworks.com/matlabcentral/fileexchange/25619-image-segmentation-using-statistical-region-merging | ||
| - | + | * Joppich, M., Rausch, D., & Kuhlen, T. (2013). Adaptive human motion prediction using multiple model approaches.. Virtuelle und erweiterte Realität (p. 169–180). 10. Workshop der GI-Fachgruppe VR/AR: Shaker. | |
| - | + | * Nock, R., & Nielsen, F. (2004). Statistical region merging. IEEE Transactions on Pattern Analysis and Machine Intelligence, 26(11), 1452-1458. | |
| - | + | ||
| - | |||
{{Team:Aachen/Footer}} | {{Team:Aachen/Footer}} | ||
Revision as of 10:18, 17 October 2014
|
|
|
|
|
|
|
 "
"

