Team:ETH Zurich/modeling/diffmodel
From 2014.igem.org
(→Dynamics by row) |
(→Dynamics by row) |
||
| Line 155: | Line 155: | ||
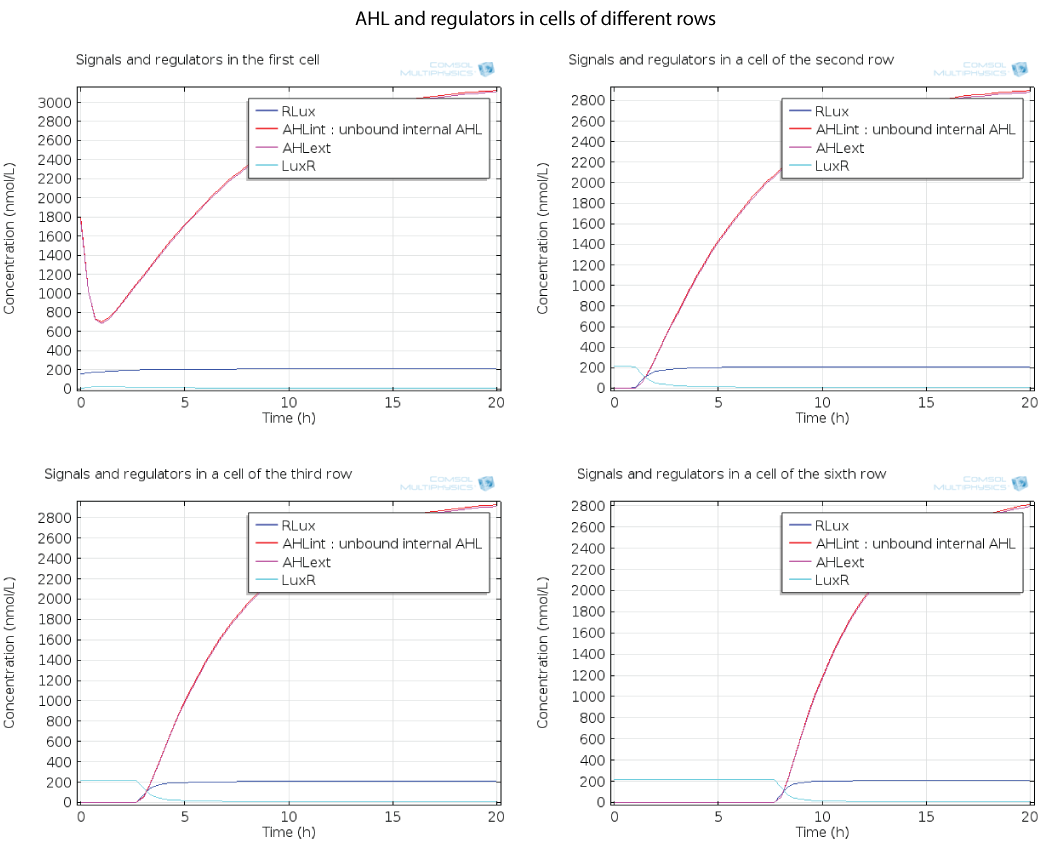
Here you can see the quorum sensing mechanism happening in several rows at different moments. The first colony has a high initial concentration of AHL so at the beginning, AHL diffuses quickly out of the first colony. However as the first cell is strongly induced because of this AHL, a positive feedback is produced which will enable AHL concentration to reach a steady state. The colonies in the row below receive AHL progressively as opposed to the first colony which had an initial concentration, so the feedback in these colonies below has the time to happen immediately when AHL is received, and this is why AHL increases so fast in these colonies. | Here you can see the quorum sensing mechanism happening in several rows at different moments. The first colony has a high initial concentration of AHL so at the beginning, AHL diffuses quickly out of the first colony. However as the first cell is strongly induced because of this AHL, a positive feedback is produced which will enable AHL concentration to reach a steady state. The colonies in the row below receive AHL progressively as opposed to the first colony which had an initial concentration, so the feedback in these colonies below has the time to happen immediately when AHL is received, and this is why AHL increases so fast in these colonies. | ||
| + | <br> | ||
| + | <br> | ||
[[File:ETHZ AHL-regulators-pattern.png]] | [[File:ETHZ AHL-regulators-pattern.png]] | ||
| + | <br> | ||
| + | <br> | ||
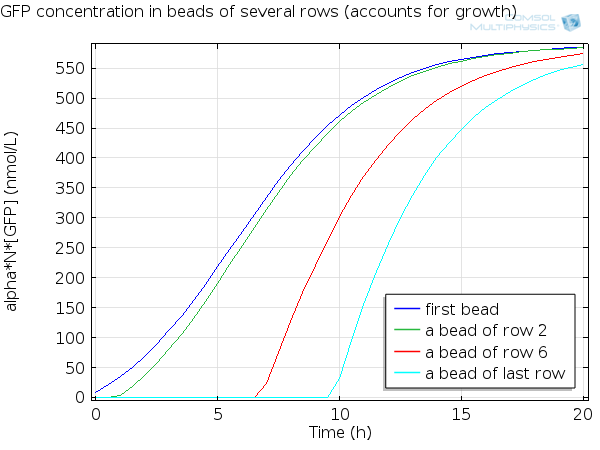
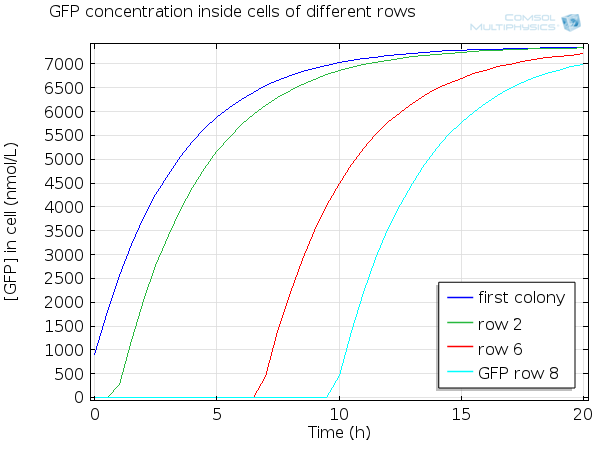
For simulation of the pattern, in order to be able to simulate fluorescence of the beads which is influenced by cell growth, we had to plot the concentration of GFP overall in a bead as opposed to the concentration of GFP in cells. Here we compare concentration of GFP in cells (doesn't account for growth) and overall concentration of GFP in a bead (accounts for growth) : | For simulation of the pattern, in order to be able to simulate fluorescence of the beads which is influenced by cell growth, we had to plot the concentration of GFP overall in a bead as opposed to the concentration of GFP in cells. Here we compare concentration of GFP in cells (doesn't account for growth) and overall concentration of GFP in a bead (accounts for growth) : | ||
| + | <br> | ||
| + | <br> | ||
| + | |||
[[File:ETHZ GFP in beads.png|600px]] | [[File:ETHZ GFP in beads.png|600px]] | ||
[[File:ETHZ GFP in single cell.png|600px]] | [[File:ETHZ GFP in single cell.png|600px]] | ||
Revision as of 02:28, 16 October 2014
Diffusion model
Model
The main experiment for investigating diffusion is a propagation of the whole pattern through the chip via the quorum sensing module only. We have used beads containing cells which are able to sense luxAHL, produce GFP when they sense it, and amplify the signal for the next row. The combination of the quorum sensing module with diffusion enables to check that cells will amplify the signal enough from one row to the next one, and to check what would be the time scale of the pattern formation. We used a reaction-diffusion model to combine quorum sensing reactions and diffusion.
Geometry and boundary conditions
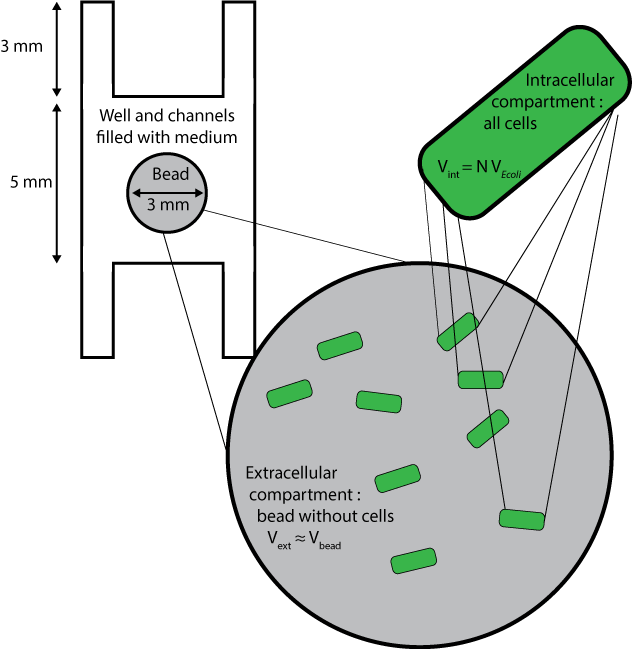
Three different compartments are considered :
- The wells and channels, which are filled with liquid medium and where extracellular AHL only can diffuse, with its diffusion coefficient D, and degrade with the degradation rate dAHLext.
- The beads without the cells inside them, whose volumes are approximated to the volume of beads themselves, and where extracellular AHL only can degrade and diffuse, with a slighty lower diffusion coefficient 0.9*D.
- The cells, which are considered altogether as one compartment, and which contains all species except extracellular AHL.
In order to fulfill these conditions in Comsol Multiphysics, the cells are not drawn but instead, beads are considered as compartments with a certain density of cells. Rates of diffusion through the membrane are added as reaction rates and intracellular species are contained in beads via a Newmann's boundary condition applied to the surface of the beads, that is : $$ \nabla C . \textbf{n} =0$$ $$\text{for all species except extracellular AHL}$$ $$\text{for every vector n normal to the surface of a bead}$$
Species and reactions
| Name | Description |
|---|---|
| AHLint | LuxAHL inside cells |
| AHLext | LuxAHL outside cells |
| LuxR | Constitutively expressed regulator protein that can bind LuxAHL and stimulate transcription of GFP. |
| RLux | LuxR and LuxAHL complex which can dimerize. |
| mRNAGFP | mRNA for Green fluorescent protein which is produced when the cells are ON. |
| GFP | Green fluorescent protein which is produced when the cells are ON. |
| mRNALuxI | mRNA for LuxI which is produced when the cells are ON. |
| LuxI | Enzyme catalysing the production of LuxAHL from SAM and ACP. |
The beads are the compartments containing the cells. The number of cells per bead is called N. The fraction of volume occupied by cells to total bead volume is $$\frac{V_{\text{internal to cells}}}{V_{\text{bead}}}=N \ \ V_{E. coli}$$
$$ \begin{align} \emptyset&\rightarrow LuxR \\ LuxAHLext & \leftrightarrow LuxAHLint\\ LuxAHLint+LuxR & \leftrightarrow RLux\\ RLux+RLux &\leftrightarrow DRLux\\ DRLux+P_{luxOFF} & \leftrightarrow P_{luxON}\\ P_{luxON}&\rightarrow P_{luxON}+mRNA_{GFP}\\ mRNA_{GFP}&\rightarrow GFP \end{align}$$
Equations
Deriving diffusion rates
We are using a reaction-diffusion model, which means that for internal and external AHL species which diffuse, we have to include a diffusion rate in addition to reaction rates from the quorum sensing module :
$$\frac{d[AHL]}{dt}=\mathcal{Diff}(AHL)+\mathcal{R}(AHL)$$
According to Fick's law of diffusion, the flow of AHL Φ(AHLint) (number of molecules per second) from the bead into the cells and the flow of AHL Φ (AHLext) from cells into the bead are
$$\Phi(AHL_{int}) = N \sigma \mathcal{A} ([AHL_{ext}]-[AHL_{int}]) \\ \Phi(AHL_{ext}) = N \sigma \mathcal{A} ([AHL_{int}]-[AHL_{ext}])$$
$$\text{where }\sigma \text { is the membrane permeability}$$
$$\mathcal{A} \text{ is the area of the membrane}$$
$$N \text{ is the number of cells per bead.}$$
Thus the diffusion rate of internal AHL (concentration per second) is :
$$ Diff(AHL_{int})=\frac{N \sigma \mathcal{A}}{V_{int}} ([AHL_{ext}]-[AHL_{int}])=D_m ([AHL_{ext}-[AHL_{int}]) $$
$$\text{where } V_{int} \text{ is the total volume of all cells}$$
$$D_m \text{ is a lumped coefficient for diffusion through the membrane}$$
and the diffusion rate of external AHL is $$Diff(AHL_{ext})=\frac{N \sigma \mathcal{A}}{V_{bead}} ([AHL_{ext}]-[AHL_{int}])= \frac{N V_{E.coli}}{V_{bead}}D_m([AHL_{ext}]-[AHL_{int}]) = N \alpha D_m([AHL_{ext}]-[AHL_{int}]) $$
$$ \text{where } \alpha = \frac{V_{E.coli}}{V_{bead}}$$ $$V_{E.coli} \text{ is the volume of one cell }$$ $$V_{bead}\text{ is the volume of one bead.} $$
Modeling growth
We have used a function of logistic growth function for the number of cells: $$ \frac{N_0 N_m e^{rt}}{N_m+N_0(e^{rt}-1)} $$ $$\text{where } N_0 \text{ is the initial number of cells per bead} $$ $$N_m \text{ is the maximum number of cells per bead}$$ $$r \text{ is the growth rate }$$
Set of equations used
$$ \begin{align*} \frac{d[AHLext]}{dt} &= \rho \ V_{E. coli}\ D_m \ (AHL_{int}-AHL_{ext}) -d_{AHLext}[AHL_{ext}]\\ \frac{d[AHLint]}{dt} &= Dm (AHL_{ext}-AHL_{int}) + k_{-RLux}[R_{Lux}]-k_{RLux}[LuxAHL_{int}][LuxR]-d_{AHLint}[AHL_{int}]\\ \frac{d[LuxR]}{dt} &= \alpha_{LuxR} -k_{RLux}[AHL_{int}][LuxR] + k_{-RLux}[RLux] - d_{LuxR}[LuxR] \\ \frac{d[RLux]}{dt} &= k_{RLux}[AHL_{int}][LuxR] - k_{-RLux}[RLux] - d_{RLux} [RLux] \\ \frac{d[mRNA_{GFP}]}{dt} &= \frac{k_{mRNA_{GFP}}[RLux]^2}{K_{mLux}^2 + [RLux]^2}- d_{mRNA_{GFP}} [mRNA_{GFP}]\\ \frac{d[GFP]}{dt} &= k_{GFP} [mRNA_{GFP}] - d_{GFP}[GFP]\\ \end{align*} $$
Initial conditions determined by bead preparation step
Non-induced cells, that is all cells except the one from the middle well of the first row have an initial LuxR concentration of LuxR due to constitutive production and degradation : $$ [LuxR_i]=\frac{a_{LuxR}}{d_{LuxR}} $$ The cells of the first row are induced by 10 μ M AHL just before they are encapsulated in alginate. Then, bead formation takes half-an-hour before these cells are added in the first well. During this half-an-hour AHL can diffuse out. Therefore initial conditions in the first cell completely depend on these previous steps. We have also simulated this bead preparation in order to get these initial conditions.
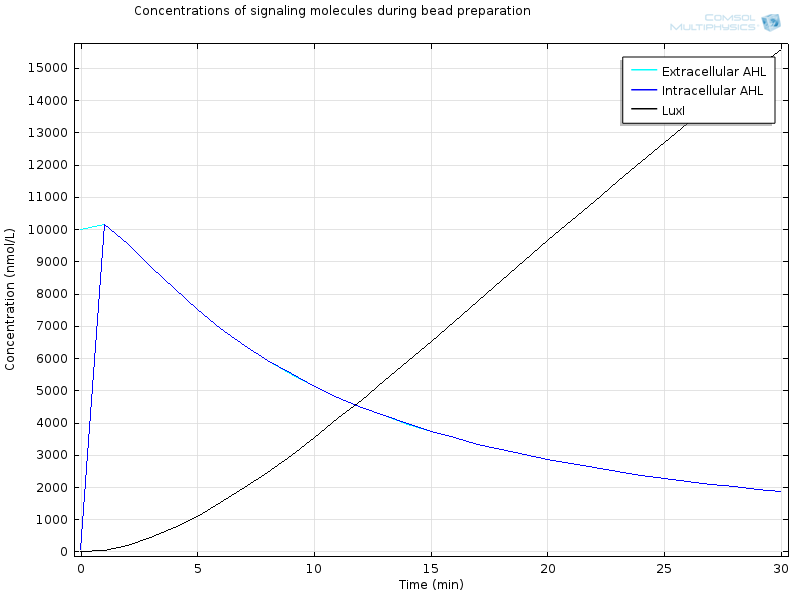
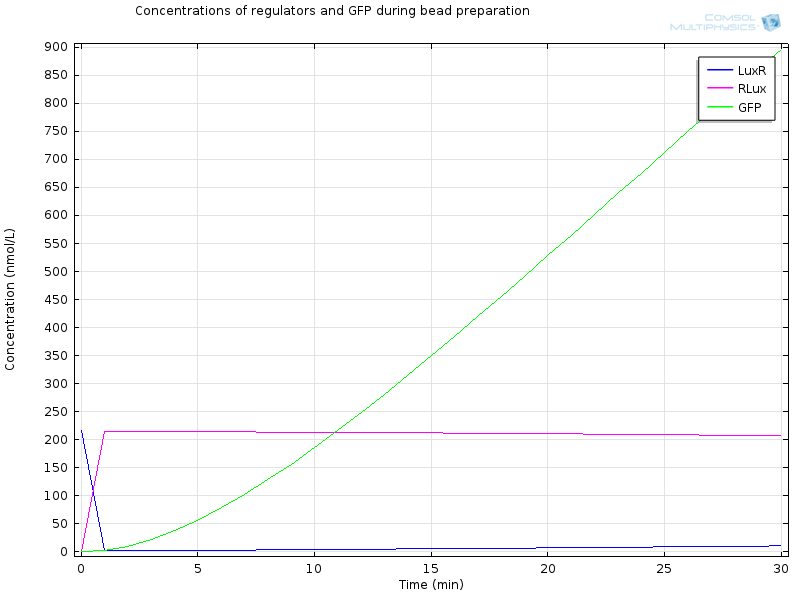
The geometry is a simple bead in a bigger compartment filled with calcium chloride. We look at the concentrations at the middle of the bead. Initial concentration of LuxR before bead diffusion starts is a classical steady state aLuxR/dLuxR
Extracellular AHL diffuses very fast through the membrane, which makes intracellular AHL increase, until both reach the same value and diffusion through the membrane reaches an equilibrium. From this point on AHL starts to bind to LuxR to form RLux, so AHL decreases, until RLux triggers enough production of LuxI which catalyses again AHL production, and makes AHL concentration become stable.
After 30 minutes, almost all LuxR is bound to AHL and converted to RLux, so that we have $$ [LuxR_i]= 10nM$$ $$ [RLux_i]= 160 nM$$
RLux has already started to trigger the production of LuxI and GFP, so that we have $$ [mRNAGFP_i] = 24nM$$ $$ [GFP_i] = 180nM$$ $$ [mRNALuxI_i] = 24nM$$ $$ [LuxI_i] = 3300nM$$
Parameter estimation
The initial number of beads is 10 million. A master thesis showed that in picoliter beads, the growth rate of cells is
Results
Pattern developing
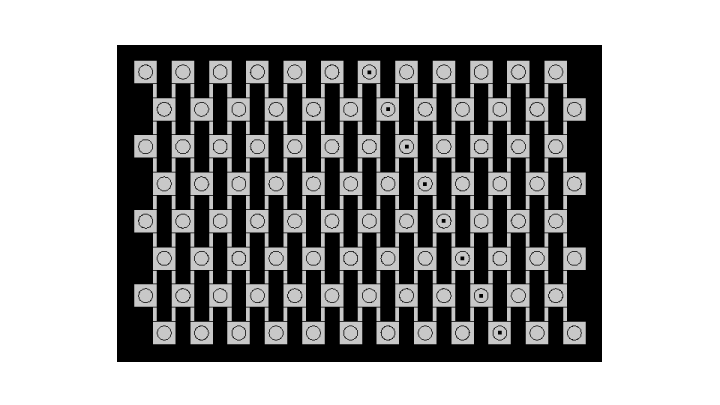
The developing pattern shows that every row senses the signal coming from above, amplifies it and is capable to send a signal to the next row, which is high enough to enable propagation until the bottom of the grid. We can see that the dynamics of the model are very well fitted to experimental conditions.
The background in our experimental setup is very high and this is high we see actual fluorescence appear only after 11 hours. In order to account for this, we also set up a background in the simulated pattern by adjusting the scale.
Video --------------------
Dynamics by row
Here you can see the quorum sensing mechanism happening in several rows at different moments. The first colony has a high initial concentration of AHL so at the beginning, AHL diffuses quickly out of the first colony. However as the first cell is strongly induced because of this AHL, a positive feedback is produced which will enable AHL concentration to reach a steady state. The colonies in the row below receive AHL progressively as opposed to the first colony which had an initial concentration, so the feedback in these colonies below has the time to happen immediately when AHL is received, and this is why AHL increases so fast in these colonies.
For simulation of the pattern, in order to be able to simulate fluorescence of the beads which is influenced by cell growth, we had to plot the concentration of GFP overall in a bead as opposed to the concentration of GFP in cells. Here we compare concentration of GFP in cells (doesn't account for growth) and overall concentration of GFP in a bead (accounts for growth) :
 "
"


