Team:Aachen/Interlab Study/Hardware
From 2014.igem.org
m (created) |
(→Hardware Requirements) |
||
| (14 intermediate revisions not shown) | |||
| Line 1: | Line 1: | ||
__NOTOC__ | __NOTOC__ | ||
{{Team:Aachen/Header}} | {{Team:Aachen/Header}} | ||
| + | |||
| + | = Commercial Hardware = | ||
| + | |||
| + | For the interlab study we used several devices to measure optical density (OD) and fluorescence. | ||
| + | |||
| + | |||
| + | {{Team:Aachen/BlockSeparator}} | ||
| + | |||
| + | = Open Source DIY Hardware = | ||
| + | |||
| + | Being in the measurement track and having a team of highly motivated engineering and computer science students, we tackled the challenge to build, document and evaluate our open source hardware approach. | ||
| + | |||
| + | For our daily tasks in the lab, two key devices were detected: fluorometer and OD-meter. As we use GFP most of the time, the fluorometer is designed to work best with GFP. For modularity reasons, and re-usability, it is designed such that a change to another fluorescence protein is easy. | ||
| + | |||
| + | Besides the mandatory $\mu$-controller architecture, we worked together with the [https://hci.rwth-aachen.de/fablab Fablab Aachen] to construct the device. There we have the chance to use laser cutters and 3D printers. | ||
| + | |||
| + | The core component for detecting the light intensity is the cuvette holder. Please find the 3D model we printed below: | ||
| + | |||
| + | <html> | ||
| + | <center> | ||
| + | <iframe src="https://2014.igem.org/Team:Aachen/Notebook/Engineering/Cuvette3D?action=render | ||
| + | " width=500px height=500px frameBorder="0"></iframe> | ||
| + | </center> | ||
| + | </html> | ||
| + | |||
| + | This cuvette holder can be used for both devices: the hole in the bottom is used for fluorescence measurement, the two opposite hole are used for the light sensor and the LED for optical density measurement respectively. | ||
| + | |||
| + | === Hardware Requirements === | ||
| + | |||
| + | The key ingredients for our combined optical density/fluorescence (OD/F) device then are: | ||
| + | |||
| + | * Arduino UNO R3 ''(or equivalent)'' | ||
| + | * breadboard and jumperwires ''(or: circuit board)'' | ||
| + | * bluetooth modem ''optional'' | ||
| + | * cuvette holder [https://2014.igem.org/Template:Team:Aachen/cuvette.stl?action=raw stl file download] | ||
| + | * TSL235R-LF light to frequency sensor | ||
| + | * LED for optical density (for 600nm we recommend: DIALIGHT - 550-2505F ) | ||
| + | * LED for fluorescence (any 450nm blue works for iLOV, 480nm for wtGFP ) | ||
| + | * [http://shop.leefiltersusa.com/Swatch-Book-Designers-Edition-SWB.htm Filters] Medium Yellow 010 and Twickenham Green 736 | ||
| + | |||
| + | The case is from acrylic glass. The construction plan can be downloaded from [https://2014.igem.org/Team:Aachen iGEM]. | ||
| + | |||
| + | A detailled instruction is available on [http://instructables.com instructables.com] | ||
| + | |||
| + | == Fluorescence == | ||
| + | |||
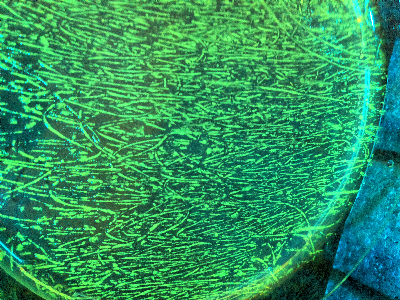
| + | [[File:Aachen_gfp_ecoli_plate_1.jpg|center|thumb|E. coli plate fluorescence|400px]] | ||
| + | When measuring fluorescence, two approaches can be followed | ||
| + | * measure the light intensity sent to fluorescence protein, measure returning light intensity and compare | ||
| + | * measure two samples, and detect the increase in light returned | ||
| + | |||
| + | which follows either an absolute or relative quantification. For most tasks however the relative increase in fluorescence is needed, and therefore this approach is also used for this device. | ||
| + | ''Figure 2'' shows the schematic principle of the fluorescence measurement with our device. | ||
| + | |||
| + | {{Team:Aachen/Figure|Aachen_gfp_ecoli_plate_1.jpg|alignment=float:center|title=Figure 2|subtitle=Schematics of fluorescence measurement|width=300px}} | ||
| + | |||
| + | === Characteristic Curve === | ||
| + | |||
| + | An important observation for fluorescence measurement is that the linearity of the measurement highly depends on the chosen light sensor. | ||
| + | If the light sensor is not linear over the spectrum of measurement, linearity would be needed to be corrected by software. Fortunately the characteristic curve of the TSL 235 R shows perfect linearity such that no software correction is needed. | ||
| + | |||
| + | This needed to be confirmed by measurements. We used an E. coli dilution series to perform this experiment. | ||
| + | ''Figure 3'' shows the recorded values. The linearity clearly can be seen, the regression coefficient of 0.99 also supports this. | ||
| + | |||
| + | == Optical Density == | ||
| + | |||
| + | Some general information | ||
| + | |||
| + | === calibration === | ||
{{Team:Aachen/Footer}} | {{Team:Aachen/Footer}} | ||
Latest revision as of 14:38, 27 September 2014
|
|
 "
"
