Team:Aachen/Notebook/Software/Measurarty
From 2014.igem.org
AZimmermann (Talk | contribs) (→Statistical Region Merging (SRM)) |
|||
| (7 intermediate revisions not shown) | |||
| Line 89: | Line 89: | ||
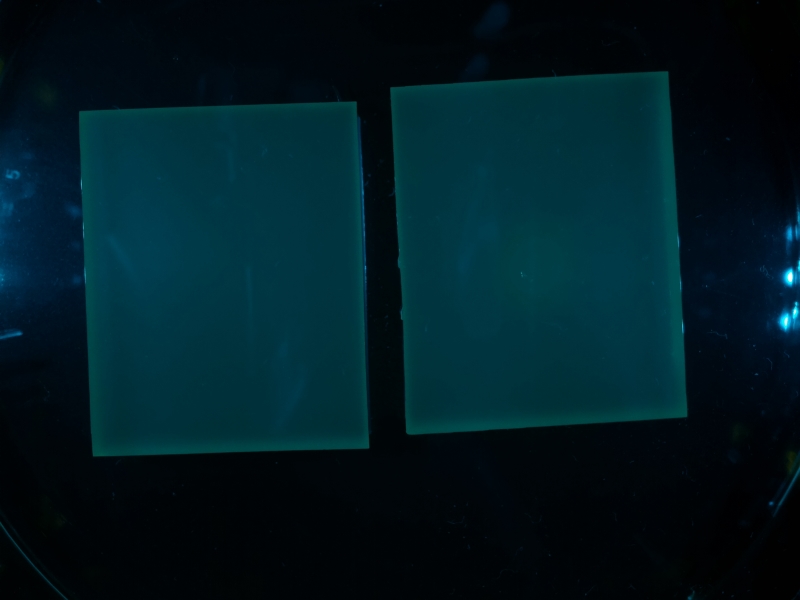
{{Team:Aachen/Figure|align=center|Aachen_meas_test.jpg|title=Image taken from WatsOn to be analyzed by ''Measurarty'' algorithm|width=700px}} | {{Team:Aachen/Figure|align=center|Aachen_meas_test.jpg|title=Image taken from WatsOn to be analyzed by ''Measurarty'' algorithm|width=700px}} | ||
| + | |||
{{Team:Aachen/BlockSeparator}} | {{Team:Aachen/BlockSeparator}} | ||
| Line 134: | Line 135: | ||
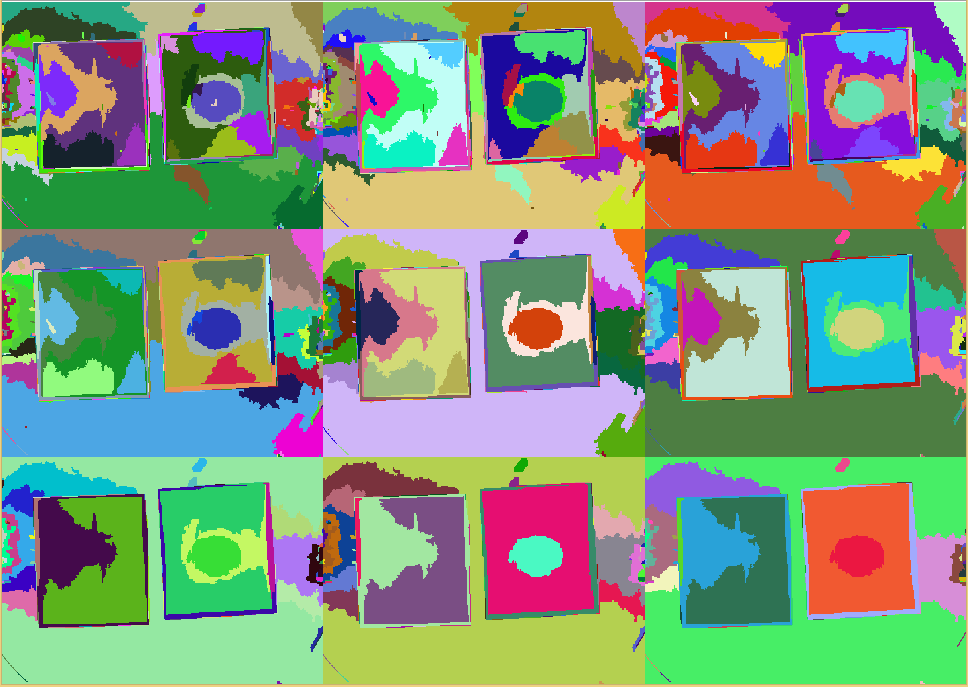
Finally, if applied to our test-image, regions are created and homogenoues regions form: | Finally, if applied to our test-image, regions are created and homogenoues regions form: | ||
| - | {{Team:Aachen/Figure|align=center|Aachen_meas_srmed.png|title= | + | {{Team:Aachen/Figure|align=center|Aachen_meas_srmed.png|title=Regions created with SRM clustering|width=700px}} |
| Line 199: | Line 200: | ||
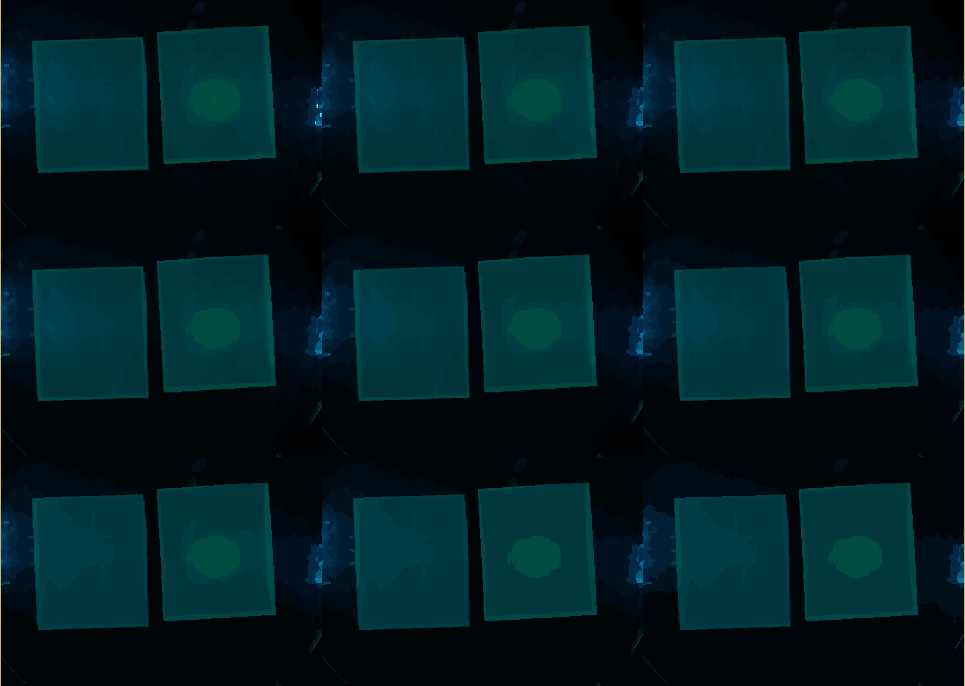
If you apply this HSV masking code to the SRMed test image, the following is created: | If you apply this HSV masking code to the SRMed test image, the following is created: | ||
| - | {{Team:Aachen/Figure|align=center|Aachen_meas_masked.png|title= | + | {{Team:Aachen/Figure|align=center|Aachen_meas_masked.png|title=Masked image|width=700px}} |
| + | |||
| + | |||
{{Team:Aachen/BlockSeparator}} | {{Team:Aachen/BlockSeparator}} | ||
| Line 231: | Line 234: | ||
=== Empirical Evaluation === | === Empirical Evaluation === | ||
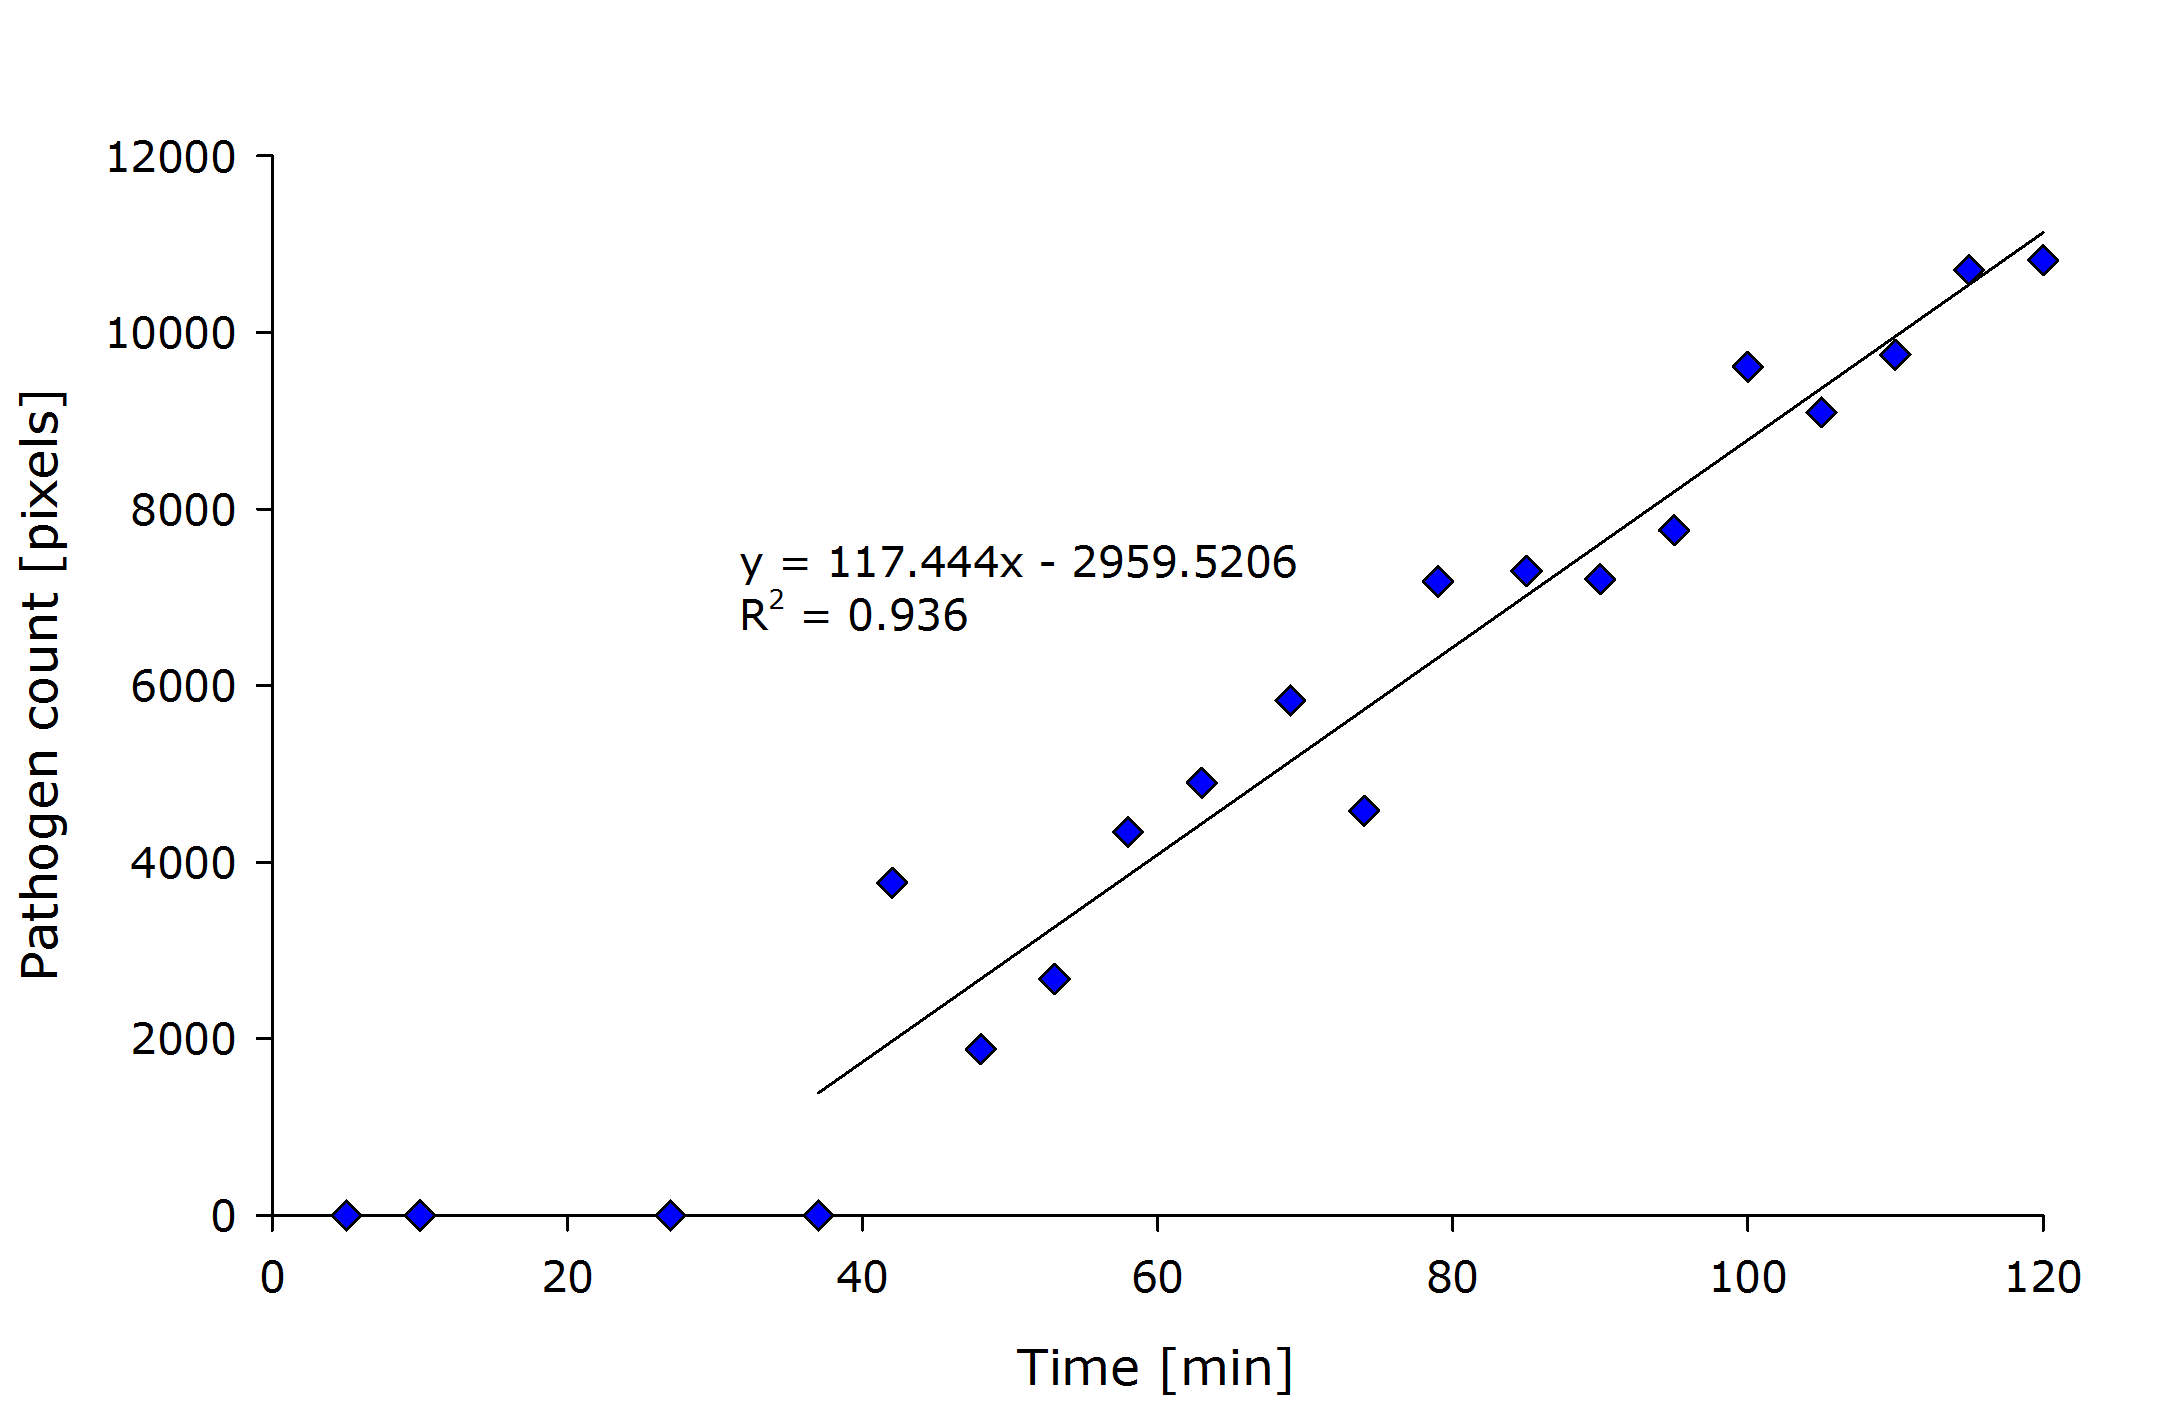
| - | Using our MATLAB code we found the lower threshold for the smoothness index to be $TS_l = 0.85$ and the upper threshold $TS_u = \infty$. | + | Using our MATLAB code, we found the lower threshold for the smoothness index to be $TS_l = 0.85$ and the upper threshold $TS_u = \infty$. |
Similarly, for $TI_l = 235$ and $TI_u = \infty$. | Similarly, for $TI_l = 235$ and $TI_u = \infty$. | ||
Using these settings, we can find a response already in images taken after 42 minutes. | Using these settings, we can find a response already in images taken after 42 minutes. | ||
| - | Ideally, one would rate the quality of the image segmentation using some ground truth, such as manual delineations. This still has to be | + | Ideally, one would rate the quality of the image segmentation using some ground truth, such as manual delineations. This still has to be implemented for our method. |
However, from visual observations, our method is showing promising results. | However, from visual observations, our method is showing promising results. | ||
| Line 290: | Line 293: | ||
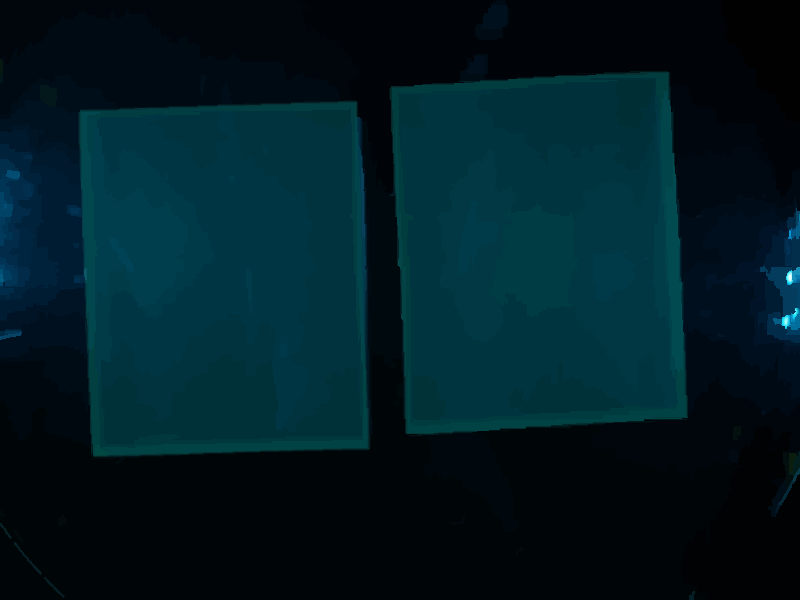
First the smoothed (disk-filter) input image is created and stored: | First the smoothed (disk-filter) input image is created and stored: | ||
| - | {{Team:Aachen/Figure|align=center|Aachen_meas_smoothed.png|title= | + | {{Team:Aachen/Figure|align=center|Aachen_meas_smoothed.png|title=Smoothed image|width=700px}} |
Only white regions are candidate regions. | Only white regions are candidate regions. | ||
| Line 299: | Line 302: | ||
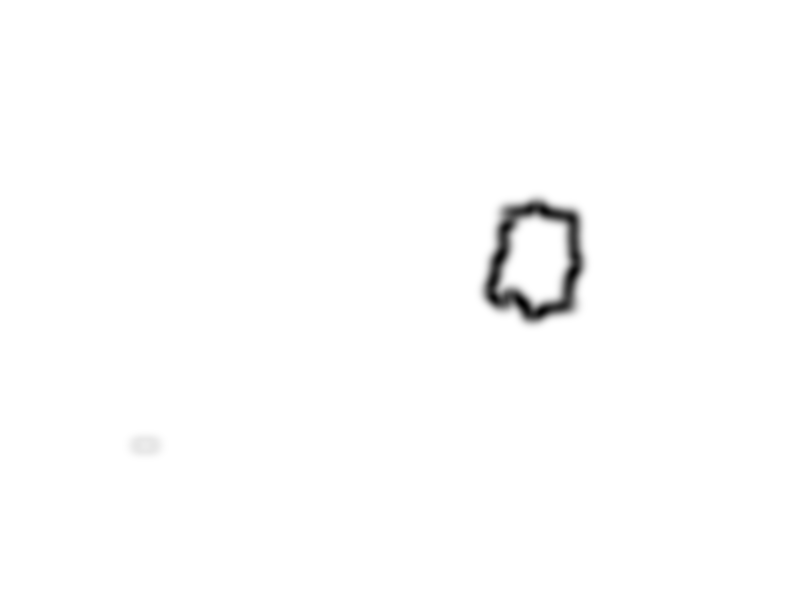
Finally the selected pathogen region is selected by the black area in the following picture: | Finally the selected pathogen region is selected by the black area in the following picture: | ||
| - | {{Team:Aachen/Figure|align=center|Aachen_meas_mask.png|title= | + | {{Team:Aachen/Figure|align=center|Aachen_meas_mask.png|title=Selected region|width=700px}} |
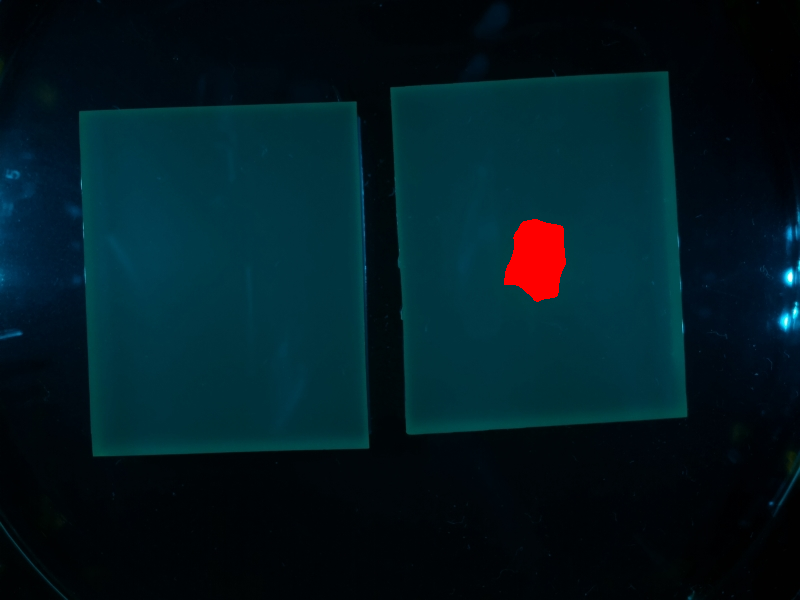
Combined with the input image, the final segmentation is received: | Combined with the input image, the final segmentation is received: | ||
| - | {{Team:Aachen/Figure|align=center|Aachen_meas_final.png|title= | + | {{Team:Aachen/Figure|align=center|Aachen_meas_final.png|title=Final the analyzed image|width=700px}} |
[[File:Aachen_14-10-15_Medal_Cellocks_iNB.png|right|150px]] | [[File:Aachen_14-10-15_Medal_Cellocks_iNB.png|right|150px]] | ||
| + | |||
| + | |||
{{Team:Aachen/BlockSeparator}} | {{Team:Aachen/BlockSeparator}} | ||
| Line 315: | Line 320: | ||
For example, changing from green to red fluorescence, only means to change the ''createMask'' function to select another target area. | For example, changing from green to red fluorescence, only means to change the ''createMask'' function to select another target area. | ||
| - | Overall the results | + | Overall the results are convincing. We have not yet performed a comparison to a manual delineation, however, by eye the results look promising and have a low error. |
Talking about computational complexity, the MATLAB code of course performs better than our own C++ implementation, which must be regarded as a proof-of-principle. | Talking about computational complexity, the MATLAB code of course performs better than our own C++ implementation, which must be regarded as a proof-of-principle. | ||
| Line 357: | Line 362: | ||
* [https://static.igem.org/mediawiki/2014/6/6e/Aachen_measurarty.zip MATLAB code] | * [https://static.igem.org/mediawiki/2014/6/6e/Aachen_measurarty.zip MATLAB code] | ||
| - | * link [https://github.com | + | * link [https://github.com/igemsoftware/AachenSoftProject2014/tree/master/measurarty github] |
For the C++ conversion please see [https://2014.igem.org/Team:Aachen/Notebook/Engineering/WatsOn#watsonsoftware our ''WatsOn'' Software] section. | For the C++ conversion please see [https://2014.igem.org/Team:Aachen/Notebook/Engineering/WatsOn#watsonsoftware our ''WatsOn'' Software] section. | ||
Latest revision as of 03:46, 18 October 2014
|
|
|
|
|
|
|
 "
"
