Team:ETH Zurich/modeling/int
From 2014.igem.org
(→Assumptions) |
m (→Data) |
||
| (6 intermediate revisions not shown) | |||
| Line 12: | Line 12: | ||
== Model == | == Model == | ||
| - | In our design, integrases compute the output of the logic gates. Integrases allow | + | In our design, integrases compute the output of the logic gates. Integrases allow flipping one fragment of DNA. Therefore, they are of central importance to our design. However, their characterization in literature<sup>[[Team:ETH_Zurich/project/references|[9]]]</sup> is incomplete. In particular, quantitative insight into dimerization rates and DNA-binding rates is lacking. Such data is however necessary in order to be able to set up a mathematical model to describe the overall Mosai''coli'' process. Thus, we decided to estimate the missing parameters from published from published experiments based on a model that we developed ourselves. |
<br/> | <br/> | ||
<br/> | <br/> | ||
| Line 121: | Line 121: | ||
|} | |} | ||
| - | + | Substituting ΦC31 for Bxb1 gives the set of parameters for ΦC31. The same status can be applied to those parameters. | |
<br/> | <br/> | ||
<br/> | <br/> | ||
| - | Even if degradation rates were not determined specifically for the serine integrases and their dimerized form, degradation rates of proteins in ''E. coli'' are available. We assume that the degradation rates of dimerized forms are two times higher than the degradation rates of monomers. Typically, d<sub>DBxb1</sub> = 2*d<sub>Bxb1</sub> To characterize | + | Even if degradation rates were not determined specifically for the serine integrases and their dimerized form, degradation rates of proteins in ''E. coli'' are available. We assume that the degradation rates of dimerized forms are two times higher than the degradation rates of monomers. Typically, d<sub>DBxb1</sub> = 2*d<sub>Bxb1</sub>. To characterize integrases behavior, we focused on estimating the parameters for dimerization and DNA-binding. |
<html></article></html> | <html></article></html> | ||
| Line 133: | Line 133: | ||
=== Data === | === Data === | ||
| - | The parameter fitting is based on data from Bonnet's paper<sup>[[Team:ETH_Zurich/project/references|[9]]]</sup>. Their experimental setup is different from ours. | + | The parameter fitting is based on the data available from Bonnet's paper<sup>[[Team:ETH_Zurich/project/references|[9]]]</sup>. Their experimental setup is different from ours. They induce the production of the integrase Bxb1 with aTc. Bxb1 can then flip a terminator put between a constitutive promoter and the gene for a reporter protein. They experimentally retrieve a transfer function between aTc and Bxb1 switching rate. Here is the figure of interest in our case. |
[[File:ETH Zurich Bonnet S4.jpg|center|400px|thumb|'''Figure 2''' Transfer function from aTc to Bxb1. The experimental data corresponds to the points. They fitted this data with their own model. Supplementary figure S4 of Bonnet's paper ''Amplifying Genetic Logic Gates''<sup>[[Team:ETH_Zurich/project/references|[9]]]</sup>.]] | [[File:ETH Zurich Bonnet S4.jpg|center|400px|thumb|'''Figure 2''' Transfer function from aTc to Bxb1. The experimental data corresponds to the points. They fitted this data with their own model. Supplementary figure S4 of Bonnet's paper ''Amplifying Genetic Logic Gates''<sup>[[Team:ETH_Zurich/project/references|[9]]]</sup>.]] | ||
| Line 192: | Line 192: | ||
;'''Assumption D''' | ;'''Assumption D''' | ||
:The activation by aTc is assumed to be dominant over degradation and dimerization of Bxb1. It is supposed to be valid on the range of aTc concentration considered. | :The activation by aTc is assumed to be dominant over degradation and dimerization of Bxb1. It is supposed to be valid on the range of aTc concentration considered. | ||
| - | $$\frac{k_{mRNA_{Bxb1}}*(A_L + B_L * \frac{[aTc]^n}{[aTc]^n+K_L^n})}{d_{Bxb1}K'_{DBxb1}} >> 1 | + | $$\frac{k_{mRNA_{Bxb1}}*\left(A_L + B_L * \frac{[aTc]^n}{[aTc]^n+K_L^n}\right)}{d_{Bxb1}K'_{DBxb1}} >> 1 |
$$ | $$ | ||
with | with | ||
| Line 203: | Line 203: | ||
We consider the system at steady-state. After derivation, the following explicit equation can be retrieved: | We consider the system at steady-state. After derivation, the following explicit equation can be retrieved: | ||
| - | $$[SR]_{qss} = {(\frac{B_{L} * [aTc]^{n}}{ \lambda_1 K_L^{n} + (B_{L} +\lambda_1) [aTc]^{n}})}^2 $$ | + | $$[SR]_{qss} = {\left(\frac{B_{L} * [aTc]^{n}}{ \lambda_1 K_L^{n} + (B_{L} +\lambda_1) [aTc]^{n}}\right)}^2 $$ |
where | where | ||
| Line 230: | Line 230: | ||
=== Data === | === Data === | ||
| - | The parameter fitting is based on Bonnet's paper<sup>[[Team:ETH_Zurich/project/references|[9]]]</sup>. Their experimental setup is different from ours. However, they experimentally retrieve a transfer function between aTc and Bxb1 switching rate. Here is the figure of interest in our case. | + | The parameter fitting is based on data from Bonnet's paper<sup>[[Team:ETH_Zurich/project/references|[9]]]</sup>. Their experimental setup is different from ours. However, they experimentally retrieve a transfer function between aTc and Bxb1 switching rate. Here is the figure of interest in our case. |
[[File:ETH Zurich Bonnet S4.jpg|center|400px|thumb|'''Figure 4''' Transfer function from aTc to Bxb1. The experimental data corresponds to the points. They fitted this data with their own model. Supplementary figure S4 of Bonnet's paper ''Amplifying Genetic Logic Gates''<sup>[[Team:ETH_Zurich/project/references|[9]]]</sup>]] | [[File:ETH Zurich Bonnet S4.jpg|center|400px|thumb|'''Figure 4''' Transfer function from aTc to Bxb1. The experimental data corresponds to the points. They fitted this data with their own model. Supplementary figure S4 of Bonnet's paper ''Amplifying Genetic Logic Gates''<sup>[[Team:ETH_Zurich/project/references|[9]]]</sup>]] | ||
| Line 241: | Line 241: | ||
=== Assumptions === | === Assumptions === | ||
| - | |||
| - | |||
| - | + | We keep the following assumptions from the previous characterization: '''assumption A''', '''assumption B''' and '''assumption C'''. A assumption is made: | |
| - | + | ||
| - | + | ||
| - | + | ||
| - | : | + | |
;'''Assumption E''' | ;'''Assumption E''' | ||
Latest revision as of 01:09, 18 October 2014
Integrases
Model
In our design, integrases compute the output of the logic gates. Integrases allow flipping one fragment of DNA. Therefore, they are of central importance to our design. However, their characterization in literature[9] is incomplete. In particular, quantitative insight into dimerization rates and DNA-binding rates is lacking. Such data is however necessary in order to be able to set up a mathematical model to describe the overall Mosaicoli process. Thus, we decided to estimate the missing parameters from published from published experiments based on a model that we developed ourselves.
Chemical Species
| Name | Description |
|---|---|
| Bxb1 | Serine integrase that can fold into two conformations - Bxb1a and Bxb1b. We chose to use a common connotation for both conformations - Bxb1. |
| ΦC31 | Serine integrase that can fold into two conformations - ΦC31a and ΦC31b. We chose to use a common connotation for both conformations - ΦC31. |
| DBxb1 | Dimerized form of Bxb1. We chose to use a common connotation for both homodimers, DBxb1a and DBxb1b. |
| DΦC31 | Dimerized form of ΦC31. We chose to use a common connotation for both homodimers, DΦC31a and DΦC31b. |
Modeling DNA-binding sites
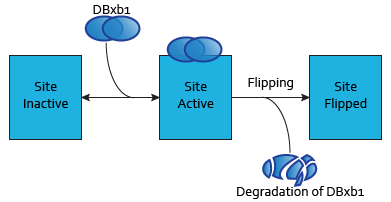
Each dimer of integrases can specifically bind to a DNA binding site. As the flipping is irreversible, these DNA binding sites can be in three possible states:
- SIIntegraseName: inactive DNA binding site. No dimer is bound to this site, which has never been flipped.
- SAIntegraseName: active DNA binding site. A dimer is bound to this site.
- SFIntegraseName: flipped DNA binding site. This site has been irreversibly flipped.
Reactions
- For Bxb1
$$ \begin{align} Bxb1 + Bxb1 &\leftrightarrow DBxb1 \\ DBxb1 + SI_{Bxb1} & \leftrightarrow SA_{Bxb1}\\ Bxb1 &\rightarrow \\ DBxb1 &\rightarrow \end{align}$$
- For ΦC31
\begin{align} \phi C31 + \phi C31 &\leftrightarrow D\phi C 31 \\ D\phi C 31 + SI_{\phi C31} & \leftrightarrow SA_{\phi C31}\\ \phi C31 &\rightarrow \\ D\phi C31 &\rightarrow \end{align}
Differential Equations
Applying mass action kinetic laws, we obtain the following set of differential equations for Bxb1.
$$\frac{d[Bxb1]}{dt}=-2 k_{DBxb1}[Bxb1]^2+ 2 k_{-DBxb1}[DBxb1]-d_{Bxb1}[Bxb1]$$
$$\frac{d[DBxb1]}{dt}=-k_{SABxb1}[DBxb1][SI_{Bxb1}]+k_{-SABxb1}[SA_{Bxb1}]+k_{DBxb1}[Bxb1]^2-k_{-DBxb1}[DBxb1]-d_{DBxb1}[DBxb1]$$
$$\frac{d[SA_{Bxb1}]}{dt}=k_{SABxb1}[DBxb1][SI_{Bxb1}]-k_{-SABxb1}[SA_{Bxb1}]$$
Replacing every occurence of Bxb1 by ΦC31 gives the set of differential equations for ΦC31.
State of the Art
| Name | Description | Status from literature | Status after characterization |
|---|---|---|---|
| kDBxb1 | Dimerization rate of Bxb1 | Unknown | Fitted with Bonnet's data[9] |
| k-DBxb1 | Dissociation rate of DBxb1 | Unknown | Fitted with Bonnet's data[9] |
| kSABxb1 | Rate of formation of SABxb1 from DBxb1 and SIBxb1 | Unknown | Fitted with Bonnet's data[9] |
| k-SABxb1 | Dissociation rate of SABxb1 | Unknown | Fitted with Bonnet's data[9] |
| dBxb1 | Degradation rate of Bxb1 | Unknown | Assumed |
| dDBxb1 | Degradation rate of DBxb1 | Unknown | Assumed |
Substituting ΦC31 for Bxb1 gives the set of parameters for ΦC31. The same status can be applied to those parameters.
Even if degradation rates were not determined specifically for the serine integrases and their dimerized form, degradation rates of proteins in E. coli are available. We assume that the degradation rates of dimerized forms are two times higher than the degradation rates of monomers. Typically, dDBxb1 = 2*dBxb1. To characterize integrases behavior, we focused on estimating the parameters for dimerization and DNA-binding.
Characterization of the integrase DNA-binding reaction
Data
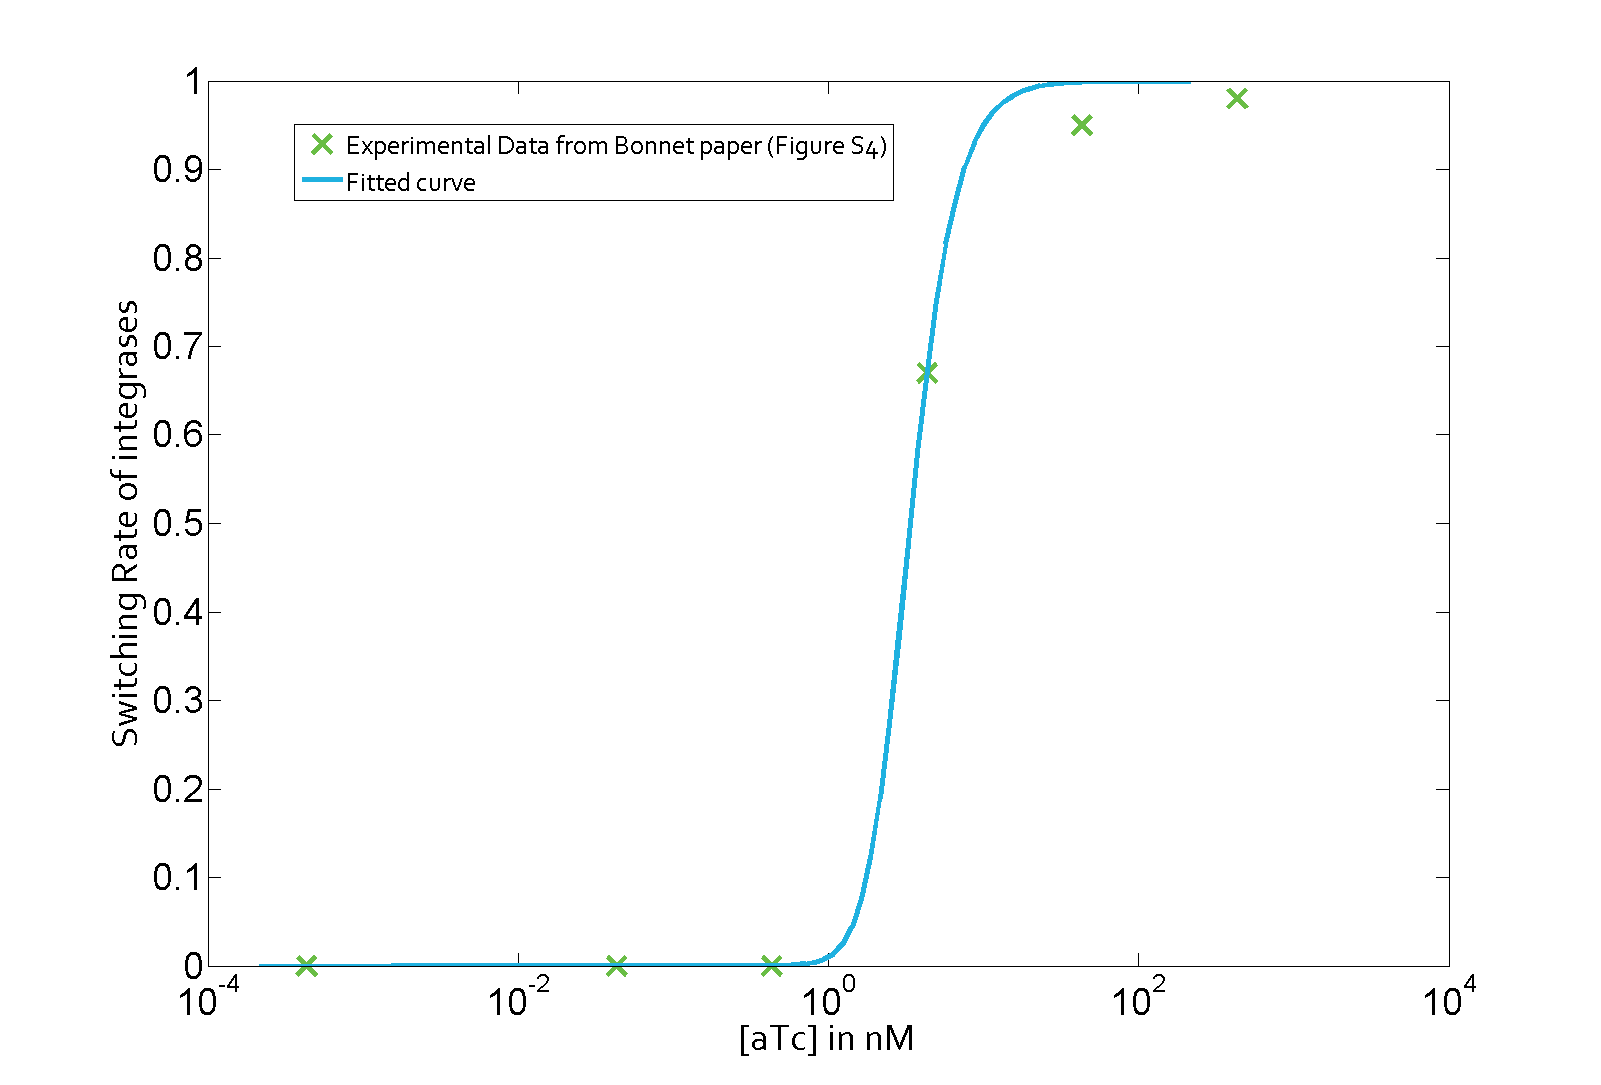
The parameter fitting is based on the data available from Bonnet's paper[9]. Their experimental setup is different from ours. They induce the production of the integrase Bxb1 with aTc. Bxb1 can then flip a terminator put between a constitutive promoter and the gene for a reporter protein. They experimentally retrieve a transfer function between aTc and Bxb1 switching rate. Here is the figure of interest in our case.
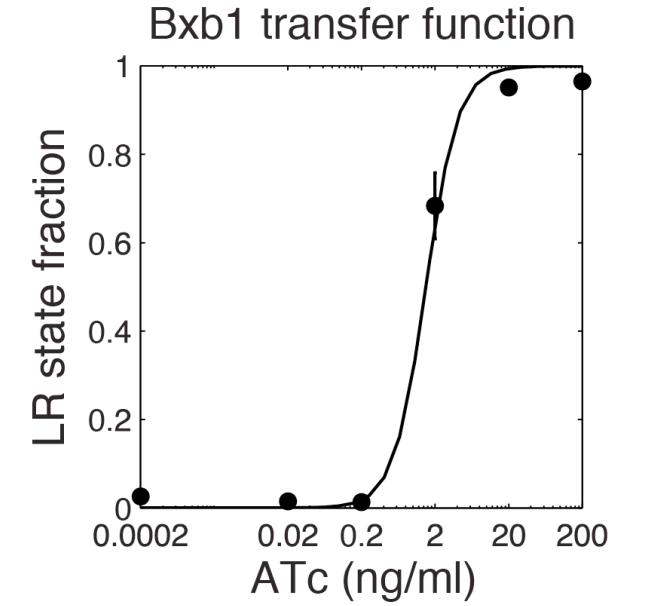
To use their experimental data, we have to model their induction mechanism using aTc. We use a simplified version of this phenomenon proposed by the 2013 iGEM team UCSF. They modeled the induction with aTc as a leaky Hill function. In the following table are the set of parameters introduced to model induction.
| Name | Value | Description | Reference |
|---|---|---|---|
| AL | 8.904 mRNA min-1 | Basal expression level of tet promoter | [2013 iGEM team UCSF] |
| BL | 443.7 mRNA min-1 | Maximal expresion level of tet promoter | [2013 iGEM team UCSF] |
| n | 2.551 (no units) | Hill exponent | [2013 iGEM team UCSF] |
| KL | 11.45 µmoles | Half-maximal effective concentration of aTc | [2013 iGEM team UCSF] |
| kmRNABxb1 | Unknown | Translation rate of Bxb1 | Assumed |
We obtain the following set of differential equations:
$$\begin{align*} \frac{d[Bxb1]}{dt} &= k_{mRNA_{Bxb1}}*(A_L + B_L * \frac{[aTc]^n}{[aTc]^n+K_L^n})- 2 k_{DBxb1}*[Bxb1]^2 + 2k_{-DBxb1}*[DBxb1] - d_{Bxb1}*[Bxb1] \\ \frac{d[DBxb1]}{dt} &= k_{DBxb1}*[Bxb1]^2 - k_{-DBxb1}*[DBxb1] - k_{SABxb1}*[DBxb1]*[SI_{Bxb1}] + k_{-SABxb1}*[SA_{Bxb1}] - d_{DBxb1}*[DBxb1] \\ \frac{d[SA_{Bxb1}]}{dt} &= k_{SABxb1}*[DBxb1]*[SI_{Bxb1}] - k_{-SABxb1}*[SA_{Bxb1}] \end{align*}$$
Assumptions
- Assumption A
- The back-reaction from DBxb1 binding to the inactive site state is considered to be negligible compared to the flipping rate. That is to say that once a site is active, it can only be flipped. Thus, an active site would only be a transitional state in our whole cell model. As the flipping is not modeled in our integrase subsystem, active sites are not transformed into flipped sites at the end of the information pipeline. Thus, we consider that we can express the switching rate given active site concentration.
- Assumption B
- As switching needs two active sites to be effective (for more information on flipping, check the XOR gate page), the switching rate is approximated to: $${\left(\frac{SA_{Bxb1}}{S_{TOT}}\right)}^2$$ This approximation is understated by probabilistic considerations.
- Assumption C
- Given the normalization of the paper, basal rate of production of Bxb1 is not taken into account. Thus, we consider that $$A_L = 0$$
- Assumption D
- The activation by aTc is assumed to be dominant over degradation and dimerization of Bxb1. It is supposed to be valid on the range of aTc concentration considered.
$$\frac{k_{mRNA_{Bxb1}}*\left(A_L + B_L * \frac{[aTc]^n}{[aTc]^n+K_L^n}\right)}{d_{Bxb1}K'_{DBxb1}} >> 1 $$ with $$K'_{DBxb1} = \frac{k_{-DBxb1} + d_{DBxb1}}{k_{DBxb1}} $$
Parameter fitting
We consider the system at steady-state. After derivation, the following explicit equation can be retrieved:
$$[SR]_{qss} = {\left(\frac{B_{L} * [aTc]^{n}}{ \lambda_1 K_L^{n} + (B_{L} +\lambda_1) [aTc]^{n}}\right)}^2 $$
where $$ \lambda_1 = \frac{2*d_{Bxb1}*K_{SABxb1}}{k_{mRNA_{Bxb1}}} ; K_{SABxb1} = \frac{k_{-SABxb1}}{k_{SABxb1}} $$
Using the Least Absolute Residual method, we determined the lumped parameter λ1. Here is the value with its 95% confidence bounds:
$$\lambda_1 = 1.82e-07 (1.649e-07, 1.992e-07)$$
We assume that:
- dBxb1 corresponds to the order of magnitude of 10-2 min-1, as most of the protein in E. coli [17].
- kmRNABxb1 is of the order of magnitude 10-1 min-1 mRNA-1. We estimated to be a low value because the starting codon of Bxb1 is GTG (and not ATG) and this parameter also takes into account folding time.
Thus, KSABxb1's order of magnitude is 10-6 nM. The interpretation of this dissociation constant, KSABxb1, is that the DNA binding reaction is really specific, as it can be expected for integrases.
By assuming that kSABxb1, the rate of formation of SABxb1, is not rate limiting and fixing it to 1, we find that k-SABxb1's order of magnitude is 10-6 nM.
Characterization of the dimerization reaction
Data
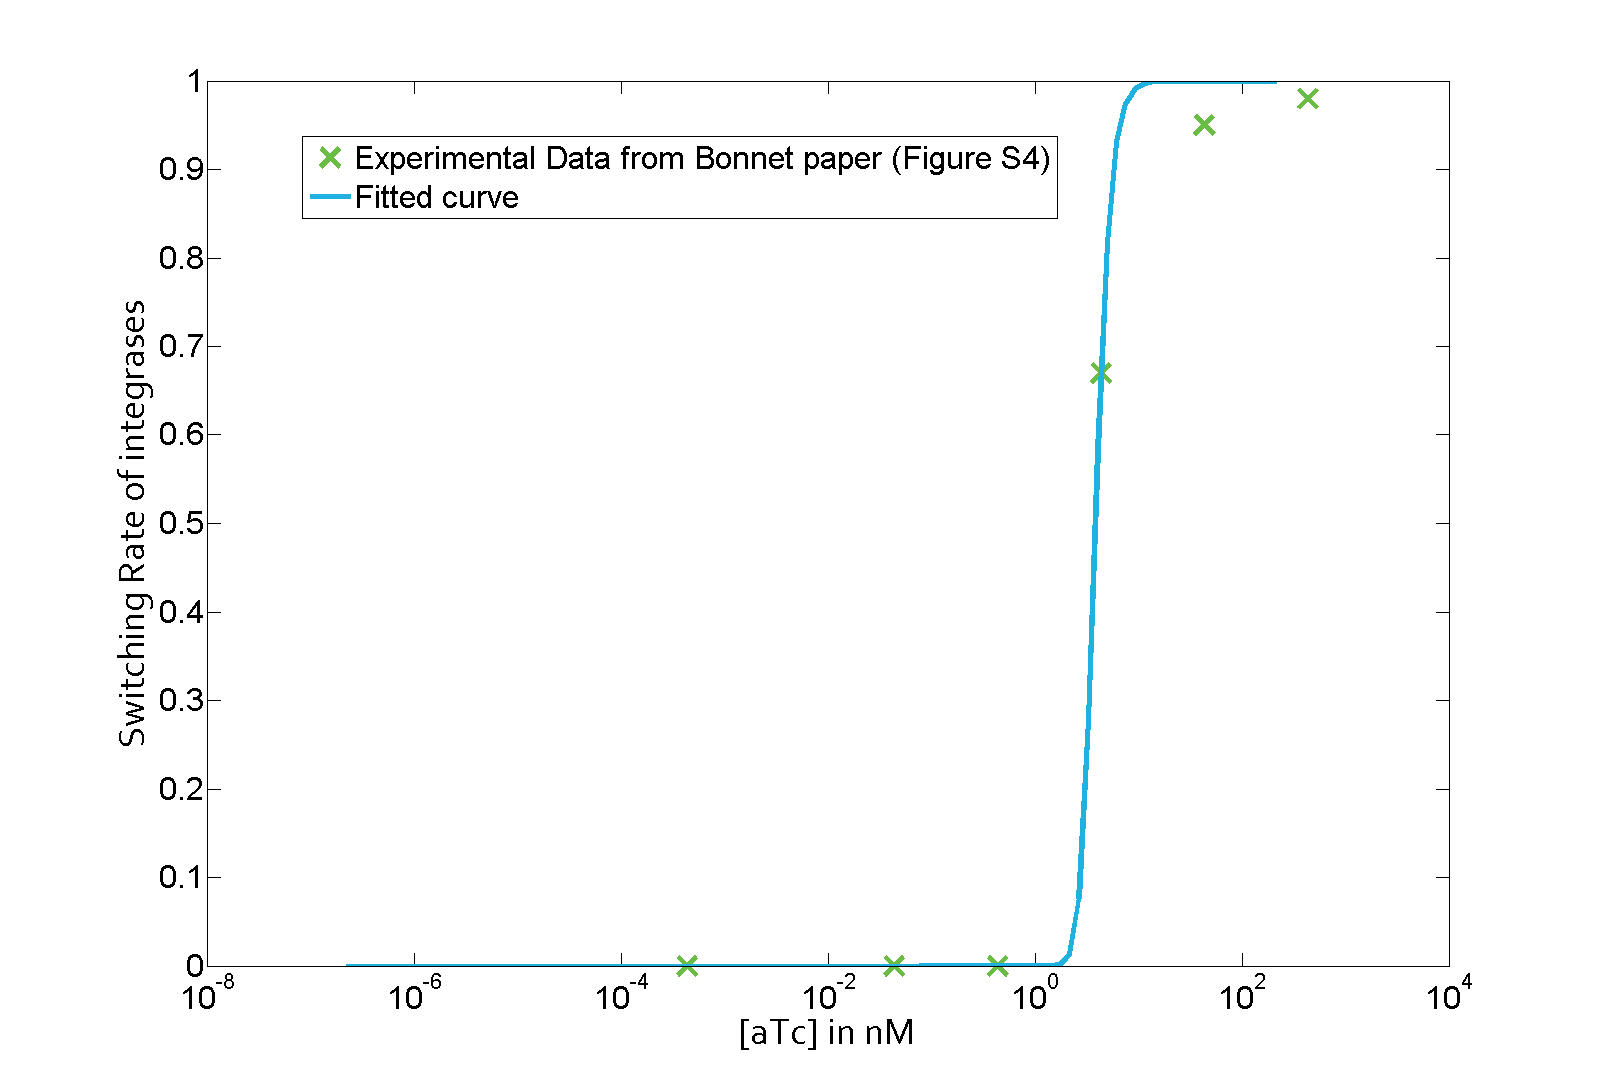
The parameter fitting is based on data from Bonnet's paper[9]. Their experimental setup is different from ours. However, they experimentally retrieve a transfer function between aTc and Bxb1 switching rate. Here is the figure of interest in our case.

We do the same modeling steps, as for the previous characterization.Thus, we obtain the following set of differential equations:$$\begin{align*} \frac{d[Bxb1]}{dt} &= a_{}*(A_L + B_L * \frac{[aTc]^n}{[aTc]^n+K_L^n})- 2 k_{DBxb1}*[Bxb1]^2 + 2k_{-DBxb1}*[DBxb1] - d_{Bxb1}*[Bxb1] \\ \frac{d[DBxb1]}{dt} &= k_{DBxb1}*[Bxb1]^2 - k_{-DBxb1}*[DBxb1] - k_{SABxb1}*[DBxb1]*[SI_{Bxb1}] + k_{-SABxb1}*[SA_{Bxb1}] - d_{DBxb1}*[DBxb1] \\ \frac{d[SA_{Bxb1}]}{dt} &= k_{SABxb1}*[DBxb1]*[SI_{Bxb1}] - k_{-SABxb1}*[SA_{Bxb1}] \end{align*}$$
Assumptions
We keep the following assumptions from the previous characterization: assumption A, assumption B and assumption C. A assumption is made:
- Assumption E
- We neglect the degradation rate of DBxb1, dDBxb1, with respect to the dimerization reaction.
Parameter fitting
We consider the system at steady-state. After derivation, the following explicit equation can be retrieved:
$$[SR]_ = {(\frac{(B_{L} * [aTc]^{n})^2}{((B_{L} * [aTc]^{n})^2 + \lambda_2 * \lambda_1 (K_{L}^{n} + [aTc]^{n})^2))}})^2$$
where $$ \lambda_1 = \frac{2*d_{Bxb1}*K_{SABxb1}}{k_{mRNA_{Bxb1}}} ; \lambda_2 = \frac{d_{Bxb1}*K_{SABxb1}}{2 *k_{mRNA_{Bxb1}}}; K_{DBxb1} = \frac{k_{-DBxb1}}{k_{DBxb1}}; K_{SABxb1} = \frac{k_{-SABxb1}}{k_{SABxb1}} $$
As the value of λ1 was derived in the previous characterization step, we use the Least Absolute Residual method to determine the lumped parameter λ2. Here is the value with its 95% confidence bounds:
$$\lambda_2 = 8.211e-07 (7.421e-07, 9.001e-07))$$
We assume that:
- dBxb1 corresponds to the order of magnitude of 10-2 min-1, as most of the protein in E. coli [17].
- kmRNABxb1 is of the order of magnitude 10-1 min-1 mRNA-1. We estimated to be a low value because the starting codon of Bxb1 is GTG (and not ATG) and this parameter also takes into account folding time.
Thus, KDBxb1's order of magnitude is 10-6 nM. The interpretation of this dissociation rate constant is that the dimerization reaction is really specific, as it can be expected for integrases.
By assuming that kDBxb1, the rate of formation of DBxb1, is not rate limiting and fixing it to 1, we find that k-DBxb1's order of magnitude is 10-6 nM.
Results
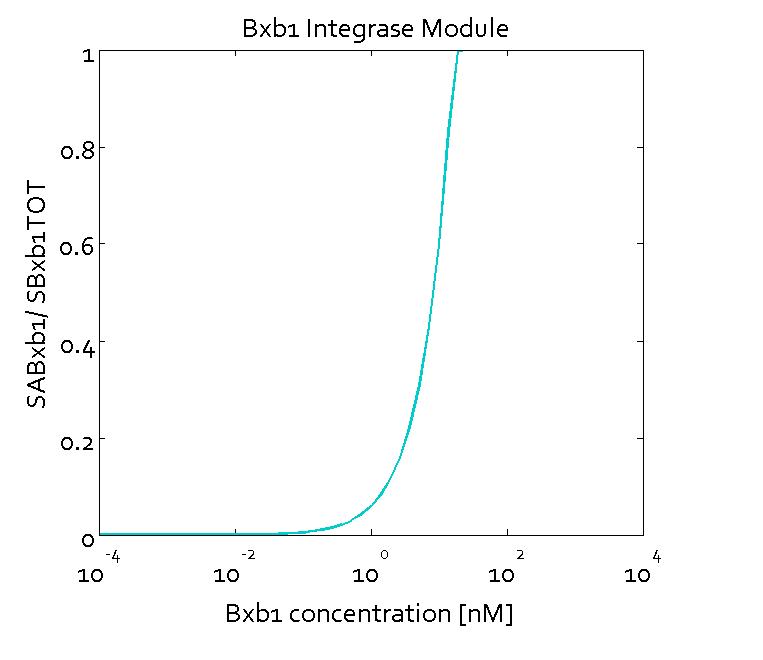
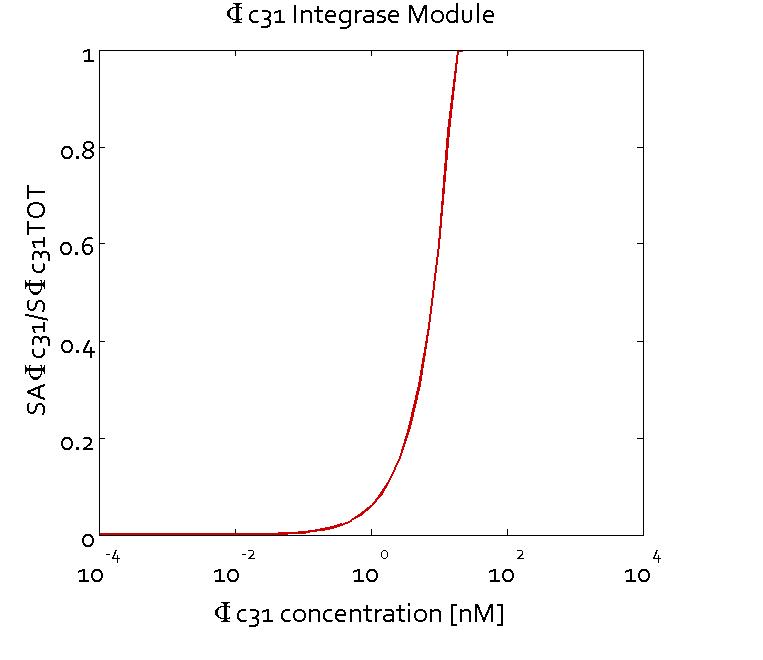
The figures show the predicted transfer function for the ratios of active sites of Bxb1 (SABxb1) to total number of sites (SBxb1TOT) and active sites of ΦC31 (SAΦC31) to total number of sites (SΦC31TOT) as a function of their respective integrase concentrations based on the fitted parameters. With the fitted parameters, we found the Km value to be 10 nM.
 "
"


