Team:Aachen/Project/Model

From 2014.igem.org

(Difference between revisions)
(Modeling)
(Modeling)
 
(17 intermediate revisions not shown)
Line 6: Line 6:
=Modeling=
=Modeling=
<center>
<center>
-
{{Team:Aachen/FigureFloat|Aachen 14-10-16 REACh approach iFG.png|align=center|title=An amplified reporter system|subtitle=Expression of the TEV protease is induced by 3-oxo-C<sub>12</sub>-HSL. The protease cleaves the GFP-REACh fusion protein to elicit a fluorescence response.|width=630px}}
+
{{Team:Aachen/FigureFloat|Aachen 14-10-16 REACh approach iFG.png|align=center|title=Molecular approach|subtitle=Expression of the TEV protease is induced by 3-oxo-C<sub>12</sub>-HSL. The protease cleaves the GFP-REACh fusion protein to elicit a fluorescence response.|width=630px}}
</center>
</center>
 +
<center>
<center>
Line 13: Line 14:
</center>
</center>
-
For our two-dimensional biosensor, we thought of different methods to generate a faster and stronger fluorescent response from weak promoters. In our molecular approach (left) to detect ''P. aeruginosa'', a fusion protein of GFP and the dark quencher is cleaved by the very specific TEV protease which is introduced behind the weak quorum sensing promoter.
+
For our two-dimensional biosensor, we thought of different methods to generate a faster and stronger fluorescence response from weak promoters. In our molecular approach (left) to detect ''P. aeruginosa'', a fusion protein of GFP and the dark quencher is cleaved by the highly specific TEV protease which is introduced behind the weak quorum sensing promoter.  
-
 
+
-
To validate our hypothesis, we developed a model of the molecular approach using the CAD tool TinkerCell (Chandran, Bergmann and Sauro, 2009).
+
-
 
+
-
To compare the response time of the fluorescence signal between our theoretical system and a traditional biosensor, we included a direct expression of GFP in the same plot (below). In the results shown below, the strength of the promoter used for the direct GFP expression (traditional approach) is even twice as high as the strength of the promoter upstream of the TEV coding sequence in our new approach. Despite the weaker promoter, a '''higher GFP concentration is generated in the model of the novel biosensor''', predicting a quicker response time of our system.
+
 +
To validate our hypothesis, we developed a model of our molecular approach using the CAD tool TinkerCell (Chandran, Bergmann and Sauro, 2009).
<center>
<center>
-
{{Team:Aachen/Figure|Aachen_Model_merged.png|align=center|title=Model of the molecular approach and the output over time|subtitle=The molecular setup of the novel biosensor (left) yields results indicating a strong and fast fluorescence output after induction (right). A directly inducible system was modeled and added to the plot for comparison.|width=1000px}}
+
{{Team:Aachen/Figure|Aachen_Model_merged.png|align=center|title=Model of our molecular approach in TinkerCell (A) and the output over time (B)|subtitle=The molecular setup of the novel 3-oxo-C<sub>12</sub>-HSL inducible biosensor (A) yields results indicating a strong and fast fluorescence output after induction (B). A directly inducible system was modeled and added to the plot for comparison.|width=1000px}}
</center>
</center>
 +
In the figure displayed above, we compare the response time of the fluorescence signal between our theoretical system and a traditional biosensor, we included a direct expression of GFP in the same plot. In the results shown above, the strength of the promoter used for the direct GFP expression (traditional approach) is twice as high as the strength of the promoter upstream of the TEV coding sequence in our new approach. Despite a weaker promoter, a '''higher GFP concentration is generated in the model of the novel biosensor''', predicting a quicker response time of our system.
The model predicted that our approach should be an improvement over the commonly used direct expression, so we proceeded with the clonings and assembled plasmids to test the system.
-
As the first experimental data came in, we correlated the experimental data gathered from the characterization of the double plasmid system K1319014&nbsp;+&nbsp;K1319008 to the model. Due to the complexity of the quorum sensing circuit, we assembled an IPTG-inducible TEV protease instead of the 3-oxo-C<sub>12</sub>-HSL-inducible version.
+
Due to the complexity of the quorum sensing circuit, we assembled an IPTG-inducible TEV protease instead of the 3-oxo-C<sub>12</sub>-HSL-inducible version.
-
Although the modeled system and the existing system differ regarding the induction mechanism, the correlation was high. However, since the final 3-oxo-C<sub>12</sub>-HSL inducible construct could not be built in time, a new model was designed according to the existing and functional double plasmid system.  
+
Although the modeled and the existing double plasmid system differ regarding the induction mechanism, a '''high correlation between the model predictions and the experimental data''' was observed. However, a new model was designed according to the existing and functional IPTG-inducible system.  
-
 
+
<center>
<center>
-
{{Team:Aachen/Figure|Aachen_Model_IPTG_merged.png|align=center|title=Revised model of the molecular approach and output over time.|subtitle=This model is for the IPTG-inducible double plasmid system (left) and the calculated output (right). Experimental data was included in the plot for comparison and data validation.|width=1000px}}
+
{{Team:Aachen/Figure|Aachen_Model_IPTG_merged.png|align=center|title=Revised model of the molecular approach (A) and output over time (B).|subtitle=This model is for the IPTG-inducible double plasmid system (A) and the calculated output (B). Experimental data was included in the plot for comparison and data validation.|width=1000px}}
</center>
</center>
 +
The model was optimized to fit the data generated from the characterization experiment conducted in shake flasks. Additionally, the data from the characterization experiment of the double plasmid construct (K1319014 + K1319008) in the chip system was included in the plot above. The data was derived from the plate reader output of the four central spots of the chip. The background from the non-induced chip was substracted from the fluorescence response to correct the data and avoid effects from cell growth leading to wrong signal strengths. The development of the fluorescence is presented [https://2014.igem.org/Team:Aachen/Project/FRET_Reporter#reachachievementschip here].
-
The model was fitted to the data gathered from the characterization experiment conducted in shake flasks. Additionally, the data from the characterization experiment of the double plasmid construct K1319014 + K1319008 in the chip system was included in the plot. The data was derived from the plate reader output of the four central spots of the chip. The background from the non-induced chip was substracted from the fluorescent response to correct the data and avoid effects from cell growth leading to wrong signal strengths. The development of the fluorescence is presented [https://2014.igem.org/Team:Aachen/Project/FRET_Reporter#reachachievementschip here].  
+
It is shown that the fluorescence response in chips develops later than in the characterization experiment in shake flasks. This is because the solid agar chip provides a higher diffusion barrier than liquid medium as used in the shake flasks. Further, a high oxygen transfer rate in shake flask cultivations enhances the rate of fluorescence development, as oxygen is needed for GFP production, in comparison to the cultivation in chips.  
-
It is shown that the fluorescent response in chips occurs later than in the characterization experiment in shake flasks. This is explainable as the solid agar chip poses a greater diffusion barrier than liquid medium as used in the shake flasks. Further, the rate of fluorescence increase over time is smaller than in the characterization experiments in shake flasks. The reason is that the sensor cells need oxygen to produce GFP. However, they are embedded in solid agar in which the amount of available oxygen is lower compared to a shaking liquid system.
+
The model predictions correlate with the data generated from the characterization experiments, thus validating our molecular approach. With an iterative cycle of modeling, '''a faster and stronger fluorescence signal could be proven both theoretically and empirically'''.  
-
 
+
-
The right prediction of the outcome of the characteization experiments by the model shows that our molecular approach is valid. A faster and stronger fluorescent signal could be proven both theoretically and empirically.  
+
{{Team:Aachen/BlockSeparator}}
==References==
==References==
-
* Ganesan et al. (2006). 
 
* Chandran, D., Bergmann, F. T., & Sauro, H. M. (2009). TinkerCell: modular CAD tool for synthetic biology. Journal of biological engineering, 3(1), 19. doi: 10.1186/1754-1611-3-19
-
 
{{Team:Aachen/Footer}}

Latest revision as of 03:26, 18 October 2014

Modeling

Aachen 14-10-16 REACh approach iFG.png
Molecular approach
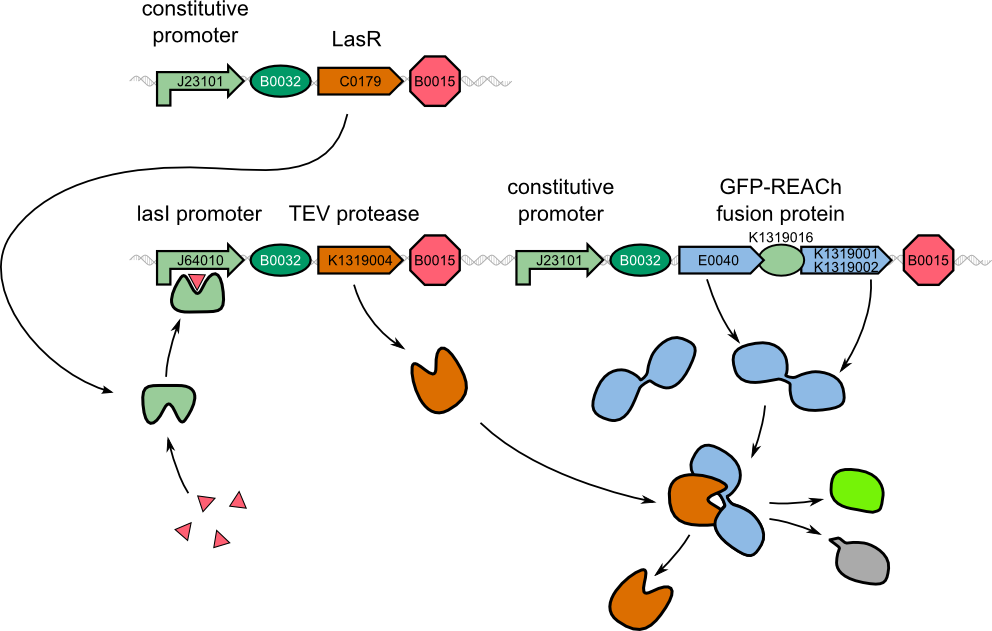
Expression of the TEV protease is induced by 3-oxo-C12-HSL. The protease cleaves the GFP-REACh fusion protein to elicit a fluorescence response.


Aachen Modeling Flowchart.png
Modeling Flowchart

For our two-dimensional biosensor, we thought of different methods to generate a faster and stronger fluorescence response from weak promoters. In our molecular approach (left) to detect P. aeruginosa, a fusion protein of GFP and the dark quencher is cleaved by the highly specific TEV protease which is introduced behind the weak quorum sensing promoter.

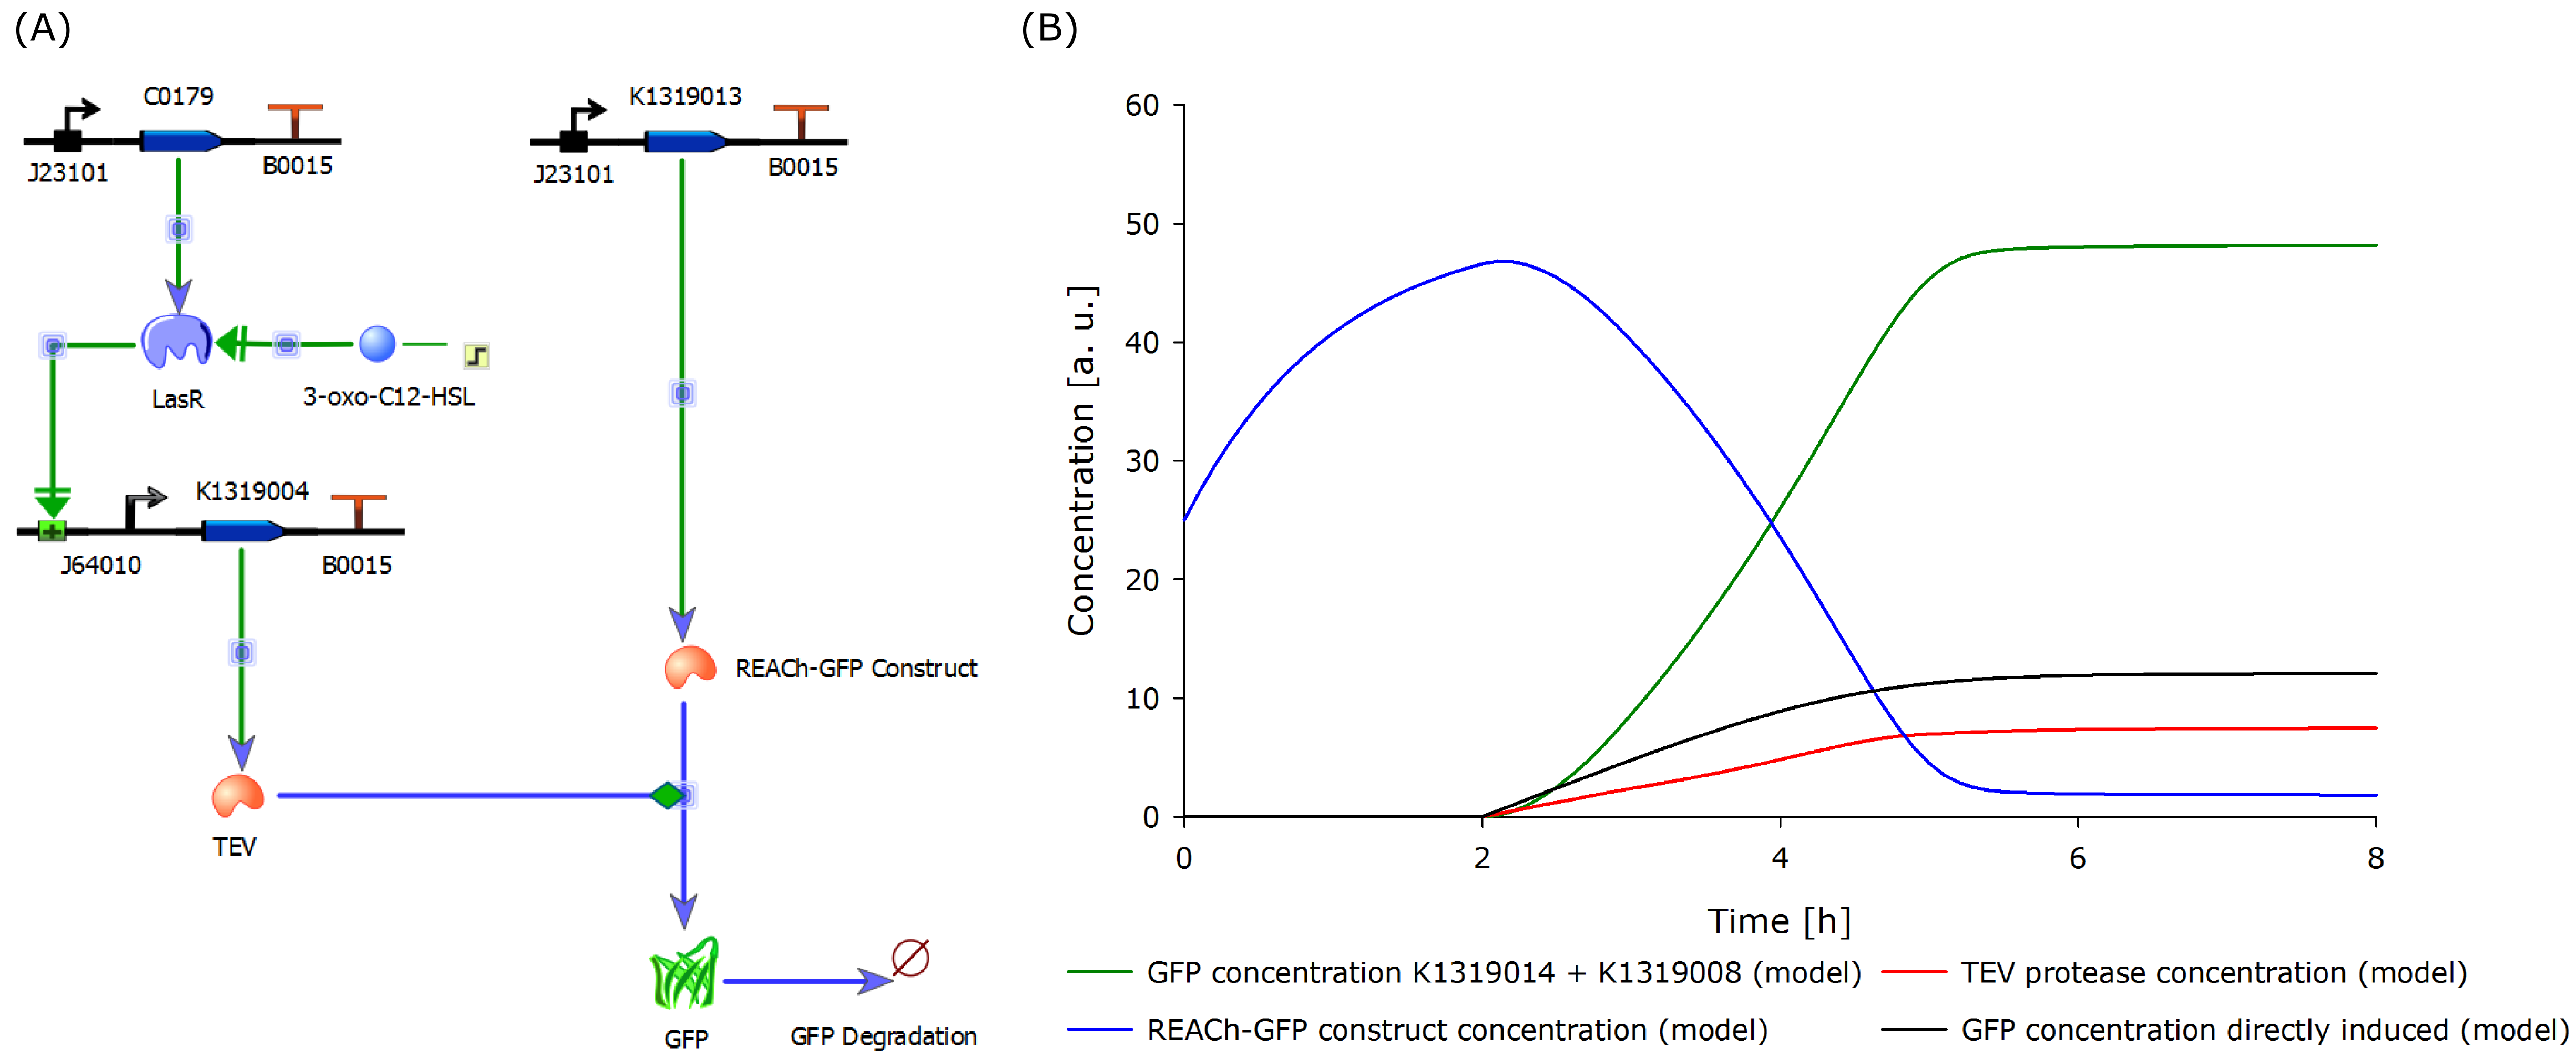
To validate our hypothesis, we developed a model of our molecular approach using the CAD tool TinkerCell (Chandran, Bergmann and Sauro, 2009).

Aachen Model merged.png
Model of our molecular approach in TinkerCell (A) and the output over time (B)
The molecular setup of the novel 3-oxo-C12-HSL inducible biosensor (A) yields results indicating a strong and fast fluorescence output after induction (B). A directly inducible system was modeled and added to the plot for comparison.

In the figure displayed above, we compare the response time of the fluorescence signal between our theoretical system and a traditional biosensor, we included a direct expression of GFP in the same plot. In the results shown above, the strength of the promoter used for the direct GFP expression (traditional approach) is twice as high as the strength of the promoter upstream of the TEV coding sequence in our new approach. Despite a weaker promoter, a higher GFP concentration is generated in the model of the novel biosensor, predicting a quicker response time of our system.

The model predicted that our approach should be an improvement over the commonly used direct expression, so we proceeded with the clonings and assembled plasmids to test the system.

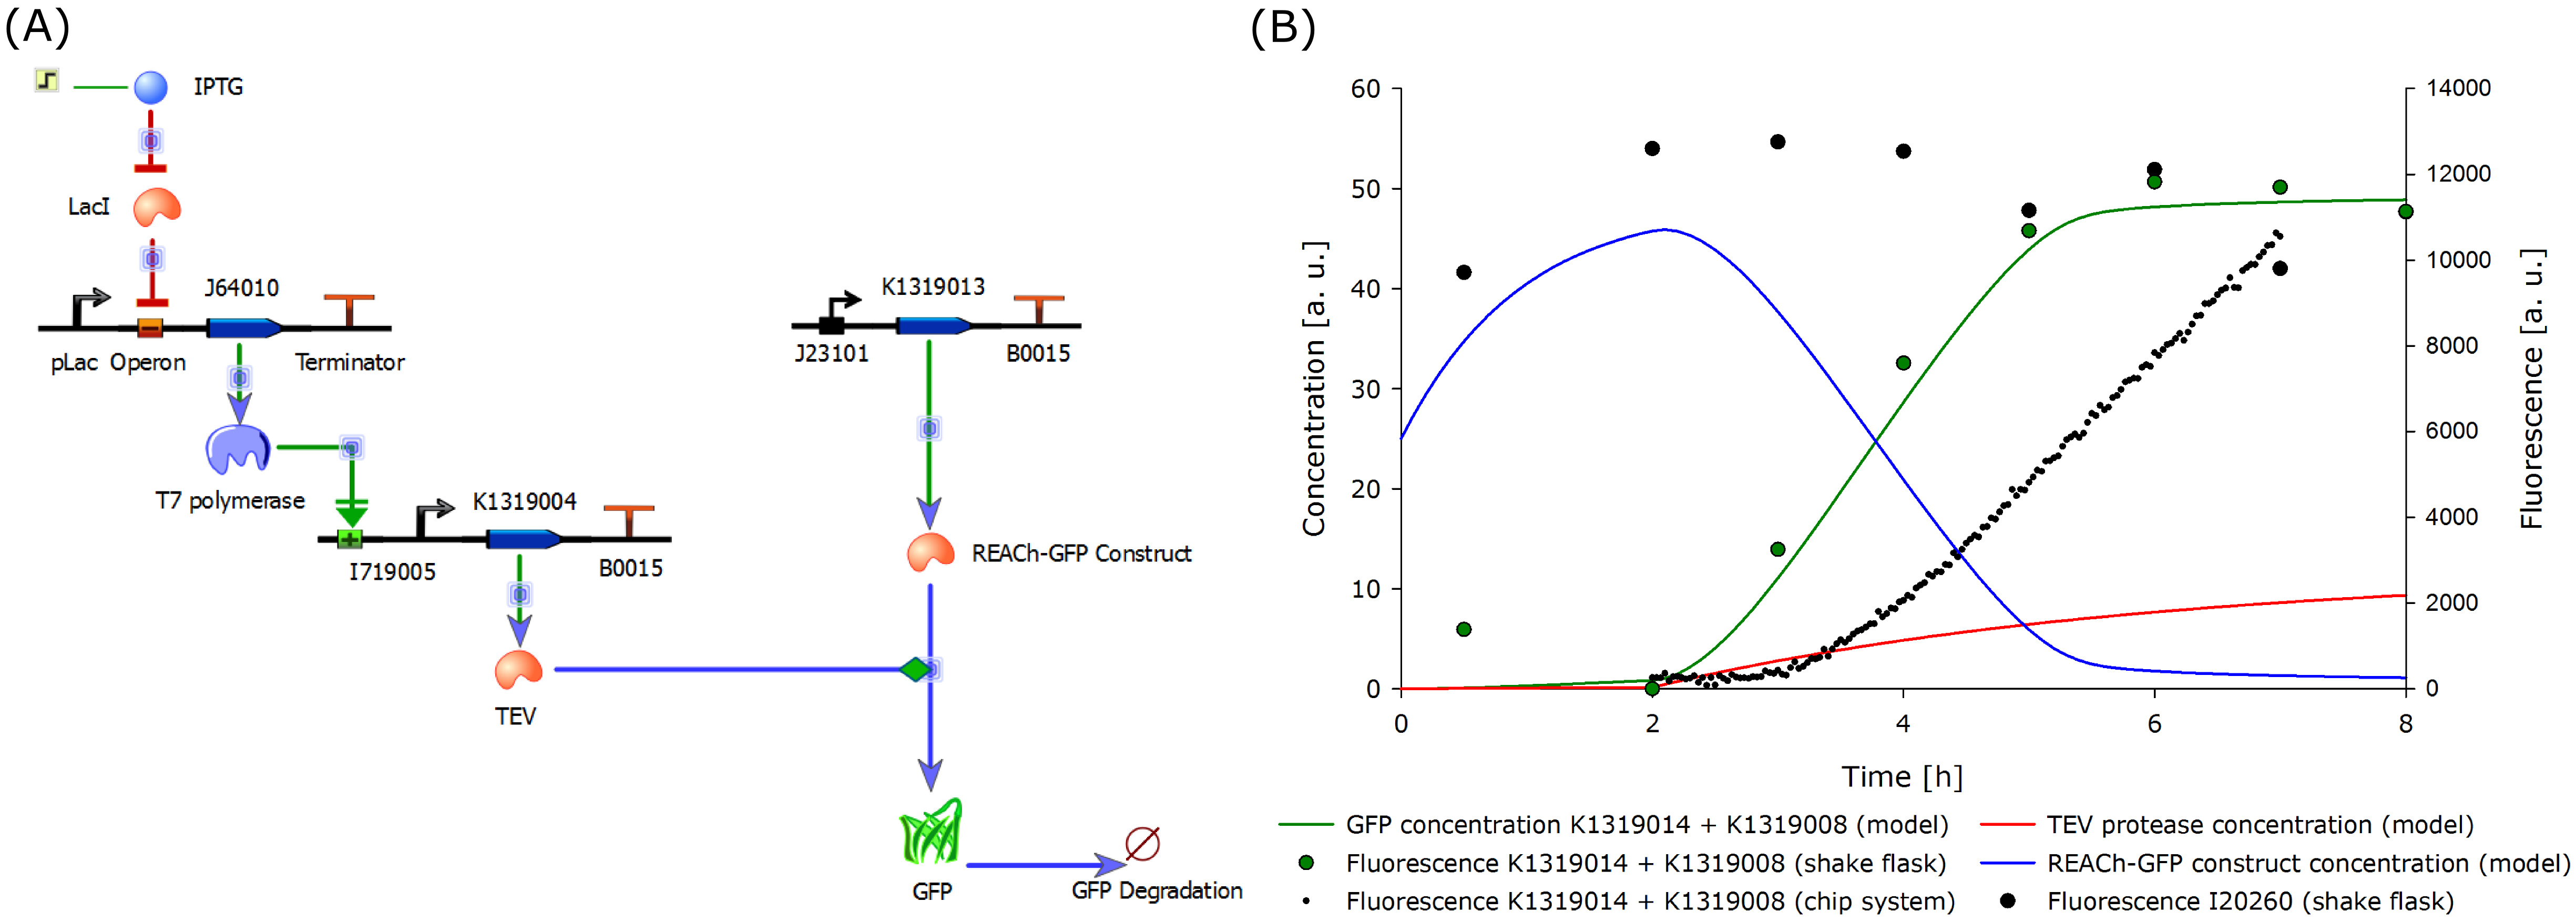
Due to the complexity of the quorum sensing circuit, we assembled an IPTG-inducible TEV protease instead of the 3-oxo-C12-HSL-inducible version. Although the modeled and the existing double plasmid system differ regarding the induction mechanism, a high correlation between the model predictions and the experimental data was observed. However, a new model was designed according to the existing and functional IPTG-inducible system.

Aachen Model IPTG merged.png
Revised model of the molecular approach (A) and output over time (B).
This model is for the IPTG-inducible double plasmid system (A) and the calculated output (B). Experimental data was included in the plot for comparison and data validation.

The model was optimized to fit the data generated from the characterization experiment conducted in shake flasks. Additionally, the data from the characterization experiment of the double plasmid construct (K1319014 + K1319008) in the chip system was included in the plot above. The data was derived from the plate reader output of the four central spots of the chip. The background from the non-induced chip was substracted from the fluorescence response to correct the data and avoid effects from cell growth leading to wrong signal strengths. The development of the fluorescence is presented here.

It is shown that the fluorescence response in chips develops later than in the characterization experiment in shake flasks. This is because the solid agar chip provides a higher diffusion barrier than liquid medium as used in the shake flasks. Further, a high oxygen transfer rate in shake flask cultivations enhances the rate of fluorescence development, as oxygen is needed for GFP production, in comparison to the cultivation in chips.

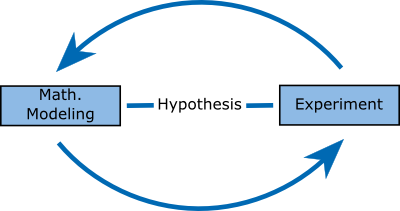
The model predictions correlate with the data generated from the characterization experiments, thus validating our molecular approach. With an iterative cycle of modeling, a faster and stronger fluorescence signal could be proven both theoretically and empirically.

References

  • Chandran, D., Bergmann, F. T., & Sauro, H. M. (2009). TinkerCell: modular CAD tool for synthetic biology. Journal of biological engineering, 3(1), 19. doi: 10.1186/1754-1611-3-19