Team:Saarland/4 step
From 2014.igem.org
| (One intermediate revision not shown) | |||
| Line 44: | Line 44: | ||
The initial step of our project was the artificial synthesis of the <i>has</i>2 gene sequence coding for the hyaluronan synthase of the naked mole rat. The sequence was taken from the freely accessible genome database [http://genome.ucsc.edu/ UCSC Genome Browser], whereby the sequence data was gained by shot-gun-sequencing (Kim <i>et al</i>., 2011). The gene sequence was adapted to the altered codon usage in <i>Bacillus megaterium</i> with [http://www.jcat.de/ JCat] (Grote <i>et al</i>., 2005). Additionally the open reading frame (ORF) of the <i>has</i>2 gene was modified so that prokaryotic ribosomal binding site (RBS), rho-independent transcription termination as well as restriction enzymes that are also part of the multiple cloning site (MCS) of the target plasmid pSMF2.1 were excluded. For the upcoming cloning process of the <i>has</i>2 gene the nucleotide sequence was terminally modified with the restriction sites <i>Mlu</i>Ⅰ (5`end) und <i>Sac</i>Ⅰ(3`end). Moreover a <i>B. megaterium</i> specific RBS was added downstream the <i>Mlu</i>Ⅰrestriction site for efficient protein expression. We paid attention to the fact that the amino acid sequence did not change. | The initial step of our project was the artificial synthesis of the <i>has</i>2 gene sequence coding for the hyaluronan synthase of the naked mole rat. The sequence was taken from the freely accessible genome database [http://genome.ucsc.edu/ UCSC Genome Browser], whereby the sequence data was gained by shot-gun-sequencing (Kim <i>et al</i>., 2011). The gene sequence was adapted to the altered codon usage in <i>Bacillus megaterium</i> with [http://www.jcat.de/ JCat] (Grote <i>et al</i>., 2005). Additionally the open reading frame (ORF) of the <i>has</i>2 gene was modified so that prokaryotic ribosomal binding site (RBS), rho-independent transcription termination as well as restriction enzymes that are also part of the multiple cloning site (MCS) of the target plasmid pSMF2.1 were excluded. For the upcoming cloning process of the <i>has</i>2 gene the nucleotide sequence was terminally modified with the restriction sites <i>Mlu</i>Ⅰ (5`end) und <i>Sac</i>Ⅰ(3`end). Moreover a <i>B. megaterium</i> specific RBS was added downstream the <i>Mlu</i>Ⅰrestriction site for efficient protein expression. We paid attention to the fact that the amino acid sequence did not change. | ||
Subsequently the 1693 bp long modified gene sequence <i>has</i>2 (fig. 1) was handed over to [http://www.eurofinsgenomics.eu/ Eurofins] who performed the gene synthesis and the cloning into the standard delivery plasmid pexK4 plasmid.<br> | Subsequently the 1693 bp long modified gene sequence <i>has</i>2 (fig. 1) was handed over to [http://www.eurofinsgenomics.eu/ Eurofins] who performed the gene synthesis and the cloning into the standard delivery plasmid pexK4 plasmid.<br> | ||
| - | [[File:Proj4 Abb1.png|thumb|center|470px|<b>Figure 1: Modified gene sequence of the naked mole rat`s hyaluronan synthase <i>has</i>2 (1693 bp).</b> The start codon and stop codon of the <i>has</i>2 sequence are marked (blue). At the 5`end the restriction site <i>Mlu</i>Ⅰ(light blue) and the RBS (grey) is annexed. At the 3`end the recognition site of the <i>Sac</i>Ⅰ enzyme is added (modified from [http://genome.ucsc.edu/ UCSC Genome Browser])]] | + | [[File:Proj4 Abb1.png|thumb|center|470px|<b>Figure 1: Modified gene sequence of the naked mole rat`s hyaluronan synthase <i>has</i>2 (1693 bp).</b> The start codon and stop codon of the <i>has</i>2 sequence are marked (blue). At the 5`end the restriction site <i>Mlu</i>Ⅰ(light blue) and the RBS (grey) is annexed. At the 3`end the recognition site of the <i>Sac</i>Ⅰ enzyme is added (modified from [http://genome.ucsc.edu/ UCSC Genome Browser]).]] |
<br> | <br> | ||
<br> | <br> | ||
| Line 256: | Line 256: | ||
<br> | <br> | ||
[[File:Abb10.1.png|thumb|center|450px|<b>Figure 12: Digestion control of plasmid DNA isolated from<i> E. coli</i> cells that were transformed with pSB1C3-BioBrick constructs.</b> The digestions with particular restriction enzymes confirm the presence of the different BioBrick insert DNAs with correct product sizes (table 1). <br> | [[File:Abb10.1.png|thumb|center|450px|<b>Figure 12: Digestion control of plasmid DNA isolated from<i> E. coli</i> cells that were transformed with pSB1C3-BioBrick constructs.</b> The digestions with particular restriction enzymes confirm the presence of the different BioBrick insert DNAs with correct product sizes (table 1). <br> | ||
| - | Appilication scheme (A) | + | Appilication scheme for (A) <br> |
Lane 1: pSBS1C3-<i>glk</i> (<i>Eco</i>RⅠ/<i>Pst</i>Ⅰ)<br> | Lane 1: pSBS1C3-<i>glk</i> (<i>Eco</i>RⅠ/<i>Pst</i>Ⅰ)<br> | ||
Lane 2: pSB1C3-<i>gta</i>B (<i>Eco</i>RⅠ/<i>Pst</i>Ⅰ)<br> | Lane 2: pSB1C3-<i>gta</i>B (<i>Eco</i>RⅠ/<i>Pst</i>Ⅰ)<br> | ||
| Line 262: | Line 262: | ||
Lane 4: pSB1C3-<i>gca</i>D (<i>Eco</i>RⅠ/<i>Pst</i>Ⅰ)<br> | Lane 4: pSB1C3-<i>gca</i>D (<i>Eco</i>RⅠ/<i>Pst</i>Ⅰ)<br> | ||
Lane 5: pSB1C3-<i>pgm</i>B (<i>Eco</i>RⅠ/<i>Spe</i>Ⅰ)<br> | Lane 5: pSB1C3-<i>pgm</i>B (<i>Eco</i>RⅠ/<i>Spe</i>Ⅰ)<br> | ||
| - | Application scheme (B) | + | Application scheme for (B) <br> |
Lane 1: pSB1C3-<i>pgi</i> (<i>Xba</i>Ⅰ/<i>Pst</i>Ⅰ)<br> | Lane 1: pSB1C3-<i>pgi</i> (<i>Xba</i>Ⅰ/<i>Pst</i>Ⅰ)<br> | ||
Lane 2: pSB1C3-<i>glm</i>S (<i>Xba</i>Ⅰ/<i>Pst</i>Ⅰ)]] | Lane 2: pSB1C3-<i>glm</i>S (<i>Xba</i>Ⅰ/<i>Pst</i>Ⅰ)]] | ||
Latest revision as of 13:40, 17 October 2014
Step 4: Build an army of clone warriors

Skip to a chapter by clicking the corresponding marking above
1. Design and Synthesis of hyaluronan synthase gene has2
The initial step of our project was the artificial synthesis of the has2 gene sequence coding for the hyaluronan synthase of the naked mole rat. The sequence was taken from the freely accessible genome database [http://genome.ucsc.edu/ UCSC Genome Browser], whereby the sequence data was gained by shot-gun-sequencing (Kim et al., 2011). The gene sequence was adapted to the altered codon usage in Bacillus megaterium with [http://www.jcat.de/ JCat] (Grote et al., 2005). Additionally the open reading frame (ORF) of the has2 gene was modified so that prokaryotic ribosomal binding site (RBS), rho-independent transcription termination as well as restriction enzymes that are also part of the multiple cloning site (MCS) of the target plasmid pSMF2.1 were excluded. For the upcoming cloning process of the has2 gene the nucleotide sequence was terminally modified with the restriction sites MluⅠ (5`end) und SacⅠ(3`end). Moreover a B. megaterium specific RBS was added downstream the MluⅠrestriction site for efficient protein expression. We paid attention to the fact that the amino acid sequence did not change.
Subsequently the 1693 bp long modified gene sequence has2 (fig. 1) was handed over to [http://www.eurofinsgenomics.eu/ Eurofins] who performed the gene synthesis and the cloning into the standard delivery plasmid pexK4 plasmid.

2. Genomic amplification of genes that may optimise the hyaluronic acid production
The hyaluronan synthase catalyses the synthesis of hyaluronic acid by consumption of the endogenous synthesised precursor molecules UDP-D-glucuronic acid and UDP-N-acetly-D-glucosamine. The biochemical pathways for their production were already identified in streptococci of group A and C. Hence it was possible to identify genes that could have a beneficial effect on the concentration of these precursor molecules for high yield hyaluronic acid production in B. megaterium.
 Pathway engineering
Eventually eight relevant pathway genes, including UDP-glcDH, glk, pgmB, gtaB, pgi, glmS, glmM and gcaD, were chosen for the approach of pathway engineering. The sequences of these genes originate from [http://megabac.tu-bs.de/ MegaBac v9 database] and were used for primer design and amplification of genomic DNA of B. megaterium. Restriction sites not only at the 5` end but also at the 3` end were added for subsequent cloning into the pSB1C3 plasmid (table 1).
| Gene Name | Gene Size (bp) | 5` Restriction Site | 3` Restriction Site |
|---|---|---|---|
| UDP-glcDH | 1382 | SacⅠ | SphⅠ |
| glk | 969 | EcoRⅠ | PstⅠ |
| pgmB | 707 | EcoRⅠ | SpeⅠ |
| gtaB | 888 | EcoRⅠ | PstⅠ |
| pgi | 1350 | XbaⅠ | PstⅠ |
| glmS | 1800 | XbaⅠ | PstⅠ |
| glmM | 1346 | EcoRⅠ | PstⅠ |
| gcaD | 1380 | EcoRⅠ | PstⅠ |
To verify the correct amplification of the genes the PCR products were loaded onto an agarose gel. As it is evident in figure 2 the bands showed the expected lengths for the genes glk (969 bp), pgmB (707 bp), gtaB (888 bp), pgi (1350 bp), glmS (1800 bp), glmM (1340 bp) and gcaD (1380 bp). Since UDP-glcDH was planned for cloning into pSMF2.1-has2 plasmid it was amplified in a separate step, described below.
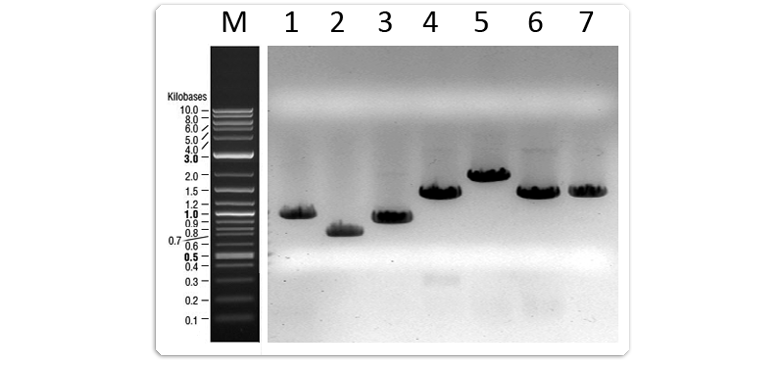
Lane 1: glk (969 bp)
Lane 2: pgmB (707 bp)
Lane 3: gtaB (888 bp)
Lane 4: pgi (1350 bp)
Lane 5: glmS (1800 bp)
Lane 6: glmM (1340 bp)
Lane 7: gcaD (1380 bp)
3. Test of restriction enzymes
Before starting with the cloning procedures it was necessary to check if the ordered restriction enzymes work properly. Therefore the pSMF2.1 plasmid was digested separately with each restriction enzyme (MluⅠ, SacⅠ, SphⅠ) that should be used for the following cloning of has2 and UDP-glcDH into the expression plasmid pSMF2.1. Displayed in Figure 3 all restriction enzymes (MluⅠ, SacⅠ and SphⅠ) linearised the plasmid, indicating proper functioning.

Lane 1: MluⅠ restricted pSMF2.1 plasmid (6510 bp)
Lane 2: SacⅠ restricted pSMF2.1 plasmid (6510 bp)
Lane 3: SphⅠ restricted pSMF2.1 plasmid (6510 bp)
Lane 4: undigested pSMF2.1 plasmid (negative control)
4. Cloning of the hyaluronan synthase gene (has2) into pSMF2.1
A digestion with the restriction enzymes SacⅠ und MluⅠwas used to extract the has2 gene (1693 bp) from the pexK4 plasmid (2507 bp) for the following cloning into the final pSMF2.1 plasmid (6510 bp). Agarose electrophoresis was used to detect the digestion products which showed the expected lengths (fig.4). The band of has2 gene was clearly visible at 1693 bp. For cloning of has2 into pSMF2.1 plasmid it first needed to be digested with the same restriction enzymes SacⅠ und MluⅠ. Subsequently the restricted plasmid (6510 bp) was separated by agarose gel electrophoresis (fig. 4). A restriction control without the restriction enzymes was carried out as well.

Lane 1: Restricted PexK4 plasmid (2507 bp) and has2 insert (1693 bp)
Lane 2: Restricted pSMF2.1 (6510 bp)
After reisolation the pSMF2.1 plasmid was treated with alkaline phosphatase. The treatment causes an elimination of the phosphate group at the 5` terminus of the restricted plasmid and thereby prevents the restricted plasmid from relegation.
Afterwards the digested insert has2 was ligated with the restricted and phosphatase treated pSMF2.1 plasmid. Figure 5 displays the control of ligation. The approach with ligase showed a high molecular band at 8203 bp indicating that insert and plasmid were successfully ligated. As expected the negative control showed only the two original bands representing digested has2 insert DNA and restricted pSMF2.1 plasmid.

Lane 1: pSMF2.1 + has2 (with ligase)
Lane 2: pSMF2.1 + has2 (without ligase)
Lane 3: pSMF2.1 (without ligase)
After transformation of competent E. coli cells with the resulting pSMF2.1-has2 construct and selection on ampicillin agar plates, plasmid DNA of transformants was isolated and presence of has2 insert DNA was checked by control digestion. Figure 6 shows the result for one representative E. coli transformant.
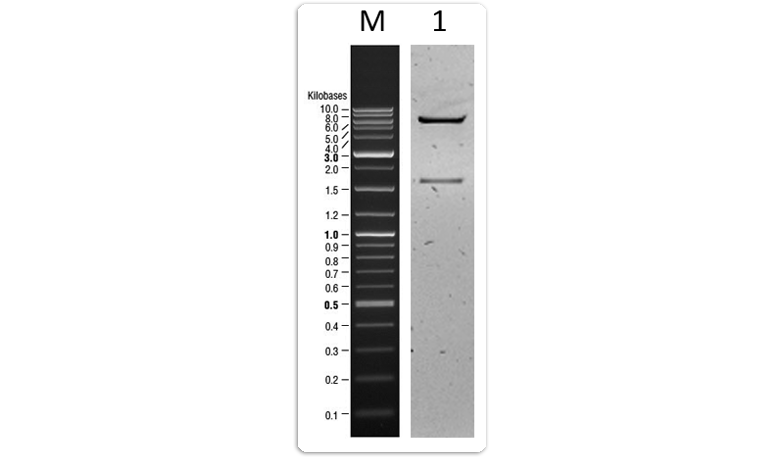
Lane 1: pSMF2.1 + has2
Obviously the pSMF2.1-has2 plasmid was successfully absorbed by the E. coli transformant as both pSMF2.1 plasmid DNA at 6510 bp and has2 insert DNA at 1693 bp are visible after digestion with SacⅠ und MluⅠ. The isolated plasmid DNA was used in a following step for transformation of B. megaterium.
5. Cloning of the UDP-glcDH gene into pSMF2.1-has2 plasmid
In the same way the UDP-glucose-6-dehdyrogenase (UDP-glcDH) gene was cloned into the pSMF2.1-has2 plasmid. However, instead of an outsourced gene synthesis like in the case of has2, the UDP-glcDH gene was amplified from the genomic DNA of B. megaterium. In addition modified primers were used to add the SacⅠ restriction site at the 5` terminus and the SphⅠ at the 3´ terminus of the PCR product. The presence and size of the PCR product was checked by agarose gel electrophoresis. pSMF2.1-has2 plasmid was digested with SacⅠ and SphⅠ for cloning UDP-glcDH and also checked by agarose gel electrophoresis (fig.7). A specific band could be detected at a size of 1382 bp indicating a proper PCR amplification of UDP-glcDH gene (fig.7). The restriction of pSMF2.1-has2 plasmid with SacⅠ and SphⅠ resulted in a linearised plasmid.

Lane 1: PCR product UDP-glcDH (SacⅠ/SphⅠ) (1382 bp)
Lane 2: pSMF2.1-has2 (SacⅠ/SphⅠ)
The next step was the ligation of the restricted pSMF2.1-has2 plasmid with the amplified and digested UDP-glcDH gene. As demonstrated in figure 8 the ligation was efficient because a shift in pSMF2.1-has2 plasmid size and a weaker insert band could be detected. However, the ratio of UDP-glcDH insert and pSMF2.1-has2 plasmid appeared not to be optimal due to a visible band at about 2750 bp resulting from a ligation of the insert UDP-glcDH (1382 bp) with itself.

Lane 2: pSMF2.1-has2 + UDP-glcDH (with ligase)
Lane 3: pSMF2.1-has2 + UDP-glcDH (without ligase)
After transformation of the ligation product pSMF2.1-has2-UDP-glcDH into competent E. coli cells and selection on ampicillin agar plates, the plasmid DNA of resulting transformants was checked by control digestion. Figure 9 shows the result for one representative E. coli transformant.
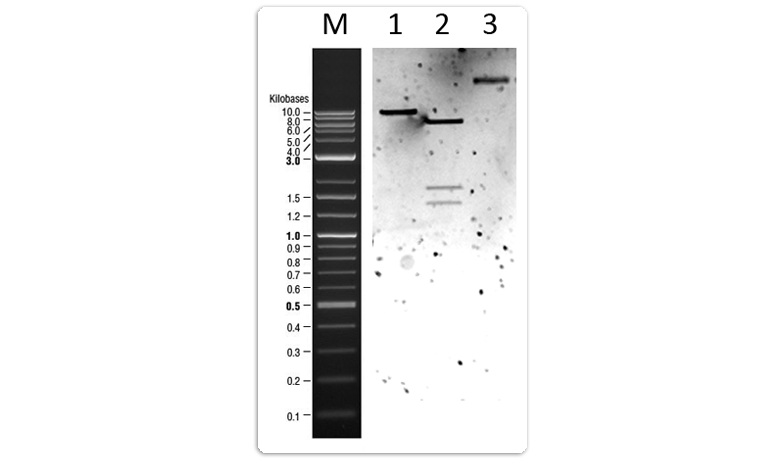
Lane 1: pSMF2.1-has2-UDP-glcDH (MluⅠ)
Lane 2: pSMF2.1-has2-UDP-glcDH (MluⅠ/SacⅠ/SphⅠ)
Lane 3: pSMF2.1-has2-UDP-glcDH (undigested)
Obviously the pSMF2.1-has2-UDP-glcDH plasmid was successfully absorbed by the E. coli transformant as all three digestion products representing the pSMF2.1 plasmid at 6510 bp, the has2 insert DNA at 1693 bp and the UDP-glcDH insert DNA at 1382 bp are visible after digestion with MluⅠ,SacⅠand SphⅠ. The isolated plasmid DNA was used in a following step for transformation of B. megaterium.
6. Transformations of Bacillus megaterium
The pSMF2.1-has2 and the pSMF2.1-has2-UDP-glcDH plasmids were transformed into Bacillus megaterium. Transformants were lysed and the plasmid DNA was isolated. Presence of the two expression plasmids was verified by control digestion showing the same result as in figure 9. Finally the B. megaterium chassis is ready for the first attempt to produce the high molecular mass hyaluronic acid.
7. Control of Protein Expression
7.1 Control of HMM-HA synthesis by means of viscosity measurement
The outstanding water binding capacity of high molecular mass hyaluronic acid (HMM-HA) should increase the viscosity of the cultivation medium. An altered viscosity can be measured with a rheometer. Samples of B. megaterium cultures transformed with pSMF2.1-has2 and pSMF2.1-has2-UDP-glcDH were prepared for viscosity measurement 24 h and 48 h after induction of protein expression. Supernatant of the cultures was used for measurement in case of secretion of HMM-HA into the medium. Cells were disrupted by sonication and lysozyme treatment in order to release the HMM-HA in case of its accumulation inside the cell. The results of the viscosity measurements demonstrated no significant differences in the viscosity between non-induced and induced samples. Even co expression of UDP-GlcDH didn´t lead to a significant increase of the viscosity. Consequently production of HMM-HA failed. Further steps comprising the characterisation of anti carcinogenic effects of HMM-HA on human cancer cell lines could not be performed.
7.2 Control of protein expression and localisation of a GFP tagged hyaluronan synthase
Protein expression and particularly localisation of Has2 in Bacillus megaterium was checked by using a c-terminal GFP tagged Has2 variant. The necessary fusion gene was created by SOE-PCR
digested with MluⅠand SacⅠ and inserted into pSMF2.1 plasmid. A subsequent restriction verified whether the SOE-PCR and the transformation into E. coli cells were effective. As displayed in figure 10 the presence of the fusion gene has2-gfp could be proofed by control digestion at 2420 bp.
 SOE-PCR
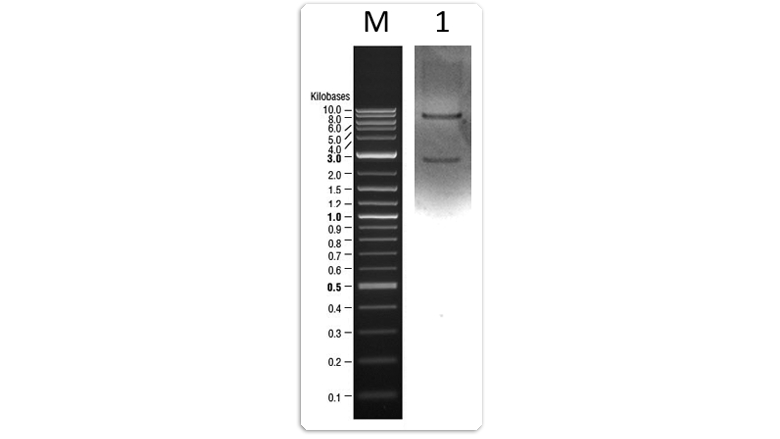
Lane 1: pSMF2.1-has2-gfp (MluⅠ/SacⅠ)
Subsequently the pSMF2.1-has2-gfp plasmid DNA was transformed into B. megaterium and cultures were induced with xylose to start recombinant protein expression. Non-induced cultures served as negative controls. After 48 h of expression, corresponding samples were prepared for analysis by fluorescence microscopy (fig. 11).

Figure 11 illustrates that fluorescence signals of induced B. megaterium cultures were probably detectable in the cytoplasm membrane after excitation with light at a wavelength of 488 nm. Furthermore the image shows several fluorescence dots of higher intensity that might derive from an accumulation of Has2-GFP protein in the phospholipid monolayer that surrounds insoluble spheric inclusions, also referred as poly hydroxyalkanoate (PHA) inclusion bodies. The not induced negative control does not show any fluorescence signal.
To proof the accumulation of GFP tagged Has2 protein in the cytoplasm membrane of B. megaterium cells localisation studies were carried out with a laser scanning fluorescence microscope. Repeated approaches for expression of the GFP tagged Has2 protein in B. megaterium cultures including various incubation temperatures varying from 26 °C up to 37 °C combined with different incubation times (24 h, 48 h, 72 h) failed. Detection of corresponding fluorescence signals with the more sensitive laser scanning microscope could not be reproduced.
7.3 Checking the expression of the GFP tagged Has2 protein by SDS-Page and Western Blot analysis
Recombinant protein expression of Has2 and UDP-GlcDH in B. megaterium cultures could not be proven by SDS-PAGE and following Coomassie Blue staining. At least the expression of the GFP tagged Has2 protein in B. megaterium cultures could be analysed by Western Blot with an appropriate GFP antibody. Soluble protein fraction of cell lysates didn`t show GFP tagged Has2 protein expression. Insoluble protein fraction of cell lysates including integral membrane proteins showed several unspecific protein bands but also a distinct protein band with a molecular weight of 90 kDa that likely derived from binding of the antibody to the GFP tagged Has2 protein. Cell lysates of non-induced B. megaterium culture served as a negative control and didn´t show GFP tagged Has2 protein expression neither in the soluble protein fraction nor in the insoluble fraction including integral membrane proteins.
8 .Cloning of the BioBricks into the pSB1C3 plasmid
For cloning of the genes that may optimise the hyaluronic acid production not only the corresponding PCR products, but also the BioBrick plasmid pSB1C3 was restricted with the respective restriction enzymes (table 1). Next step was the ligation of the restricted pSB1C3 plasmid (2070 bp) with each amplified and digested gene. Controls of ligation reactions are not shown. After transformation of the ligation products into competent E. coli cells and selection on ampicillin agar plates, the plasmid DNA of resulting transformants was checked by control digestion. Figure 12 shows the result for one representative E. coli transformant of each ligation.
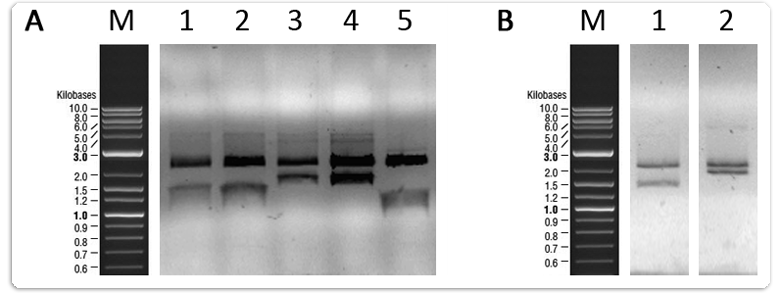
Appilication scheme for (A)
Lane 1: pSBS1C3-glk (EcoRⅠ/PstⅠ)
Lane 2: pSB1C3-gtaB (EcoRⅠ/PstⅠ)
Lane 3:pSB1C3-glmM (EcoRⅠ/PstⅠ)
Lane 4: pSB1C3-gcaD (EcoRⅠ/PstⅠ)
Lane 5: pSB1C3-pgmB (EcoRⅠ/SpeⅠ)
Application scheme for (B)
Lane 1: pSB1C3-pgi (XbaⅠ/PstⅠ)
Lane 2: pSB1C3-glmS (XbaⅠ/PstⅠ)
However genes coding for pgmB, pgi, glmS and glmM contained restriction sites for EcoRⅠ, XbaⅠ or PstⅠ which are not allowed in the BioBrick registry. Thus a Quick Change PCR was necessary to mutate the restriction site without changing the amino acid sequence.
 QC-PCR
Therefore primers were designed to change the wobble position of the codon within the corresponding restriction site. The success of the QC-PCR was checked by digestion with the
previously unwanted restriction enzyme and agarose gel electrophoresis (fig.13+14).

Lane 1: pSB1C3-pgmB after QC (EcoRⅠ/PstⅠ/SpeⅠ)
Lane 2: Positive control pSB1C3-pgmB without QC (EcoRⅠ/PstⅠ/SpeⅠ)
Lane 3: pSB1C3-pgi after QC (EcoRⅠ/PstⅠ/XbaⅠ)
Lane 4: Positive control pSB1C3-pgi without QC (EcoRⅠ/PstⅠ/XbaⅠ)
Figure 13 shows that the pSB1C3-pgmB clone did not feature the pgmB insert at 707 bp after QC-PCR. Only the restricted pSB1C3 plasmid is present at (2070 bp). The pgmB insert of the positive control should consist of two distinct bands since the illegal PstⅠ restriction site should be still present. The positive control doesn´t seem to be in possession of the illegal restriction site as displayed on [http://megabac.tu-bs.de/ MegaBac v9 database]. QC-PCR didn`t seem to have been necessary. The presence of pgi without illegal EcoRⅠ restriction site was confirmed by sequencing of the BioBrick.

Lane 1: pSB1C3-glmM after QC (EcoRⅠ/PstⅠ/XbaⅠ)
Lane 2: Positive control pSB1C3-glmM without QC (EcoRⅠ/PstⅠ/XbaⅠ)
Lane 3: pSB1C3-glmS after QC (EcoRⅠ/PstⅠ/XbaⅠ)
Lane 4: Positive control pSB1C3-glmS without QC (EcoRⅠ/PstⅠ/XbaⅠ)
Figure 14 shows that glmM insert DNA and glmS insert DNA are no longer in possession of their illegal restriction sites after QC-PCR.
As has2 and UDP-glcDH were already cloned into the PSMF2.1 plasmid and both genes contained illegal EcoRⅠ restriction sites the QC PCRs to substitute these illegal restriction sites were performed in the pSMF2.1 plasmid. Afterwards the changed has2 and UDP-glcDH gene sequences were amplified by PCR and legal restriction sites for cloning into pSB1C3 were added to the termini of both genes. Next step was the ligation of the restricted pSB1C3 plasmid (2070 bp) with amplified and digested genes. Controls of ligation reactions are not shown. After transformation of the ligation products into competent E. coli cells and selection on ampicillin agar plates, the plasmid DNA of resulting transformants was checked by control digestion. Figure 15 shows the result for one representative E. coli transformant of each ligation.

Lane 1: pSB1C3-has2 after QC (EcoRⅠ/PstⅠ)
Lane 2: pSB1C3-UDP-glcDH after QC (EcoRⅠ/PstⅠ)
The elimination of illegal restriction sites could be demonstrated for both genes.
To proof the success of restriction site mutagenesis and the correct base sequences of our constructs all plasmids were additionally sequenced by [http://www.eurofinsgenomics.eu/ Eurofins]. Sequencing revealed that pgmB and glmM still contained their illegal restriction site PstⅠ respectively XbaⅠ. However it was not possible to repeat the Quick Change PCRs as the constructs were already shipped. For all other shipped BioBricks correct sequences could be confirmed.
References
Grote, A., Hiller, K., Scheer, M., Munch, R., Nortemann, B., Hempel, D.C., and Jahn, D. (2005). JCat: a novel tool to adapt codon usage of a target gene to its potential expression host. Nucleic Acids Res. 33, W526–W531.
Kim, E.B., Fang, X., Fushan, A.A., Huang, Z., Lobanov, A.V., Han, L., Marino, S.M., Sun, X., Turanov, A.A., Yang, P., et al. (2011). Genome sequencing reveals insights into physiology and longevity of the naked mole rat. Nature 479, 223–227.
 "
"


 Previous Step

Impressum/Copyright