Team:Aachen/Collaborations/Freiburg
From 2014.igem.org
m (→Characterization of our OD measurement device) |
(→References) |
||
| (11 intermediate revisions not shown) | |||
| Line 2: | Line 2: | ||
{{Team:Aachen/Header}} | {{Team:Aachen/Header}} | ||
| - | = AcCELLoMatrix | + | = AcCELLoMatrix for [[Team:Freiburg/Team/Collaboration|Team Freiburg]]= |
| - | At the iGEM meetup in Munich in May , members of both of our teams realized that our projects share a common objective: Analyzing 2-dimensional, visual signals. For the following months, we stayed in contact and developed a concept to encode information in 384-well plates in the form of data matrix codes. | + | At the iGEM meetup in Munich in May, members of both of our teams realized that our projects share a common objective: Analyzing 2-dimensional, visual signals. For the following months, we stayed in contact and developed a concept to encode information in 384-well plates in the form of data matrix codes. |
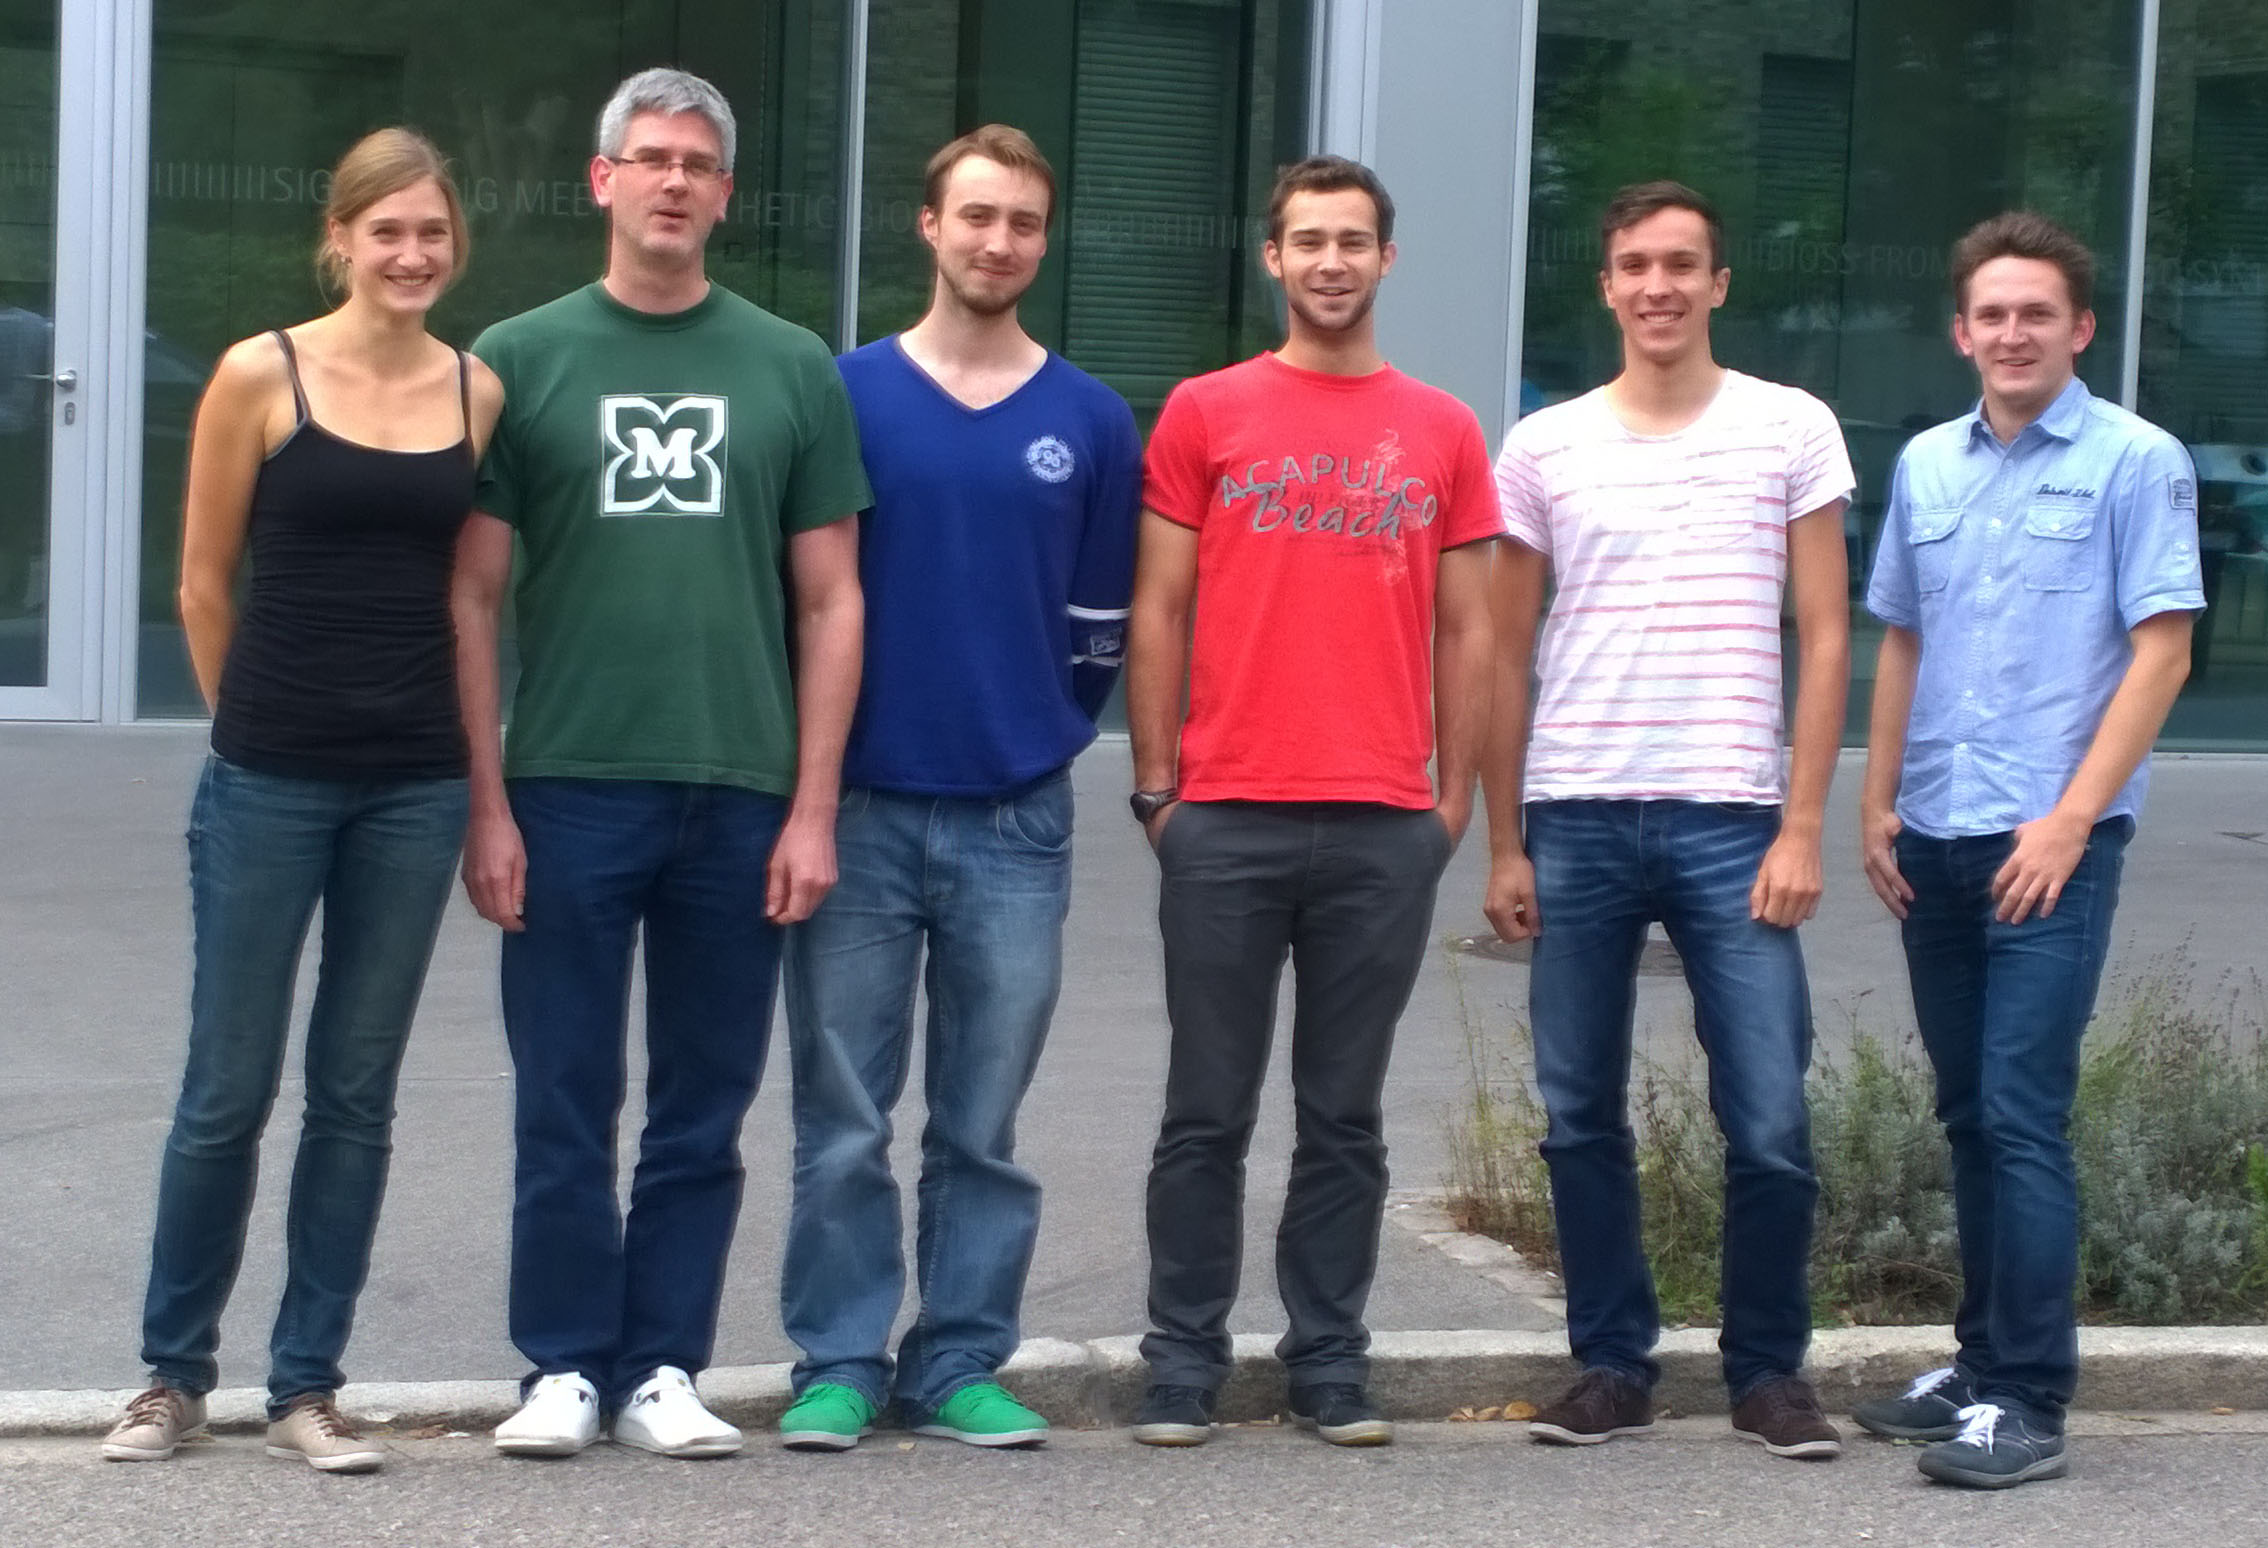
At the beginning of September, Michael spontaneously took a train to Freiburg and we met face-to-face for several hours to exchange details on our cooperation and general iGEM experiences. | At the beginning of September, Michael spontaneously took a train to Freiburg and we met face-to-face for several hours to exchange details on our cooperation and general iGEM experiences. | ||
| + | |||
{{Team:Aachen/Figure|Aachen_FR-collaboration_group_photo.jpg|align=center|title=Spontaneous group photo|subtitle=Freíburg iGEMers and Michael (right) meeting to discuss our cooperation|width=350px}} | {{Team:Aachen/Figure|Aachen_FR-collaboration_group_photo.jpg|align=center|title=Spontaneous group photo|subtitle=Freíburg iGEMers and Michael (right) meeting to discuss our cooperation|width=350px}} | ||
| + | |||
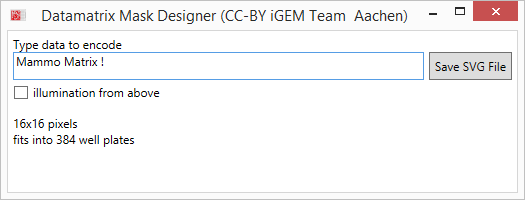
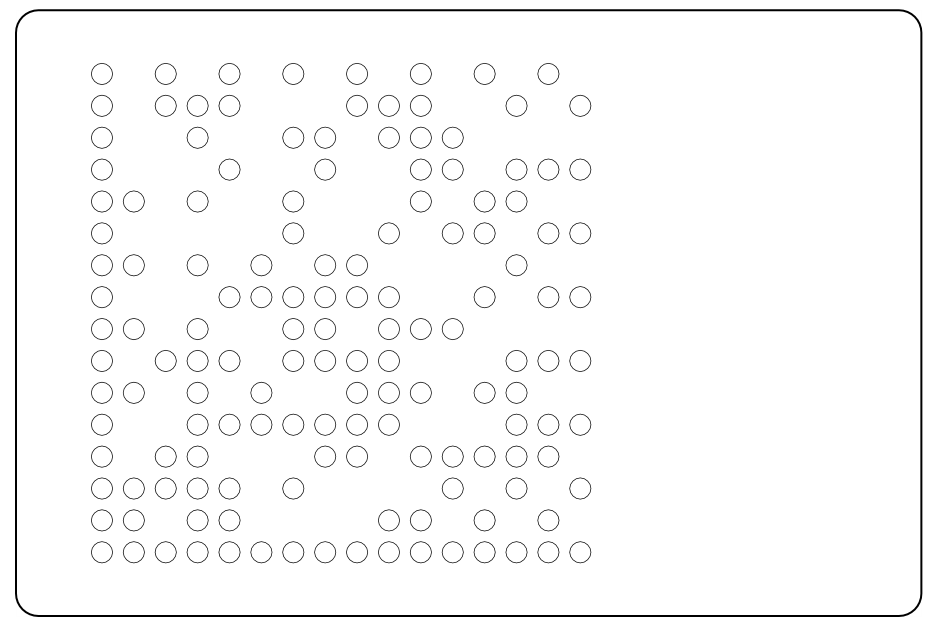
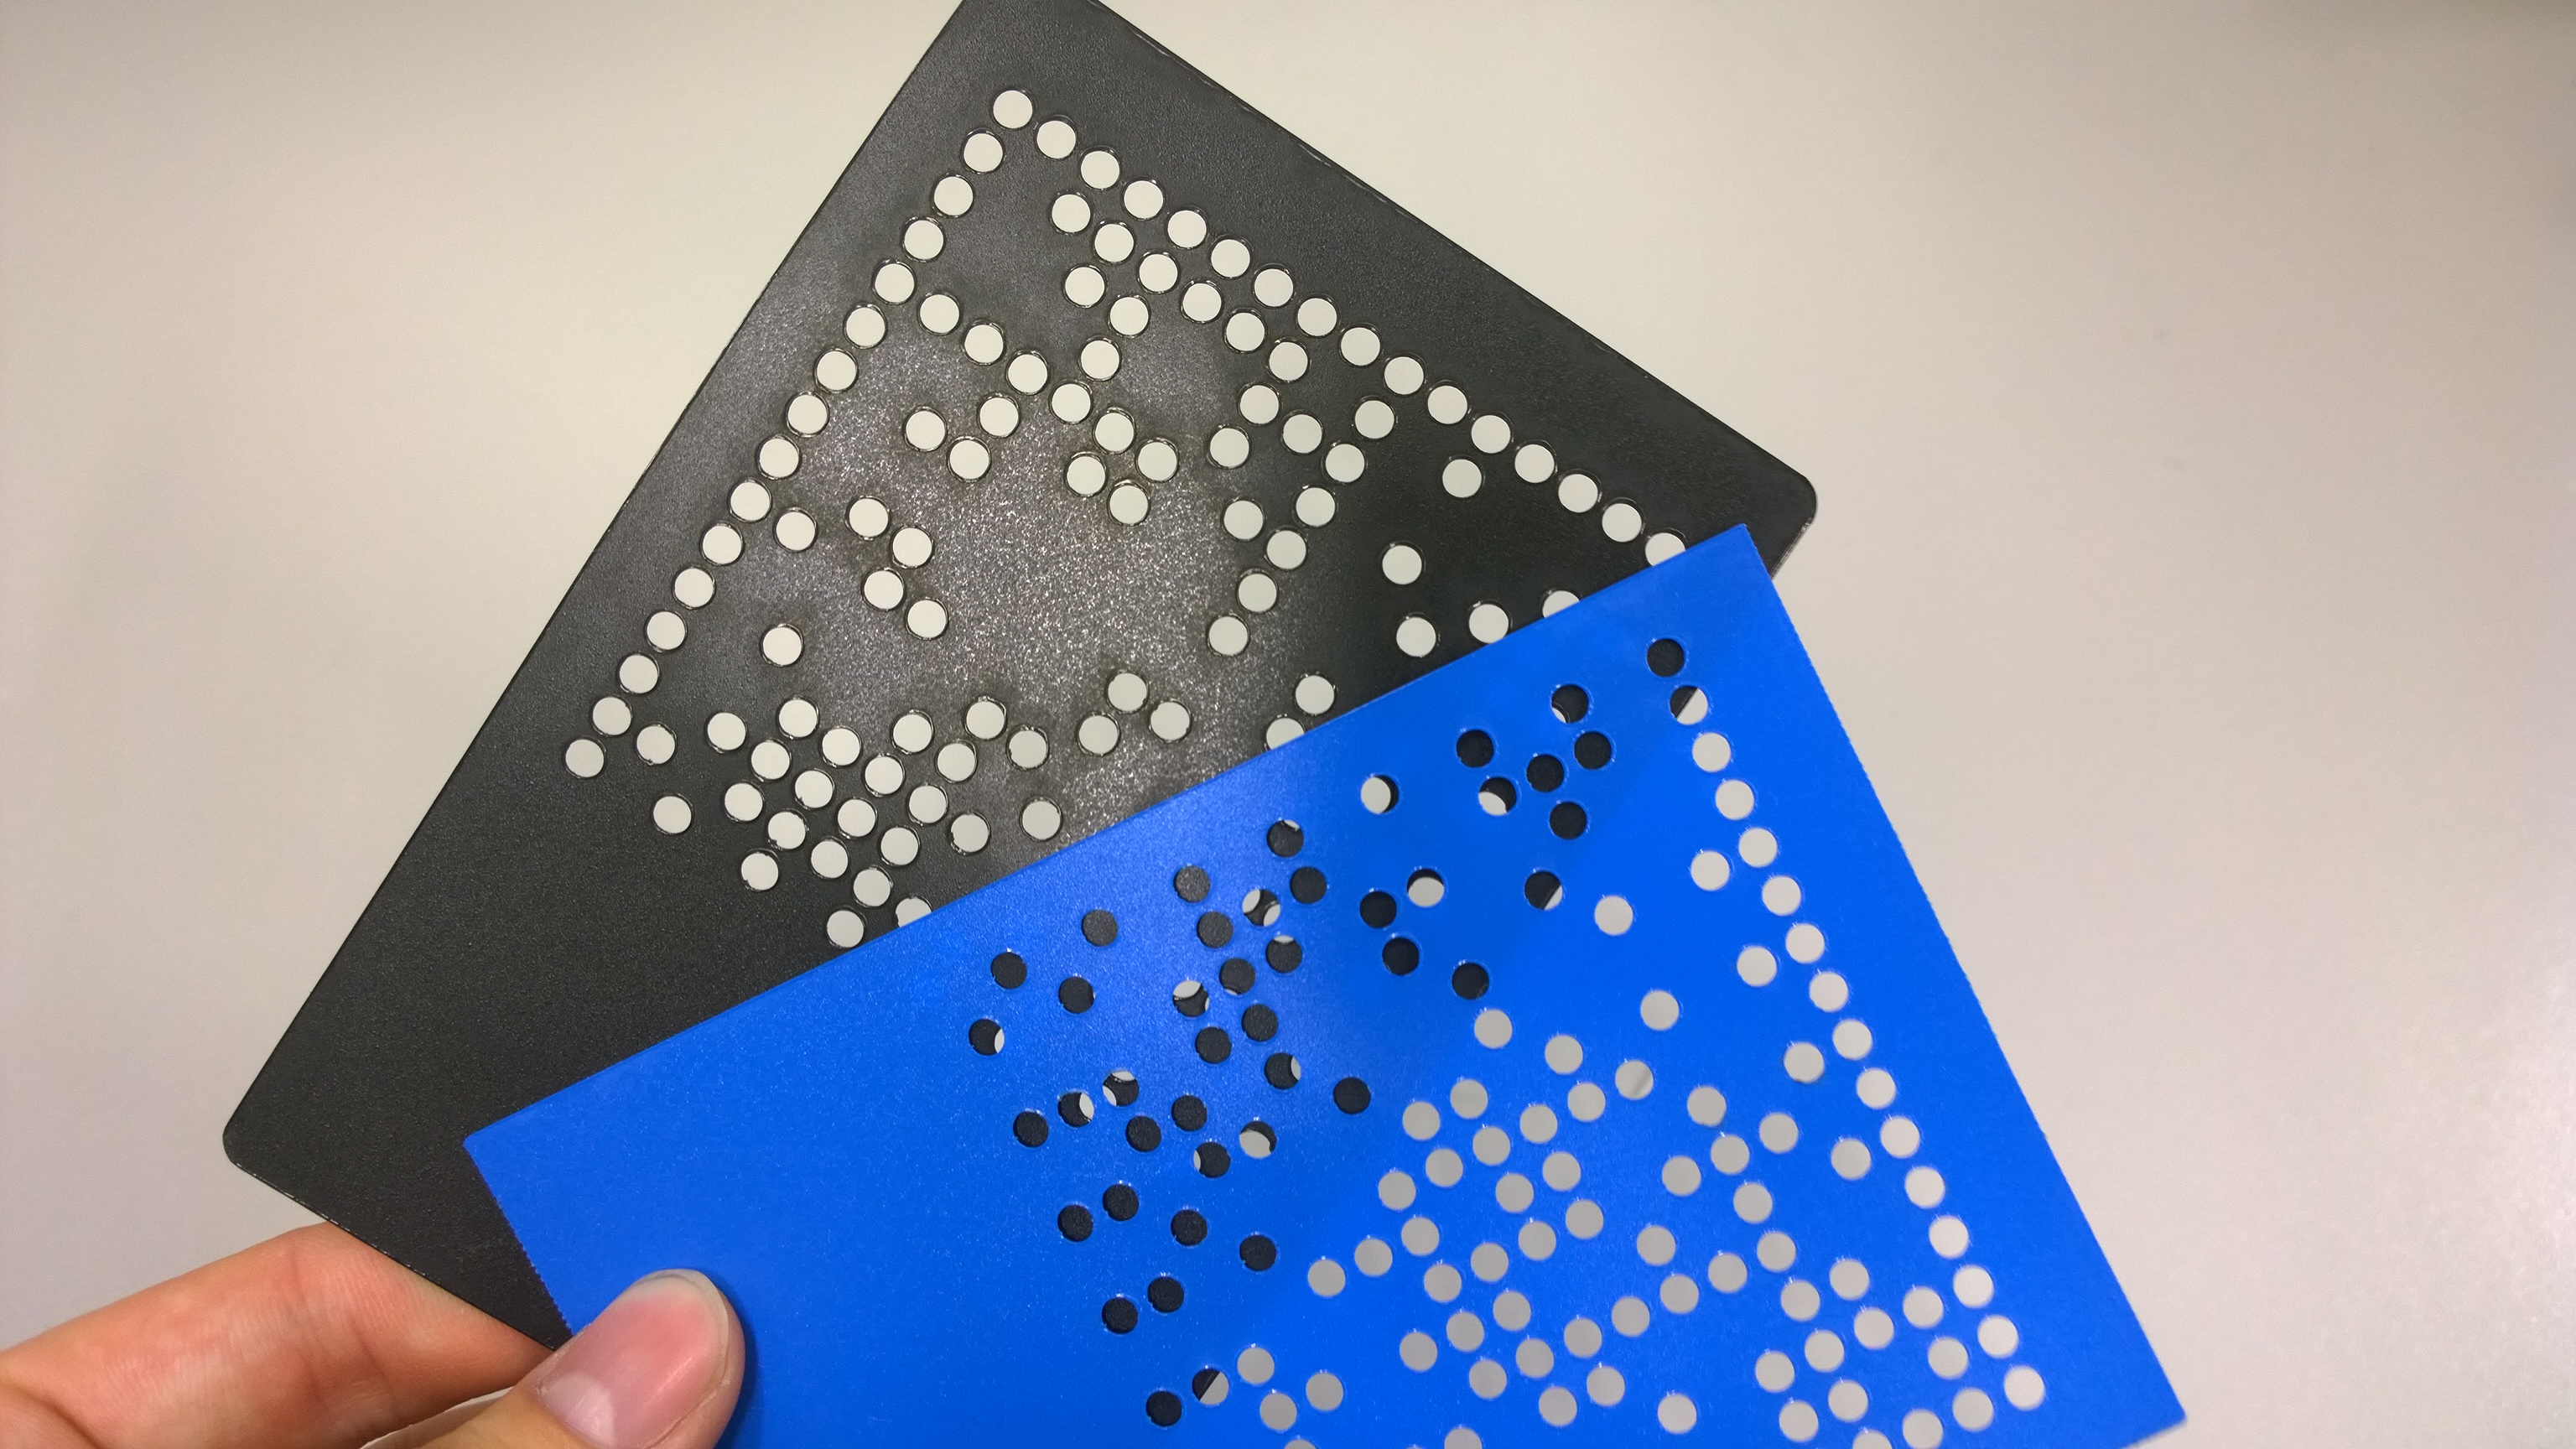
== Data Matrix Masks == | == Data Matrix Masks == | ||
| Line 34: | Line 36: | ||
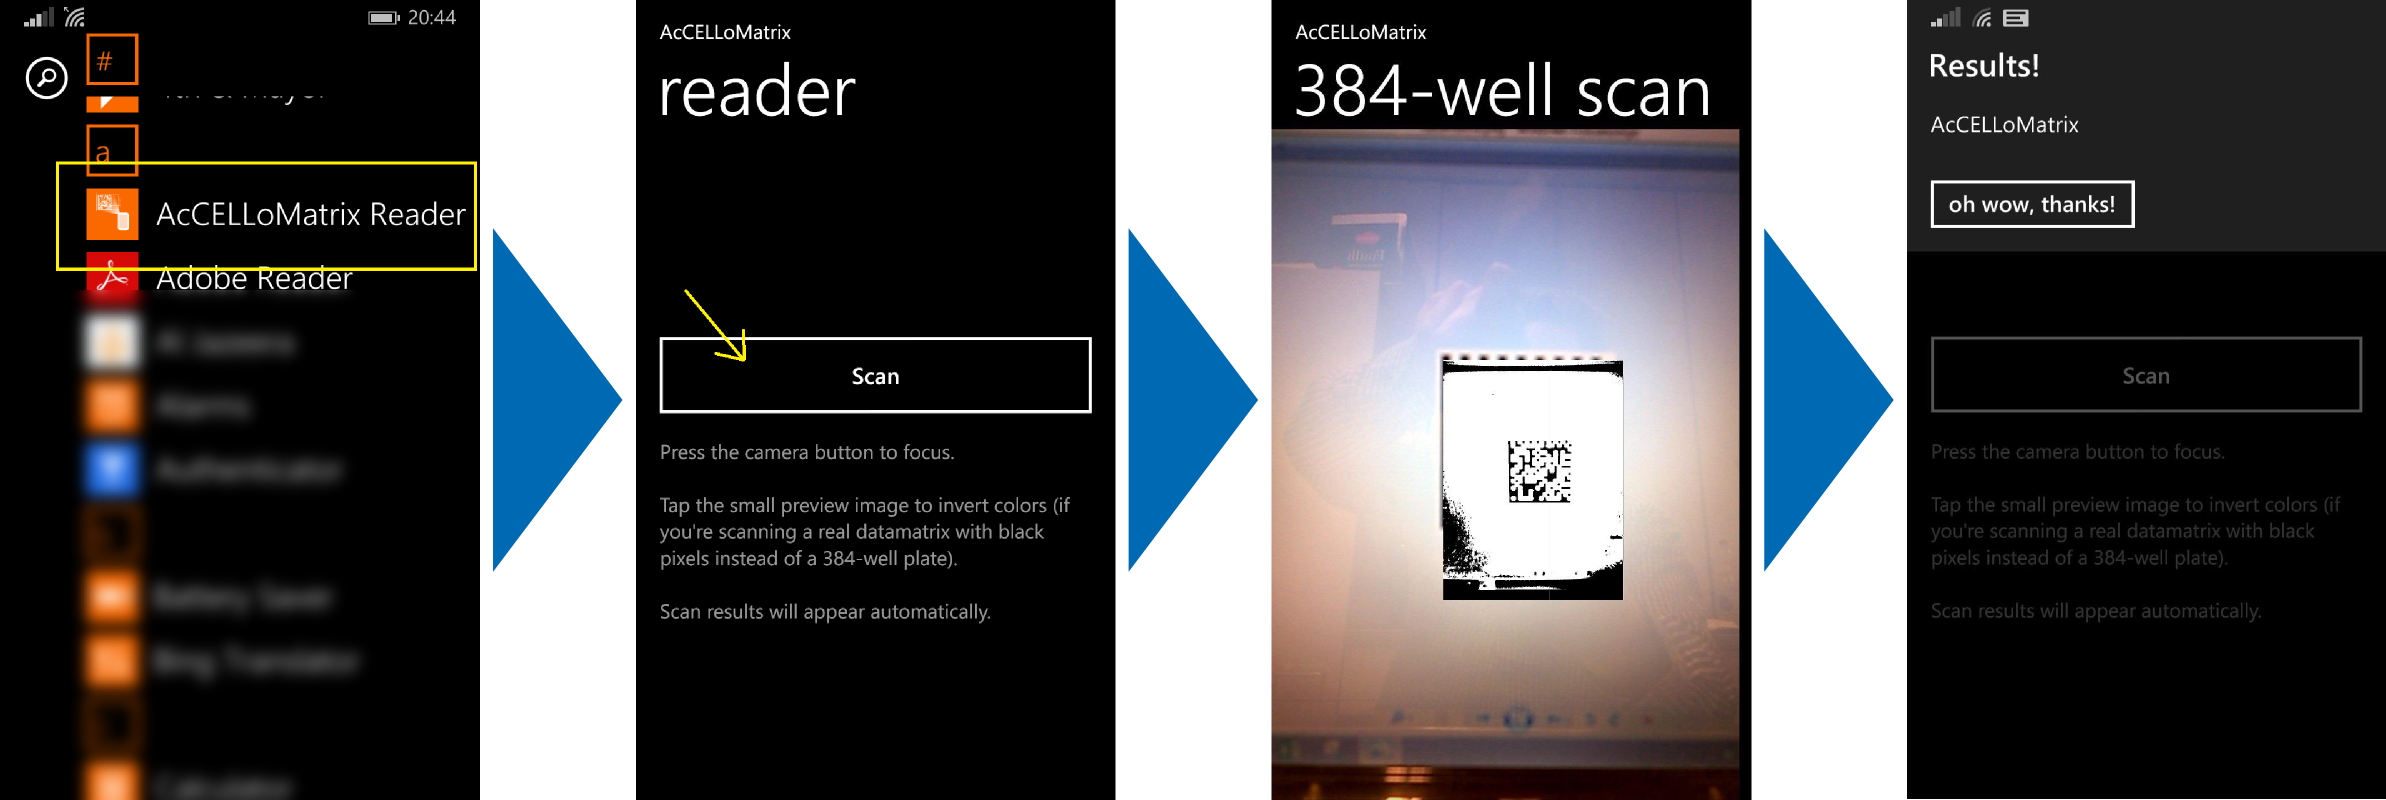
{{Team:Aachen/Figure|Aachen_Collaboration-FRScreenshots.png|title=Usage of AcCELLoMatrix Reader|width=1018px|subtitle=(1) Start the app and read through some brief instructions (2). Then start scanning and aim for a datamatrix in the wild (3). As soon as a datamatrix is detected in the preprocessed frames (4, small rectangle) by the ZXing algorithm, the decoded text is displayed to the user (5).}} | {{Team:Aachen/Figure|Aachen_Collaboration-FRScreenshots.png|title=Usage of AcCELLoMatrix Reader|width=1018px|subtitle=(1) Start the app and read through some brief instructions (2). Then start scanning and aim for a datamatrix in the wild (3). As soon as a datamatrix is detected in the preprocessed frames (4, small rectangle) by the ZXing algorithm, the decoded text is displayed to the user (5).}} | ||
| + | |||
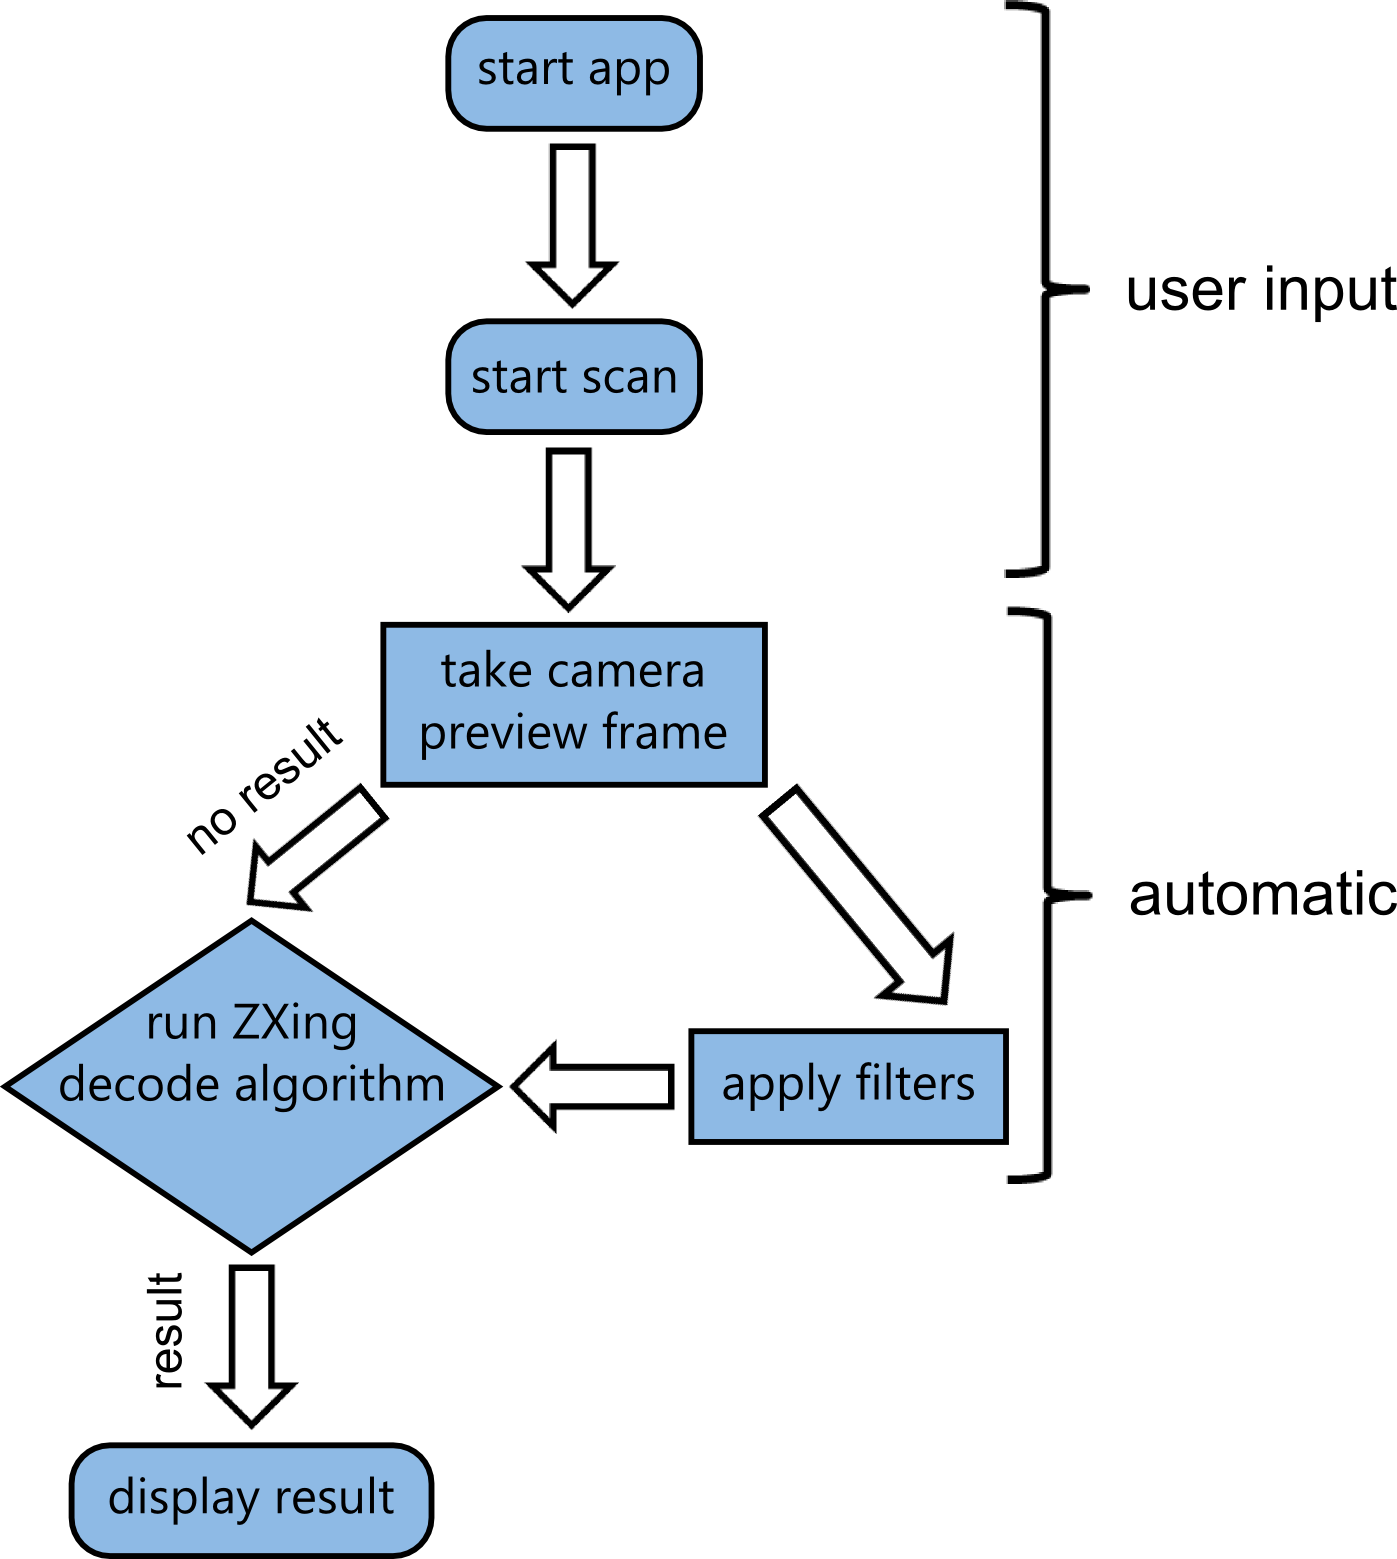
| + | While the apps frontend is designed to be very minimalistic, there's actually going on a lot in the backend. Visual data coming from the camera feed has to be processed and fed into the ZXing decoding algorithm. | ||
| + | |||
| + | {{Team:Aachen/Figure|Aachen_Collaboration-FRAMRflow.png|title=Activity diagram of the app|width=350px|subtitle=After the app was started and the scanning initiated by the user, a loop is initiated. Filters are applied to camera preview frames and the result is fed into the decoding algorithm. As soon as a datamatrix is detected, the loop is interrupted and the result presented to the user.}} | ||
== Outlook == | == Outlook == | ||
| Line 39: | Line 45: | ||
== References == | == References == | ||
| - | + | [http://www.nuget.org/packages/ZXing.Net/ ZXing.NET] by Michael Jahn is a port of [https://github.com/zxing/zxing ZXing] ("zebra crossing"), both licensed under [http://www.apache.org/licenses/LICENSE-2.0 Apache 2.0] | |
| - | = Characterization of our OD | + | |
| + | {{Team:Aachen/BlockSeparator}} | ||
| + | |||
| + | = Characterization of our OD Device by Team Freiburg = | ||
As we were helping the Freiburg team out with the encoding/decoding of text as datamatrixes, they also wanted to help us in a useful way. Our team was committed to characterize the OD measurement device, so we sent them one of prototypes and asked them to try a measurement of their mammalian cells. | As we were helping the Freiburg team out with the encoding/decoding of text as datamatrixes, they also wanted to help us in a useful way. Our team was committed to characterize the OD measurement device, so we sent them one of prototypes and asked them to try a measurement of their mammalian cells. | ||
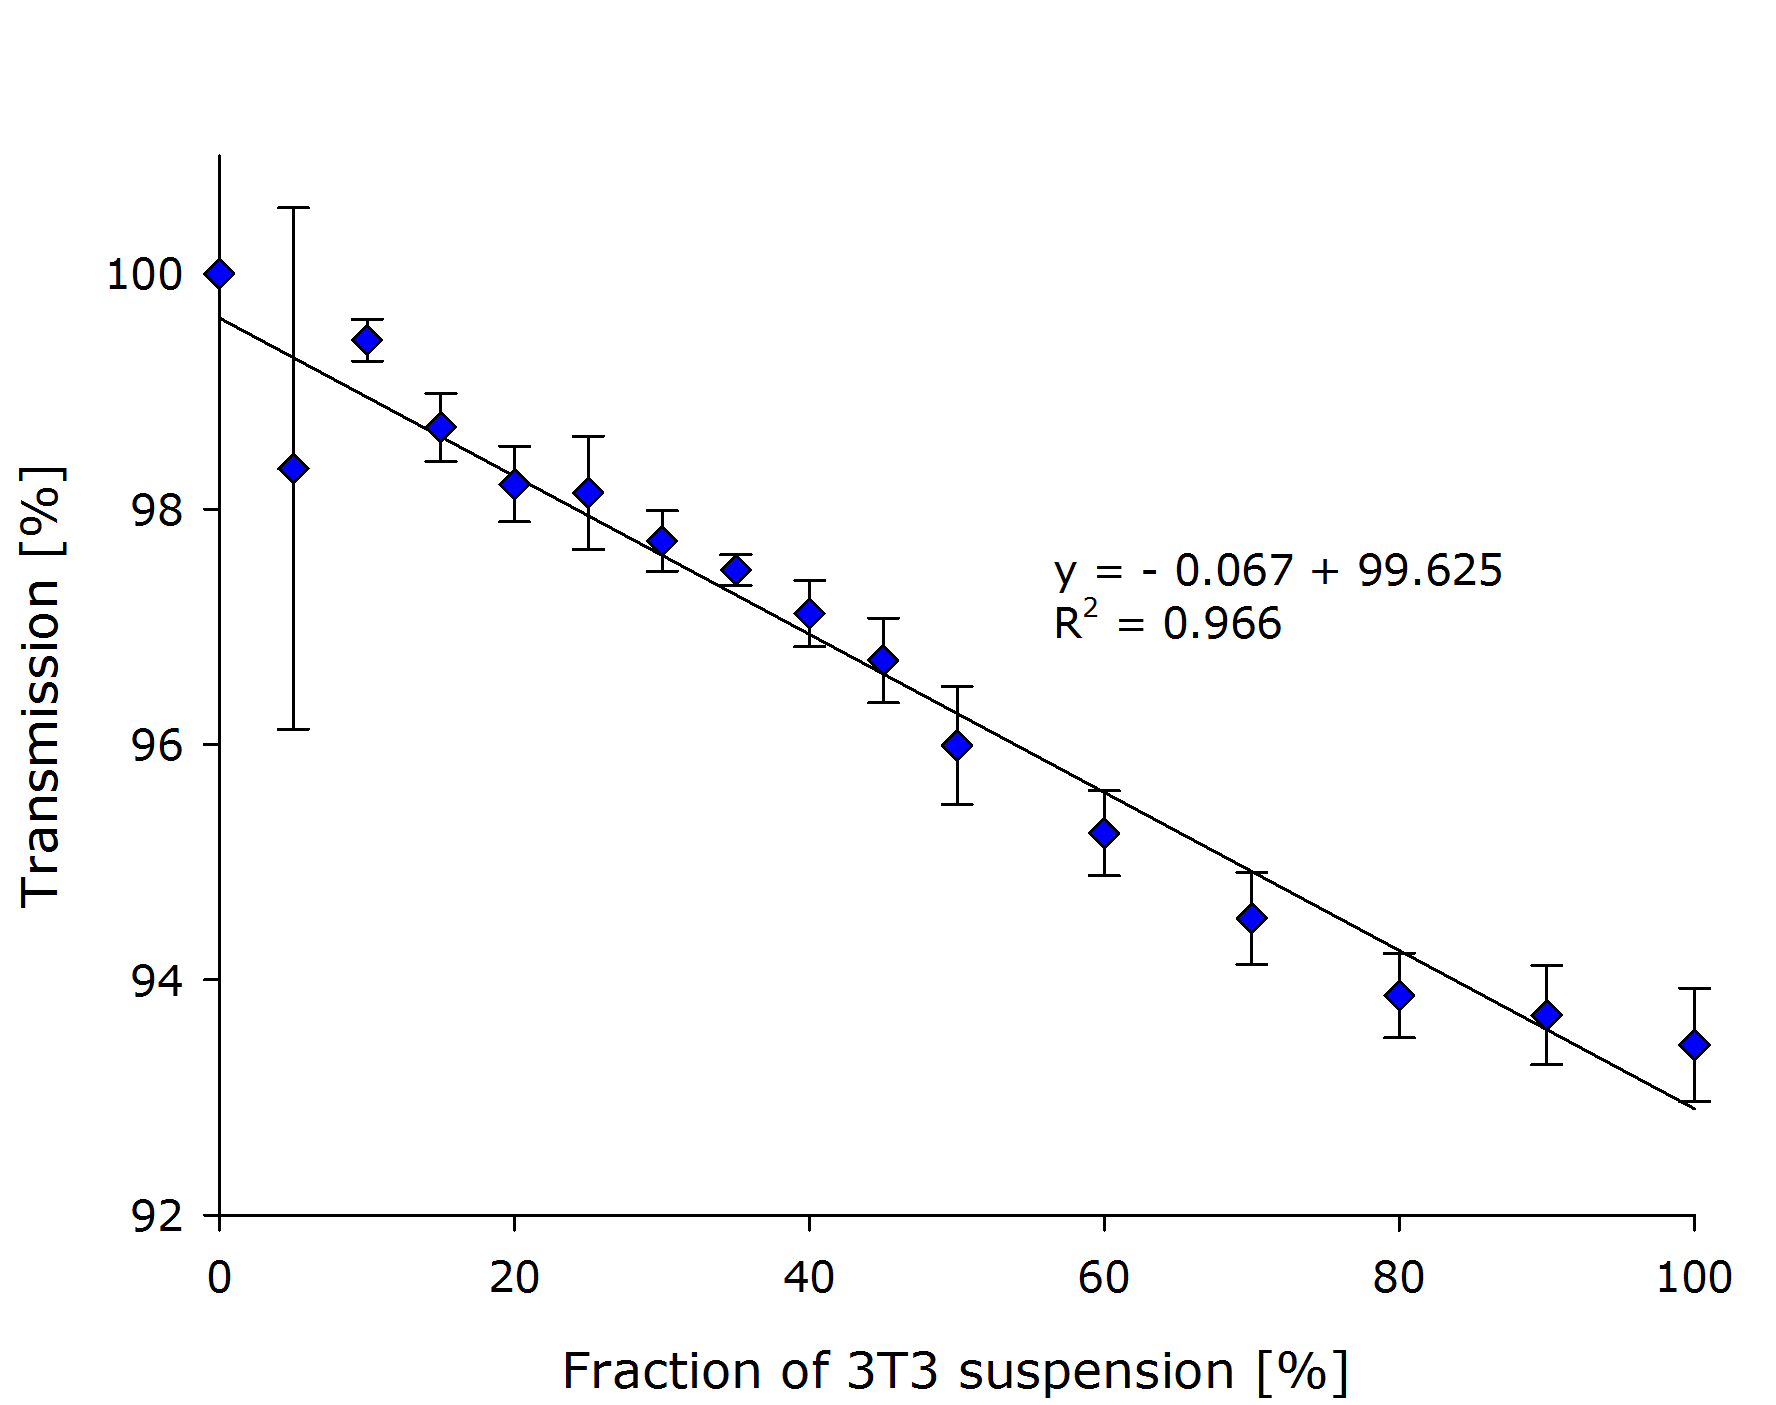
| - | They prepared a dilution series with biological triplicates of their NIH3T3 mouse fibroblasts. | + | They prepared a dilution series with biological triplicates of their NIH3T3 mouse fibroblasts in the respective growth medium. The absolute cell number was determined at 10{{sup|6}} cells/ml. The transmission of light that was measured by our prototype, is plotted against the fraction of cell culture in the sample in the left chart: |
| + | |||
| + | |||
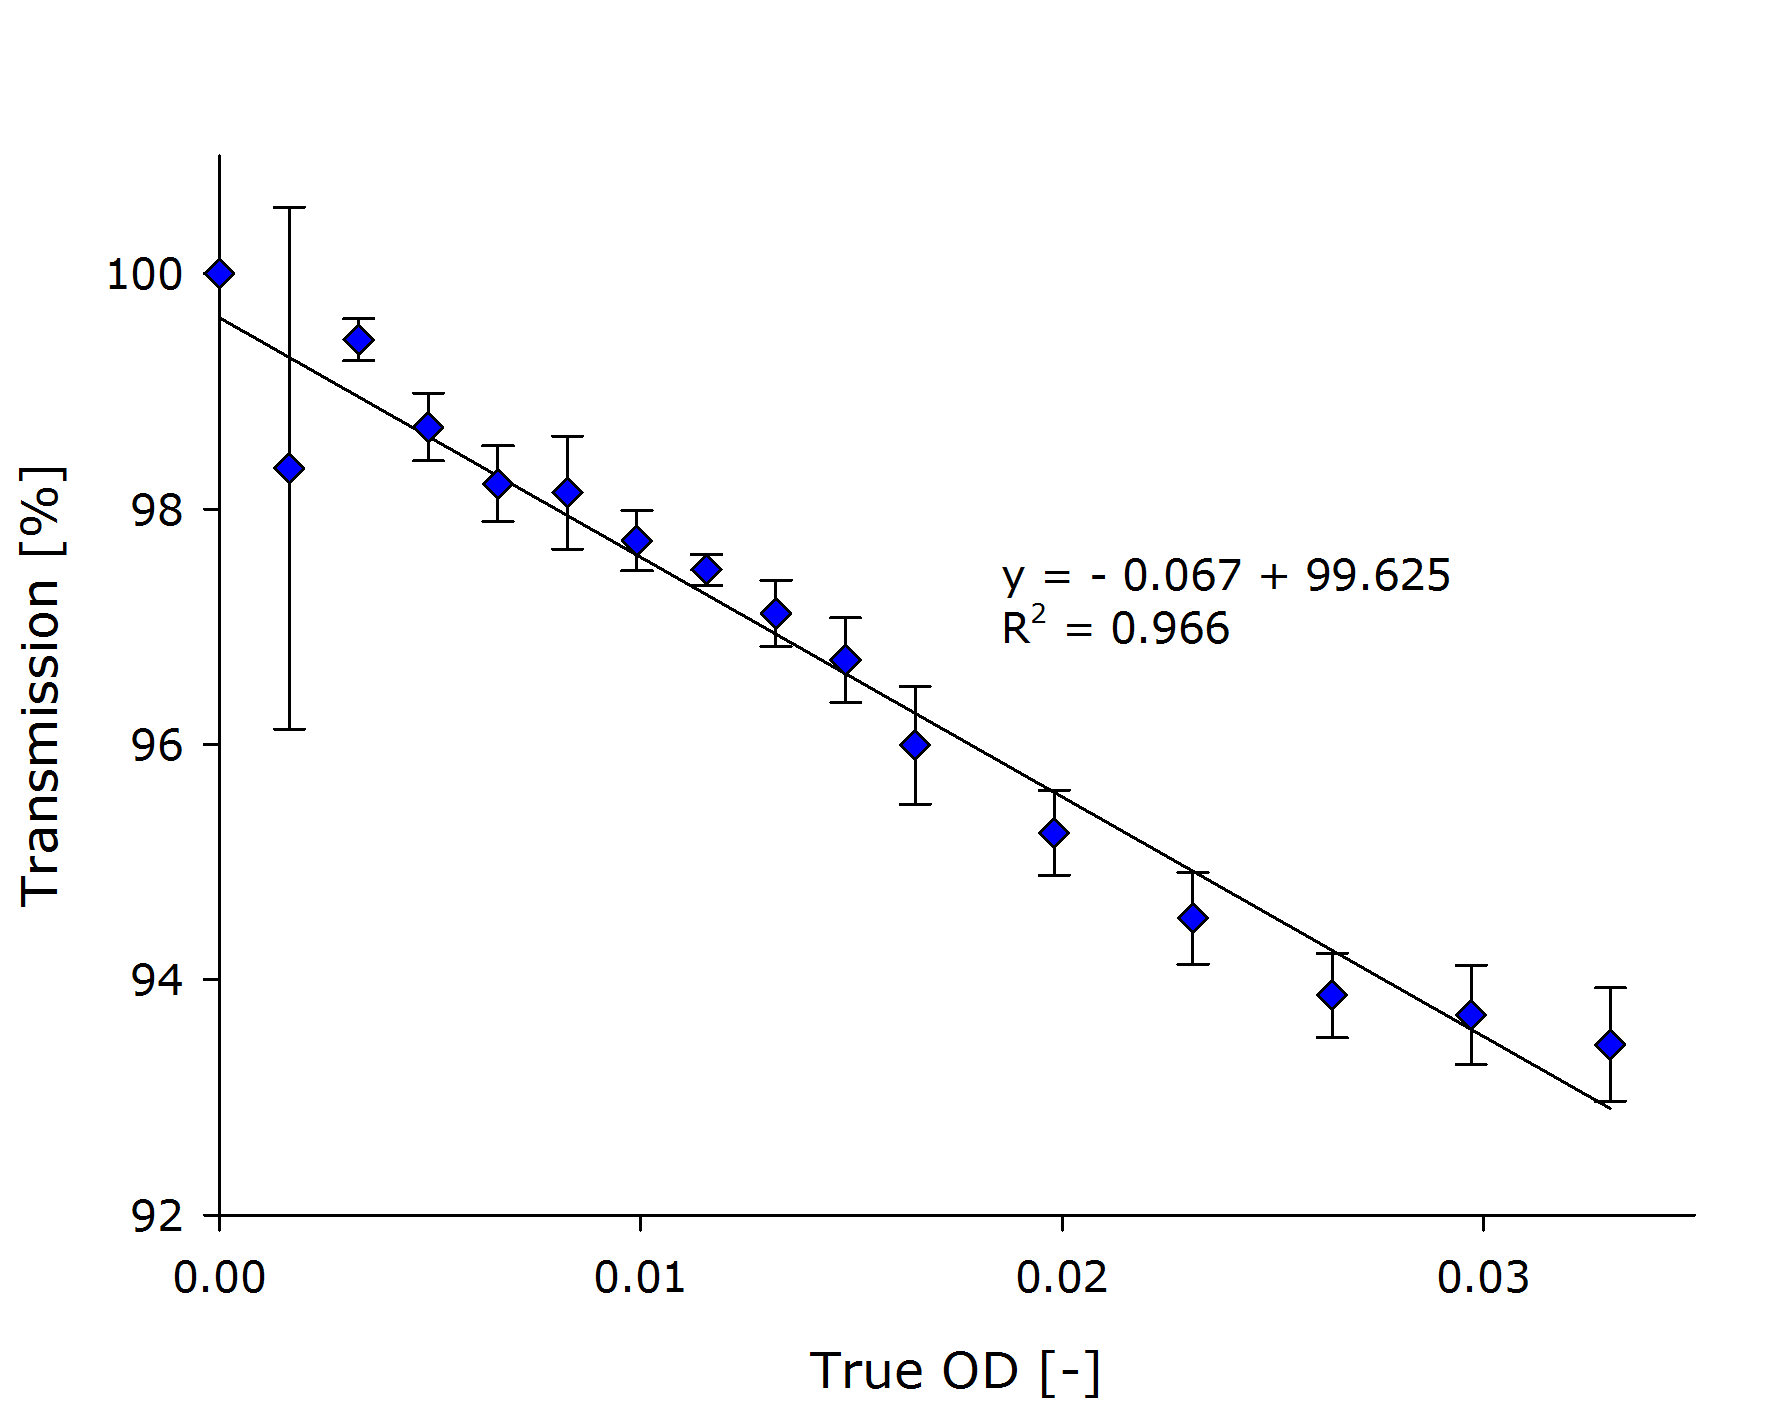
| + | {{Team:Aachen/FigureDual|Aachen_Collaboration-FR_NIH3T3_1.png|Aachen_Collaboration-FR_NIH3T3_2.png|title1=Transmission at different concentrations|title2=Transmission versus true OD of the sample|subtitle1=A linear dependency was observed between the calculated concentration of cells transmission [%].|subtitle2=Calculation of the true ODs revealed, that the optical density of the samples was very low.|width=425px}} | ||
| + | |||
| + | From the transmittance data of the dilution series, we calculated the [[Team:Aachen/Notebook/Engineering/ODF#Evaluation|true OD]] of the sample (right chart above). | ||
| + | |||
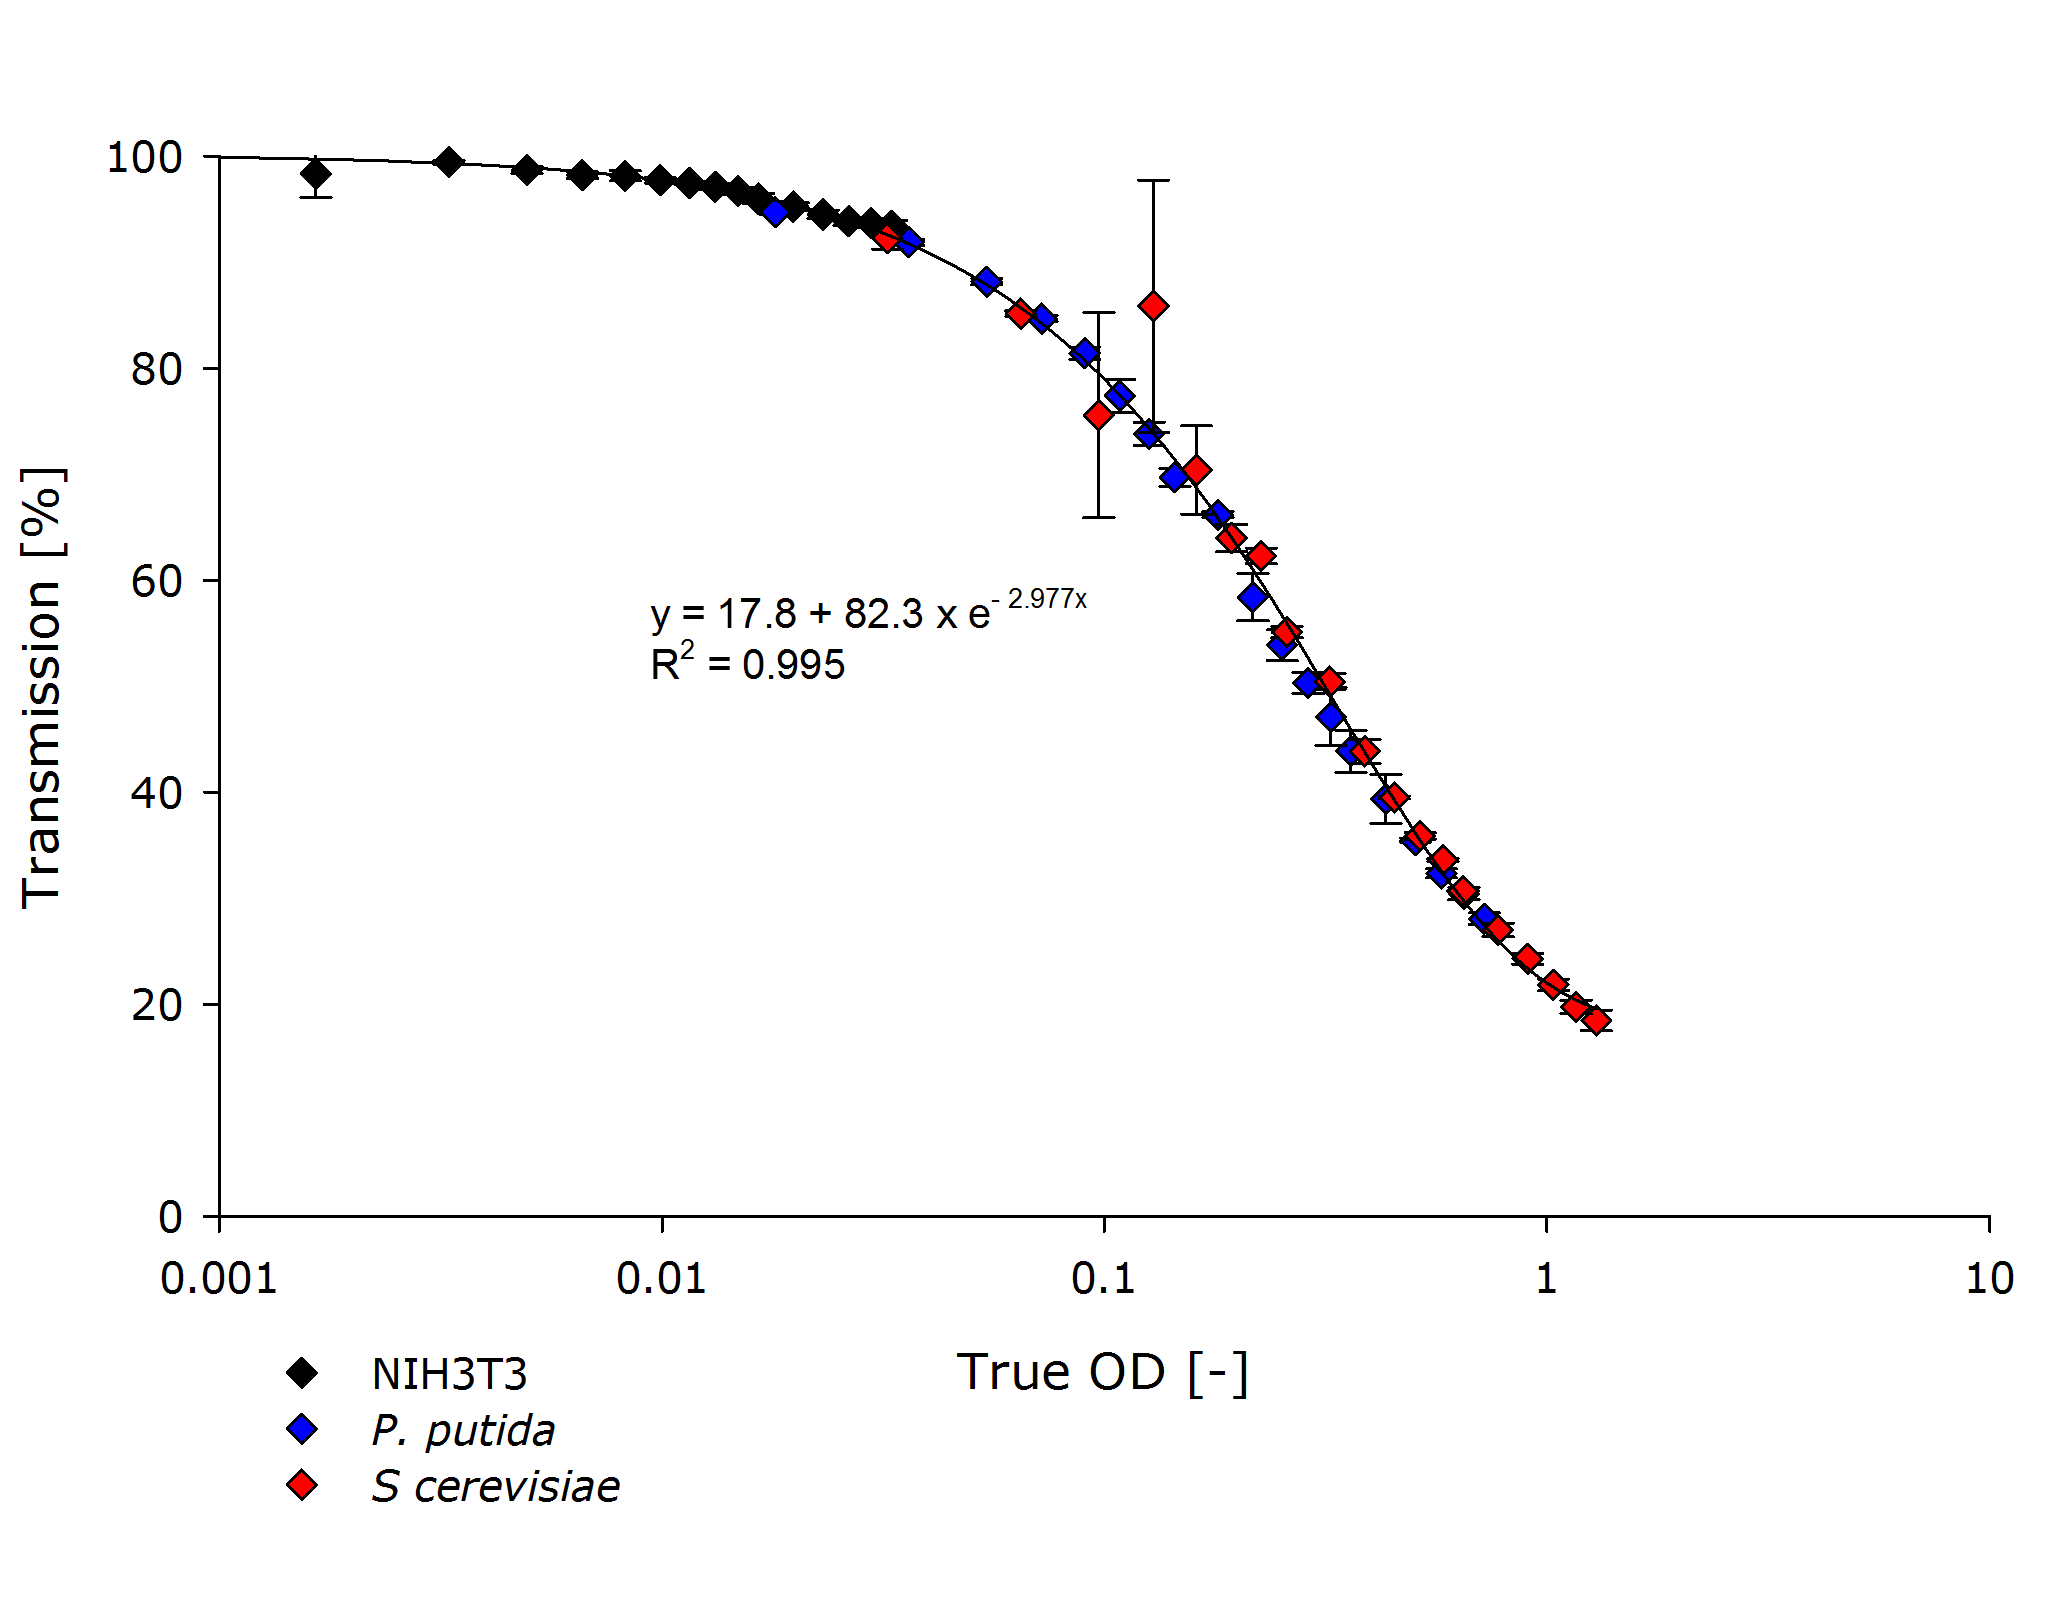
| + | Finally, we incorporated the measurements by team Freiburg into our characterization of the OD-measurement device that now covers multiple strains over three orders of magnitude: | ||
| + | |||
| + | {{Team:Aachen/Figure|Aachen_ODallstrains1.png|title=Transmission of different cell types at OD-values from 0.001-1|subtitle=The transmittance data of NIH 3T3 cells align with the transmittance of ''P. putida'' and ''S. cerevisiae'' strains, even though the measured optical densities are lower by 1-2 orders of magnitude.|width=800px}} | ||
| + | |||
| + | Our friends in Freiburg also tested a Nanodrop, but reported that this commercial device was unable to quantify the diluted samples. In the end we were very satisfied with the results of our cooperation! | ||
| + | |||
{{Team:Aachen/Footer}} | {{Team:Aachen/Footer}} | ||
Latest revision as of 03:38, 18 October 2014
|
|
 "
"
