Team:Aachen/Interlab Study/Hardware
From 2014.igem.org
(→Fluorescence) |
(→Fluorescence) |
||
| Line 42: | Line 42: | ||
== Fluorescence == | == Fluorescence == | ||
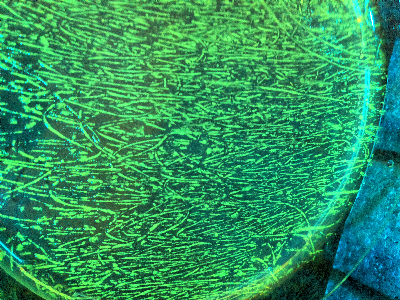
| + | {{Team:Aachen/Figure|Aachen_gfp_ecoli_plate_1.jpg|center|title=Figure 1|subtitle=E. coli plate fluorescence|width=400px}} | ||
| + | When measuring fluorescence, two approaches can be followed | ||
| + | * measure the light intensity sent to fluorescence protein, measure returning light intensity and compare | ||
| + | * measure two samples, and detect the increase in light returned | ||
| + | which follows either an absolute or relative quantification. For most tasks however the relative increase in fluorescence is needed, and therefore this approach is also used for this device. | ||
| + | ''Figure 2'' shows the schematic principle of the fluorescence measurement with our device. | ||
| - | {{Team:Aachen/Figure|Aachen_gfp_ecoli_plate_1.jpg|center|title=Figure | + | {{Team:Aachen/Figure|Aachen_gfp_ecoli_plate_1.jpg|center|title=Figure 2|subtitle=Schematics of fluorescence measurement|width=300px}} |
=== Characteristic Curve === | === Characteristic Curve === | ||
| + | |||
| + | An important observation for fluorescence measurement is that the linearity of the measurement highly depends on the chosen light sensor. | ||
| + | If the light sensor is not linear over the spectrum of measurement, linearity would be needed to be corrected by software. Fortunately the characteristic curve of the TSL 235 R shows perfect linearity such that no software correction is needed. | ||
| + | |||
| + | This needed to be confirmed by measurements. We used an E. coli dilution series to perform this experiment. | ||
| + | ''Figure 3'' shows the recorded values. The linearity clearly can be seen, the regression coefficient of 0.99 also supports this. | ||
== Optical Density == | == Optical Density == | ||
Revision as of 22:57, 22 August 2014
|
|
 "
"
