Team:Aachen/Notebook/Engineering/ODF
From 2014.igem.org
(→Evaluation of the Fluorescence Measurement) |
(→Evaluation of the Fluorescence Measurement) |
||
| Line 232: | Line 232: | ||
<span class="anchor" id="f"></span> | <span class="anchor" id="f"></span> | ||
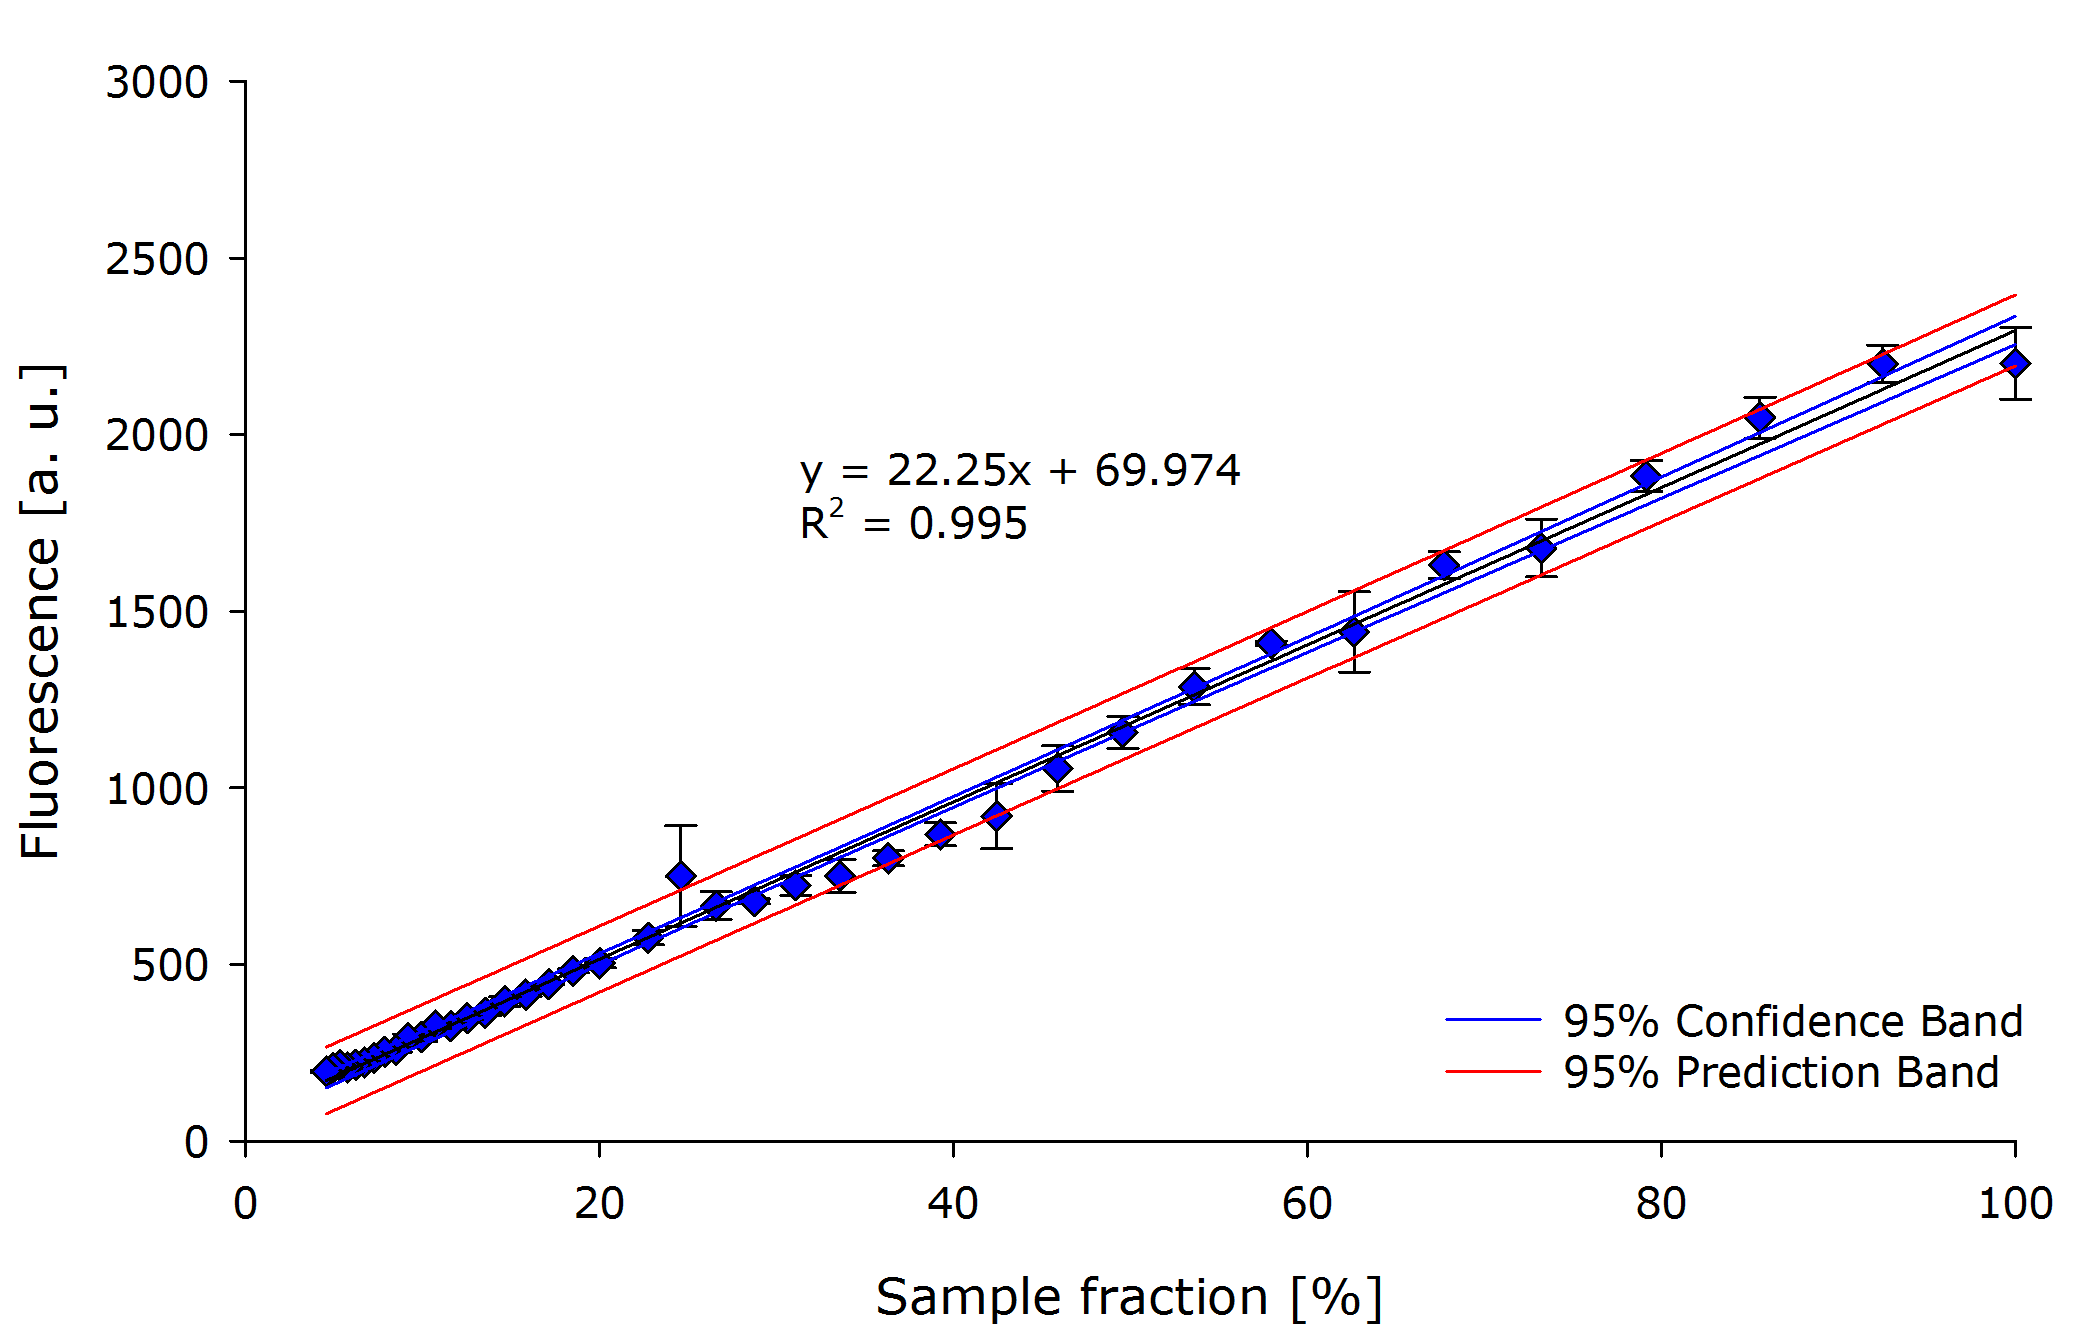
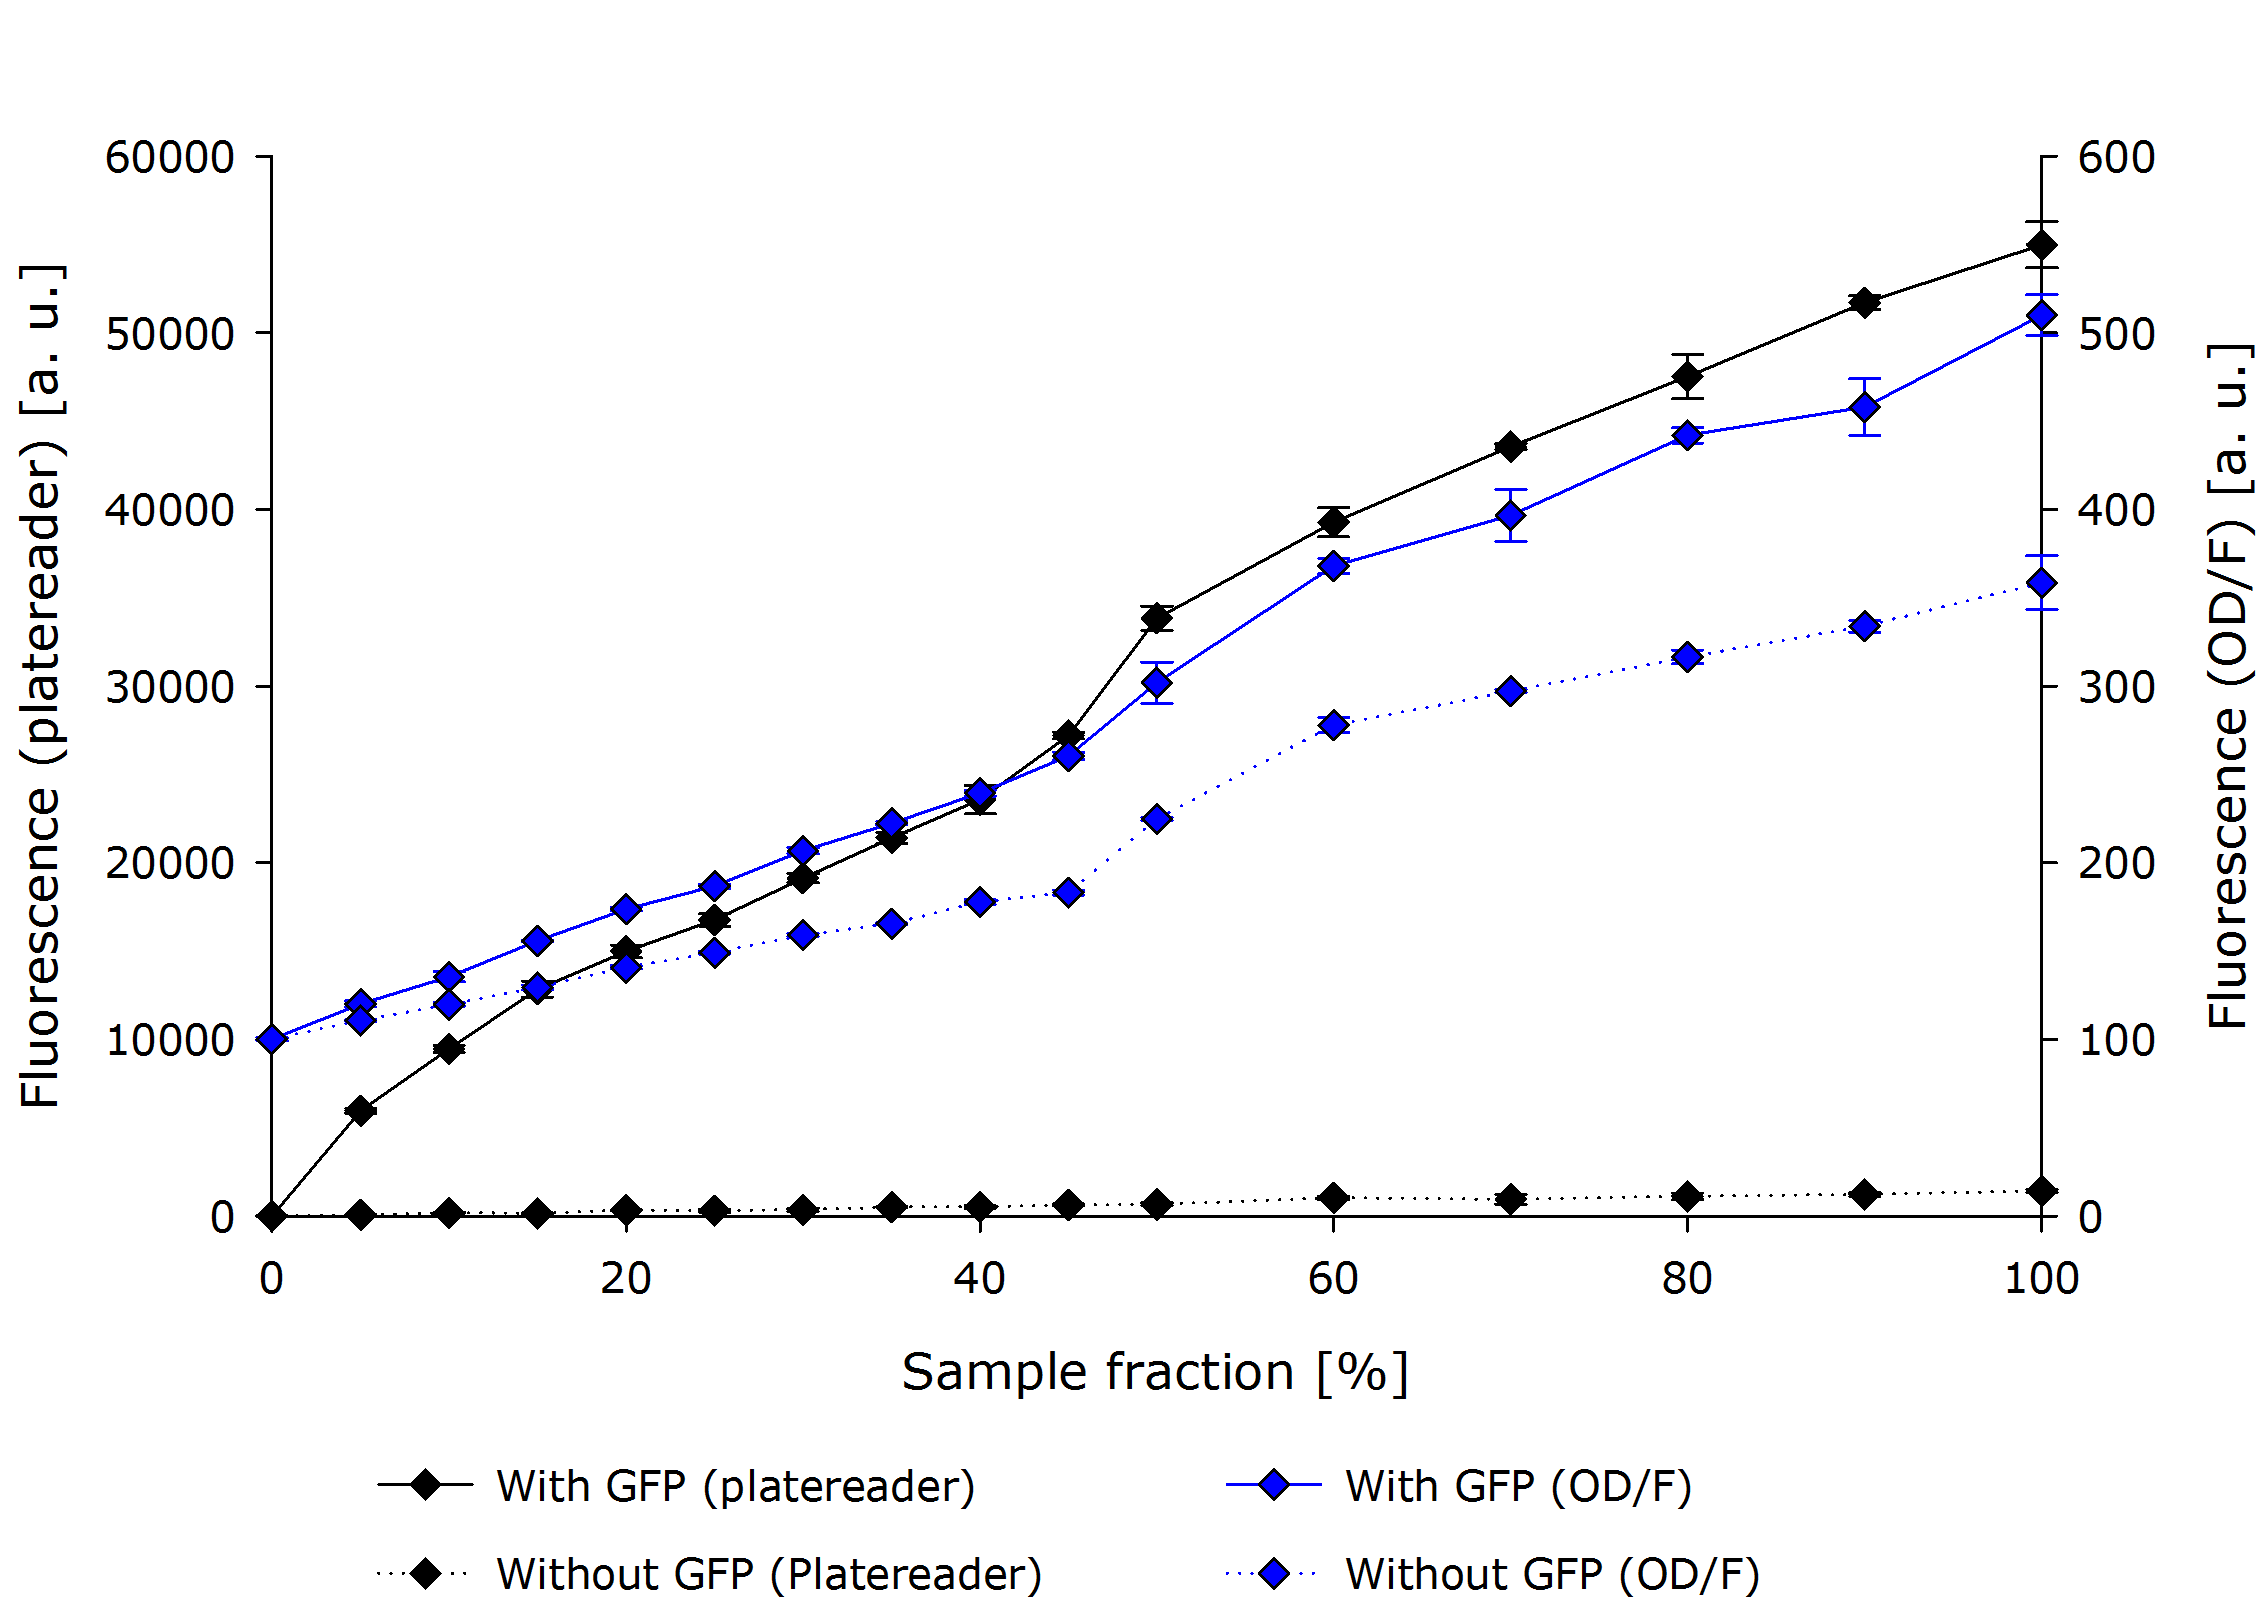
| - | For the evaluation of the fluorescence measurement we performed a dilution series of a constitutively GFPmut3b expressing ''E. coli''. | + | For the evaluation of the fluorescence measurement, we performed a dilution series of a constitutively GFPmut3b expressing ''E. coli''. |
The below figure shows the absolute measurements for both the platereader and our OD/F device. The abrupt jump at 50% concentration can be explained by a second dilution step and is prevalent in both devices. | The below figure shows the absolute measurements for both the platereader and our OD/F device. The abrupt jump at 50% concentration can be explained by a second dilution step and is prevalent in both devices. | ||
| Line 239: | Line 239: | ||
<center> | <center> | ||
| - | {{Team:Aachen/Figure|align=center|Aachn 15-10-14 F platereader ODF iFG.PNG|title=Fluorescence Measurement comparison OD/F device and Platereader|subtitle=Comparison of a fluorescence measurement of our device and the platereader. Our OD/F device shows no significant.|width=700px}} | + | {{Team:Aachen/Figure|align=center|Aachn 15-10-14 F platereader ODF iFG.PNG|title=Fluorescence Measurement comparison OD/F device and Platereader (absolute values)|subtitle=Comparison of a fluorescence measurement of our device and the platereader. Our OD/F device shows no significant linearity.|width=700px}} |
</center> | </center> | ||
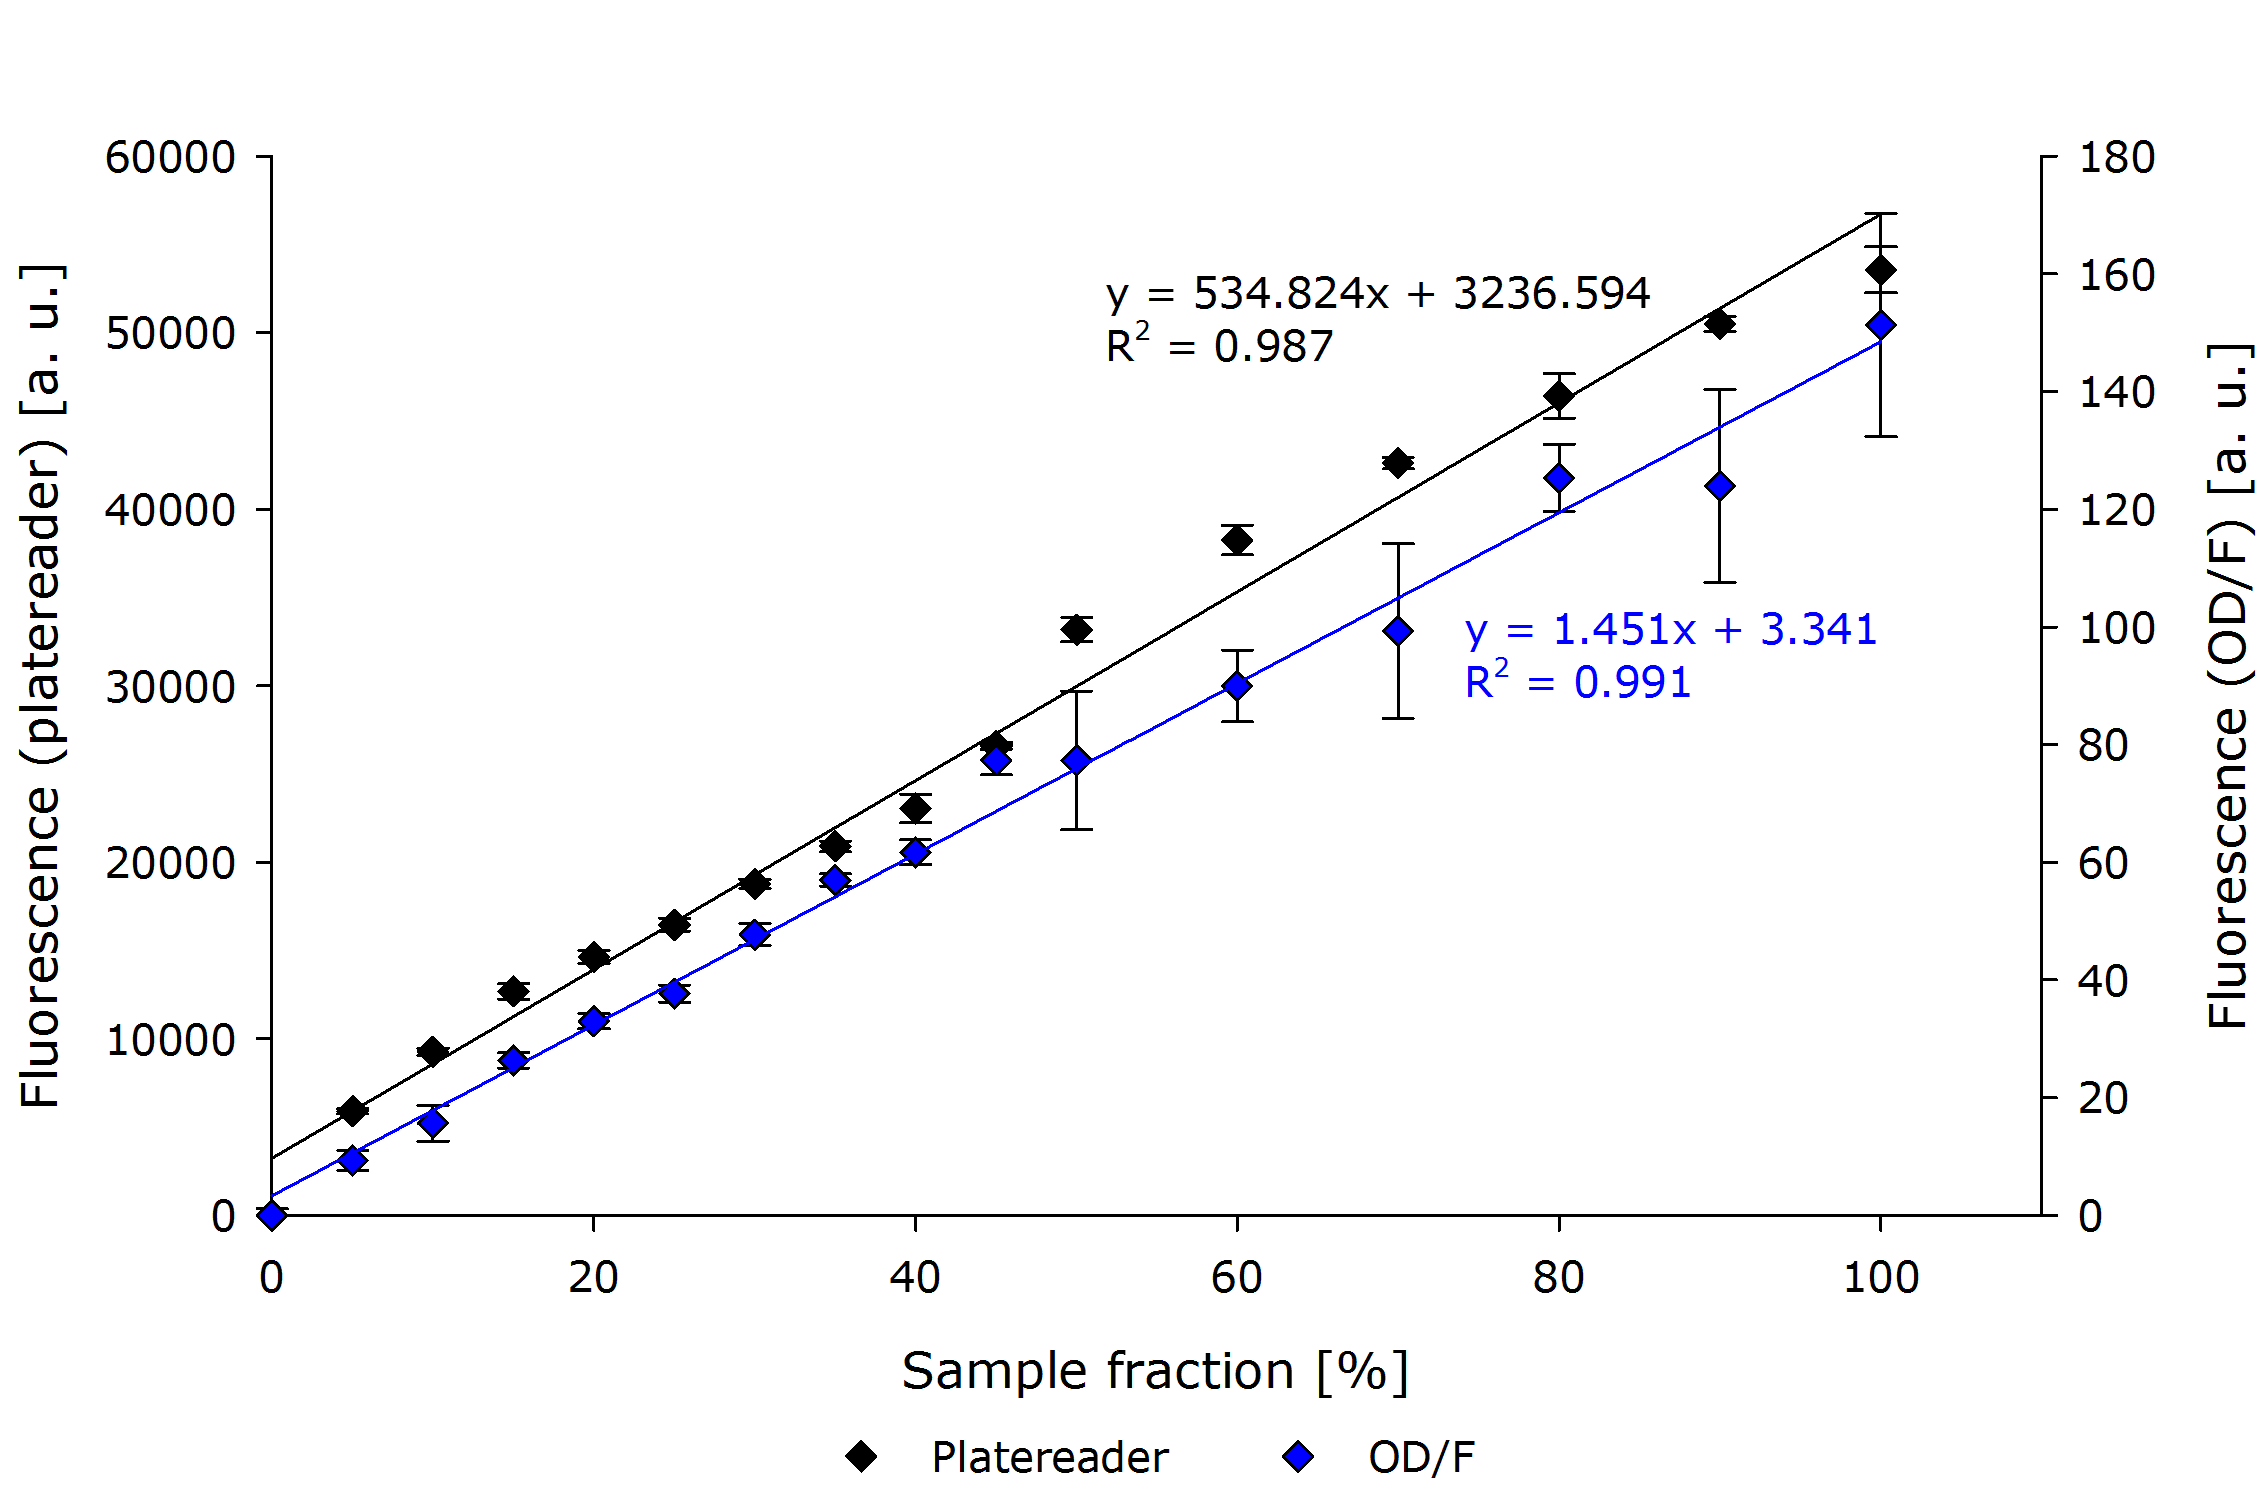
| - | If one compares the results there, as in | + | If one compares the results there, as in the below figure with normalized fluorescence values, interesting observations can be made. |
First, both platereader and OD/F device show very similar results. | First, both platereader and OD/F device show very similar results. | ||
The regression curves differ only in a linear factor. | The regression curves differ only in a linear factor. | ||
| Line 248: | Line 248: | ||
Overall the linearity which has been observed earlier (in testing the general setup) could be verified. | Overall the linearity which has been observed earlier (in testing the general setup) could be verified. | ||
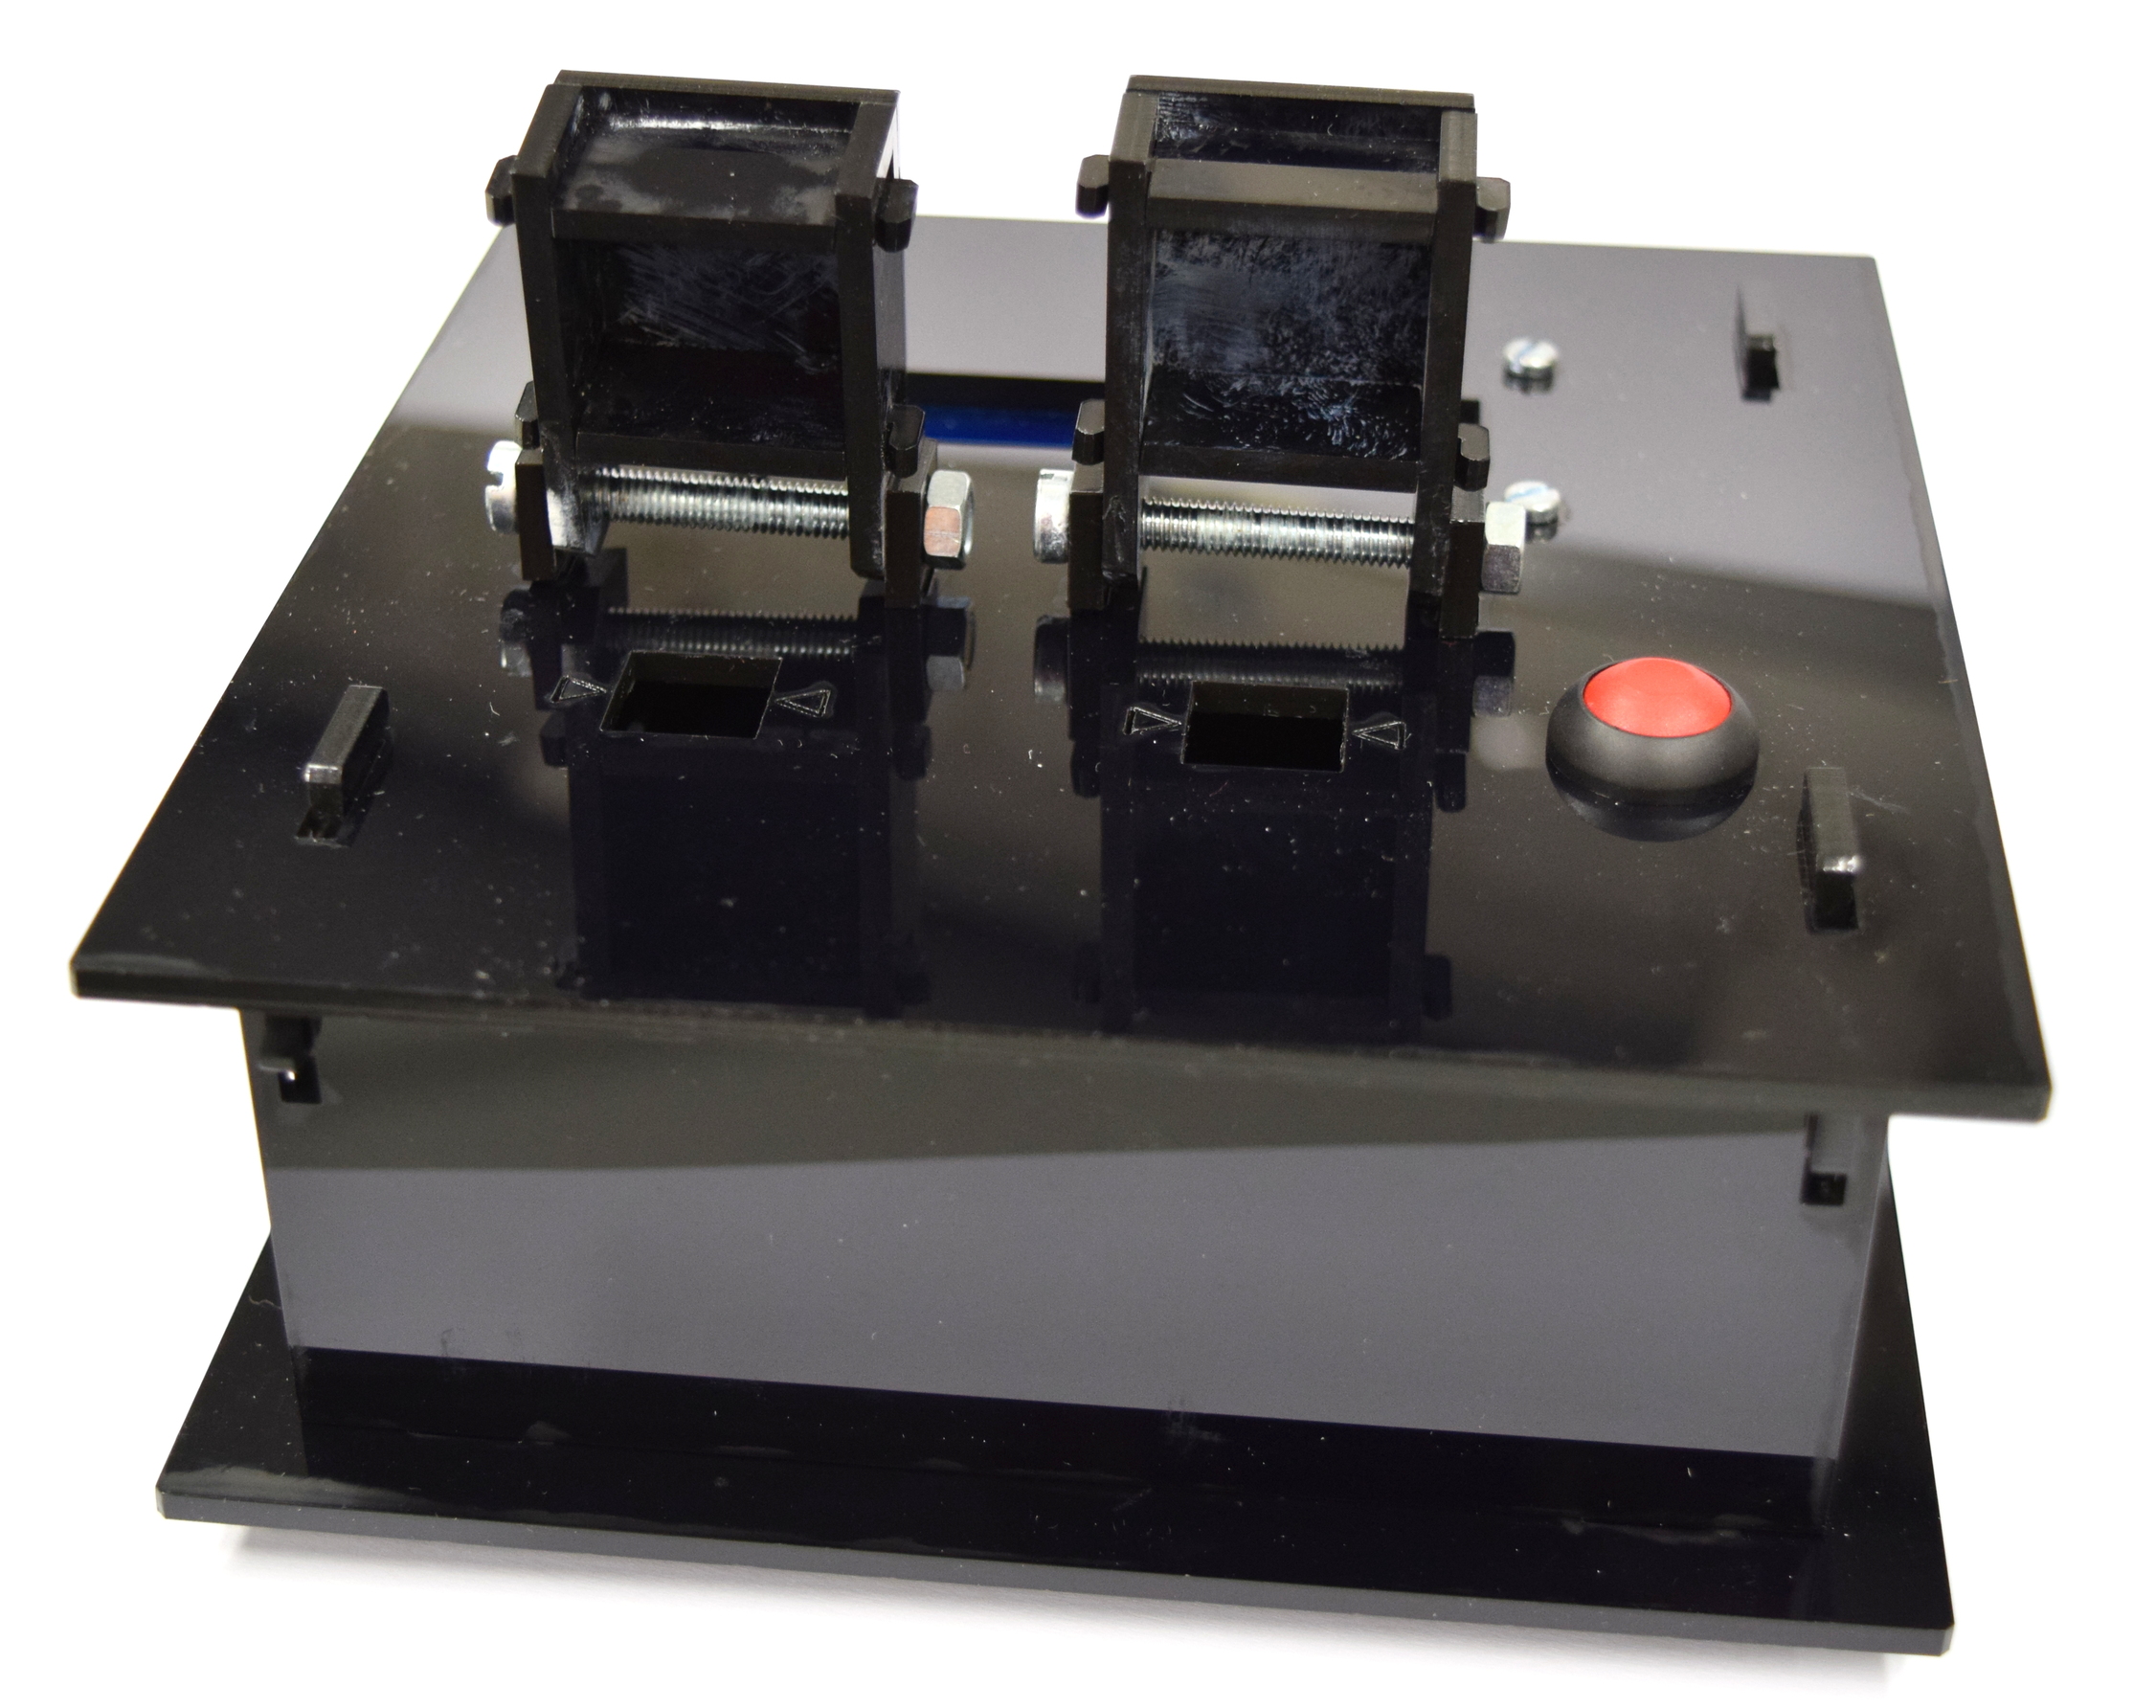
Therefore our do-it-yourself OD/F device can be used to determine fluorescence. | Therefore our do-it-yourself OD/F device can be used to determine fluorescence. | ||
| - | |||
| - | |||
<center> | <center> | ||
| - | {{Team:Aachen/Figure|align=center|Aachen 15-10-14 F platereader ODF2 iFG.PNG|title=Fluorescence Measurement comparison OD/F device and | + | {{Team:Aachen/Figure|align=center|Aachen 15-10-14 F platereader ODF2 iFG.PNG|title=Fluorescence Measurement comparison OD/F device and platereader using normalized fluorescence values|subtitle=Comparison of a fluorescence measurement of our device and the platereader. Our OD/F device shows no significant. A non-GFP expressing E. coli dilution has been used to normalize the GFP dilution series. A linear correlation can be seen.|width=700px}} |
</center> | </center> | ||
Revision as of 21:12, 17 October 2014
|
|
|
|
|
 "
"
