Interlab Study
Experimental Design
For the interlab study, we are testing GFP-containing BioBricks for fluorescence and optical density. As BioBricks we chose I20260, J23101.E0240 and J23115.E0240. The latter consists of a pSB3K3 backbone with an insert, a combination of the promoter J23101, the RBS B0032, the GFP coding sequence E0040 and the terminator B0015. J23101.E0240 has the same insert as I20260, but has pSB1C3 as a backbone. J23115.E0240 only differs from J23101.E0240 in the use of another promotor, namely J23115. As a negative control, we used just B0015 in pSB1C3.
Over a time span of 18 hours the optical density and fluorescence of cultures containing these BioBricks were measured every 2 hours using the spectrophotometer and plate reader, respectively.
Expected Results
Fluorescence was expected to develop in cultures containing I20260, J23101.E0240 and J23115.E0240, as all include the GFP coding sequence. However, the signal was expected to be stronger in J23101.E0240 than in I20260 since pS1C3 is a high copy plasmid while pSB3K3 is a low to mid copy plasmid. Therefore, a higher fluorescence was expected of J23101.E0240 compared to I20260 even though they share the same insert. J23115.E0240, too, was supposed to produce a fluorescent signal, but J23115 (the mutated version K823012 was used) is a lot weaker promotor than J23101. Therefore, a lot lower - if any - fluorescence is expected with this BioBrick.
B0015 was used as our negative control as the insert only contains a terminator and no expression cassette for GFPmut3b, and therefore no fluorescence was expected.
Results
After observing the optical density (OD) and fluorescence for 18 hours while taking samples every 2 hours, the following results were obtained:
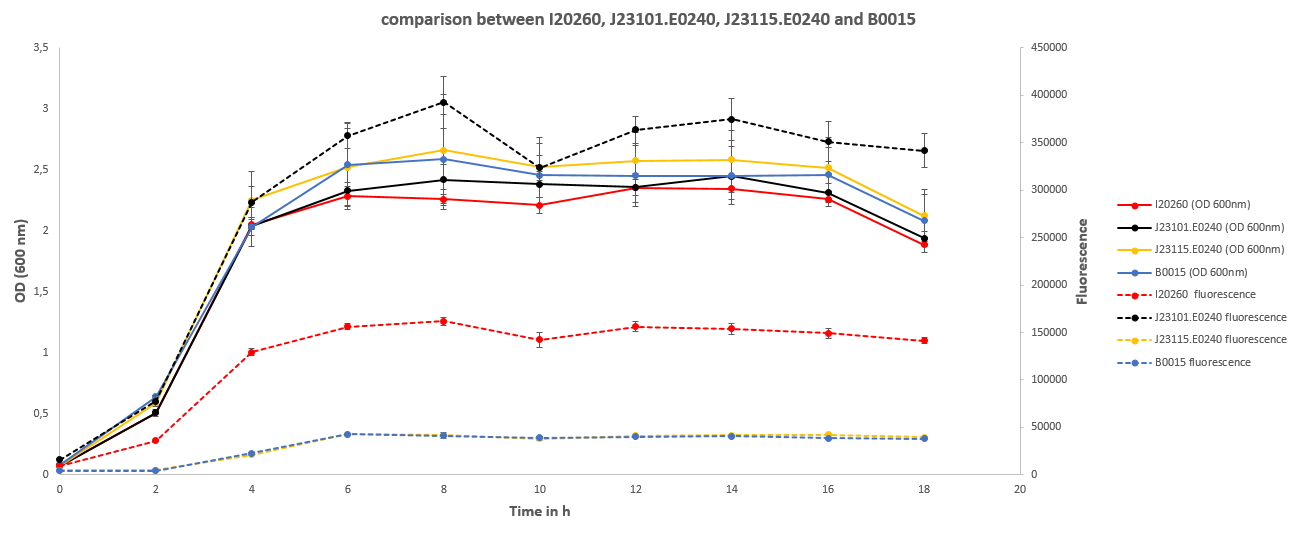
This shows that all cultures had ODs in the same range throughout the experiment. After the exponential growth phase the stationary phase started shortly after 4 hours of cultivation time. The OD did not change from thereon until a cultivation time of 16 hours after which it started to decline.
The development of fluorescence followed largely the pattern of the OD, but differed a lot in between the different cultures. J23101.E0240 exhibited fluorescence three times stronger than I20260, and about 10 times stronger than B0015 and J23115.E0240. The latter two did not differ in terms of fluorescent signal.
Discussion
The OD is an indirect measurement of the biomass in the shake flask. Through the correlation of both measurements the results show that the difference in biomass of the cultures is not significantly enough to affect the fluorescence data. Therefore, the fluorescence data can be interpreted as a direct result of the fluorescence per cell instead of an overall fluorescence per culture.
The fluorescence data shows a strong difference between the I20260 and J23110.E240. Even though both inserts are the same, there is a difference in fluorescence, as expected, because of the different plasmid backbones. The high copy plasmid pSB1C3 shows a 3 times stronger fluorescence signal per cell than the low to mid copy plasmid pSB3K3. This can be directly related to the number of plasmids in the cells coding for GFP.
Both J23115.E0240 and B0015 show no significant fluorescence. The increase at 4 hours is explained by the increase of OD resulting in noise. B0015 behaves therefore as expected. J23115.E0240 in its original, non-mutated state was supposed to show a slight but weaker fluorescence than J23101.E0240. However, the mutations introduced made the promoter non-functional, which lead to no expression of GFP and therefore no observation of fluorescence.
Materials and Methods
Constructs and strains
All constructs used were transformed into NEB 10β cells. The constructs I20260 as well as B0015 were taken directly from the iGEM 2014 distribution plates. The constructs J23101.E0240 as well as J23115.E0240 were made using the 3A Assembly. Therefore, the subparts J23101, J23115 as well as E0240 were transformed directly from the 2014 distribution plates into NEB 10β cells. Afterwards the plasmids were recovered using the illustra plasmidPrep Mini Spin Kit. The purified plasmids J23101 and J23115 were cut with the restriction enzymes EcoRI and SpeI, while E0240 was cut with XbaI and PstI. The restricted plasmids were then ligated together using the T4 DNA Ligase. Afterwards, the ligation product was introduced into the pSB1C3 linearized backbone provided by iGEM headquarters with the 2014 distribution which we had also cut with EcoRI and PstI. All restrictions and ligations were performed using enzymes and buffers of the NEB iGEM Kit). The final product was once again transformed into NEB 10β cells.
The correct identity of the resulting constructs were confirmed by sequencing. The sequencing data (consensus sequences) can be found here.
Note: We used the mutated version of J23115 as sent out by the iGEM headquarters. The mutation makes J23115 effectively the same promoter as K823012. We will still refer to the promoter as J23115 though, to keep it more easily recognizable with the other Interlab Study results.
Inoculation and Cultivation
The cultivation of our cultures was performed in 50 ml LB medium in 500 ml shake flasks at 37 degrees Celsius and 300 rpm shaking frequency. Appropiate antibiotics were added to each media (Kanamycin for I20260, Chloramphenicol for B0015, J23101.E0240 and J23115.E0240). Both antibiotics were added from a 1000* stock stored at -20 degrees Celsius for a final concentration of 35µg/ml Chloramphenicol and 50µg/ml for Kanamycin respectively.
The precultures were inoculated from the same cryo stocks every time under a sterile clean bench. They were cultivated for 16 hours and then sampled for OD measurement with a spectrophotometer. Then 2 ml of each preculture were centrifuged (5 minutes, 6000 g) and then washed twice with PBS buffer. Afterwards, all cultures were inoculated to have the same starting OD, once again done under sterile conditions inside a clean bench.
Sampling
To draw samples, the shake flasks were taken out of the 37 degrees Celsius room and brought onto a nearby bench. There 3 ml of sample were taken out next to a Bunsenburner flame and put into 2 ml cuvettes. As soon as all samples from all flasks were taken the flasks were taken back inside the 37 degrees Celsius warm room and shaking was restarted.
The whole process of taking samples for all 12 flasks (3 biological replicates for each construct) took 5 minutes and samples were taken every 2 hours.
After 4 hours we had to dilute the sample to a concentration of 20 % and from the 6th to 18th hour we had to dilute to a concentration of 10 %. Dilution occured in LB medium.
After the measurement of OD in the spectrometer 100 µl of each sample were taken out and put on a 96 well plate (Thermo microfluor 1, flat-bottom, black) to measure fluorescence. Each measurement occured in a technical triplicate, resulting in 36 different samples being measured for every sampling step.
Measurement of OD using a Spectrophotometer
For OD measurement the Unico Spectrophotometer 1201 of Fisher Bioblock Scientific was used. OD measurement was taken at 600 nm and we used pure LB medium (from the same batch as the medium used for cultivation) as our blank. We only measured OD up to 0,8. At a higher OD we diluted the sample with LB medium (again from the same batch as our cultivation medium). Dilution was done by presetting the LB medium into cuvettes, then adding our cultivation sample and vortexing it thoroughly. The solution was allowed to settle before measurement.
Measurement of fluorescence using a Microplate reader
Measurement of fluorescence was performed using the Synergy Mx from BioTek with the Gen5 software.
Measurement was taken using the following parameters:
| Parameter | value
|
| Software version | 2.1.2014
|
| Reader Type | Synergy Mx
|
| Read | GFP 100
|
| Measurement | fluorescence endpoint
|
| Measurement range | full plate
|
| Filter | filter set 1
|
| Excitation | 496/9,0
|
| Emission | 516/9,0
|
| Gain | 100
|
| Read Speed | normal
|
| Delay | 100 msec
|
| Measurement s/data point | 10
|
| Read height | 8 mm
|
We used LB medium as our blank. According to our sampling technique we used the same dilutions as for the measurement of OD.
|
 "
"
