 "
"
Team:SUSTC-Shenzhen/Notebook/HeLaCell/Construct-Cellline
From 2014.igem.org
Notebook
Elements of the endeavor.
Stably Transfected HeLa cell line construct
2014/8/15 Construct stably transfected HeLa cells!Introduction
In our project, we have to get rid of gene and DNA that lentivirus has integrated into ours genome by Cas9 protein.
So we select green fluorescent protein gene to simulate gene of lentivirus such as HIV and HBV. Then we stably tranfect GFP into HeLa cells, which represent that the lentivirus genome has integrate into human genome. Then we stably transfect Cas9 gene into HeLa cell, which represent we modified Hematopoietic stem cell and integrate Hematopoietic stem cell with Cas9 gene.
In the experiment we use piggy bac transponase to integrate gene into HeLa cells. Next we integrate Cas9 gene and EGFP gene by PB transposon. Cas9 is under control of Teton 3G promoter, so we can induce expression of Cas9 by treating cells with doxycycline.
When cells have expressed Cas9 protein we deliver plasmid encoding gRNA targeting EGFP to help Cas9 specificly cut DNA of EGFP. As a consequence, EGFP will be slience after HeLa cells have been treated with Doxycycline and gRNA.
Aug 14th
Seed cells
[2014 Aug 14th 15:00pm]
Method
Seed HeLa cells in 6-well-plate (15wells at total), 200,000 cells per well. For tansfection
- Procedure
- Wash cells with PBS, trypsin digestion, and medium to stop digestion.
- Transfer the sell suspension in 15ml centrifuge tube and centrifuge at 800rpm, for 5 min.
- Discard the supernatant and add 2ml complete medium to re suspend the cells.
- Add 1ml PBS to every gap between well
- 1:10 dilution count the cell concentration with blood counting slide. Get the concentration: 2,800,000 cells/ml. 1.15ml cell suspendion + about 31ml DMEM with 5% FBS. Mix well and add 2ml per well, shake the plate gently.
Result
The cells plate unevenly concentrated at the center of each well.
Aug 15th
Cell transfection
[2014 Aug 15th 11:00am]
Materials
- plasmid pBx-083 (EGFP)
- plasmid Piggybac
- plasmid Cas9+TetOn
- Lipofectamine 3000(Invitrogen)
- Opti-MEM
- HeLa cells in 6-well-plate
| Plasmid | Concentration(μg/mL) |
|---|---|
| EGFP(pBx-083) | 1641 |
| Cas9+TetOn | 2344.1 |
| Piggybac | 2896.7 |
Method
a. 3 combinations
- EGFP(pBx-083) & Piggybac(transposase)
- EGFP & Cas9 & Piggybac
- Cas9(Cas9+TetOn) & Piggybac
For the first two combination we have different ratio of EGFP to get mono-copy of EGFP in cell line.
| Group 1 | EGFP:Piggybac = 1:1 |
|---|---|
| Group 2 | EGFP:Piggybac = 1:9 |
| Group 3 | Cas9:EGFP:Piggybac = 1:1:1 |
| Group 4 | Cas9:EGFP:Piggybac = 3:17:10 |
| Group 5 | Cas9:Piggybac = 1:1 |
| Groups(3wells/group) | EGFP(μl) | Cas9(μl) | Piggybac(μl) |
|---|---|---|---|
| Group 1(3wells) | 2.29 | 0 | 1.30 |
| Group 2(3wells) | 0.46 | 0 | 2.33 |
| Group 3(3wells) | 1.49 | 1.359 | 0.612 |
| Group 4(3wells) | 0.46 | 1.81 | 0.86 |
| Group 5(3wells) | 0 | 1.60 | 1.30 |
Procedure
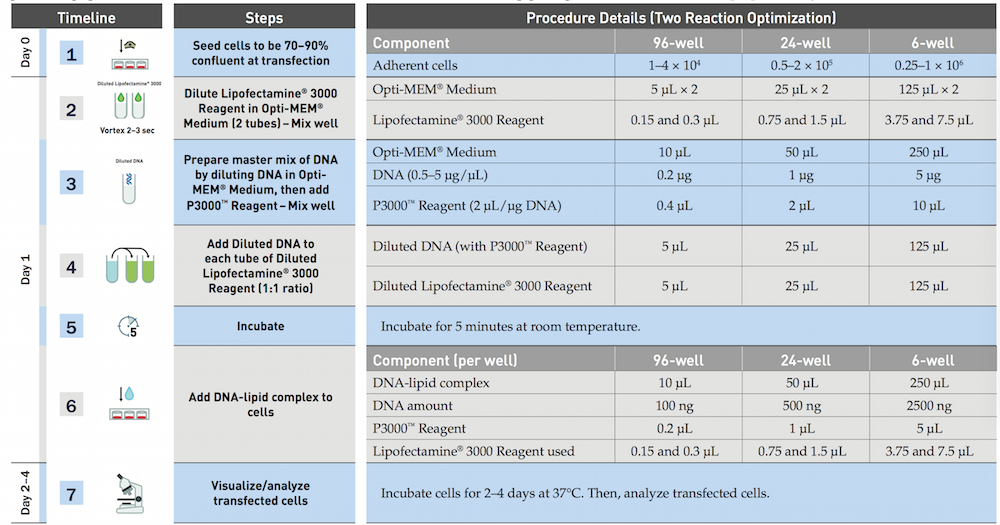
The official protocol of Lipofectamine 3000 (Invitrogen)
We use the reduced amout of Lipofectamine(lipo), and slightly improve the procedure by the experience of an RA.
- Dilute 3.75μl/well Lipofectamine 3000 reagent in 25μl/well Opti-MEM, and incubation for 5min
- Prepare master mix of DNA 0.5μg/well by dilutiong DNA in Opti-MEM medium 25μl/well according to the form, then add P3000 reagent.
- Add dilutetd DNA to each tube of diluted lipo 3000.
- Incubation for 10min
- Add DNA lipid complex to cell waiting for the harvest.
Laboratory note
- Add DNA to 380μL Opti-MEM medium according to the table 2 and add 15μL P3000 reagent, mix well.
- Dilute Lipofectamine 3000 Reagent in Opti-MEM Medium: (2x) 1000μL Opti-MEM Medium + 120μL Lipofectamine 3000 Reagent, mix well.
- Add 395μL Diluted Lipofectamine 3000 to Diluted DNA of each group (1:1 ratio), mix well.
- Incubate for about 10min.
- Add DNA-lipid complex (250μL per well) to cells, shake the plate. (12:00 am)
- After 10h, change the medium with the complete medium with 10% FBS and Penicillin-Streptomycin.
Aug 16th
Microscope Observation
[2014 Aug 16th 9:00am]
The first day after transfection
We change to medium into complete medium at 10%FBS 12 hours after transfection according to protocol. And take picture under microscope.
Laboratory note
The transfected cells are observed before we change the medium.
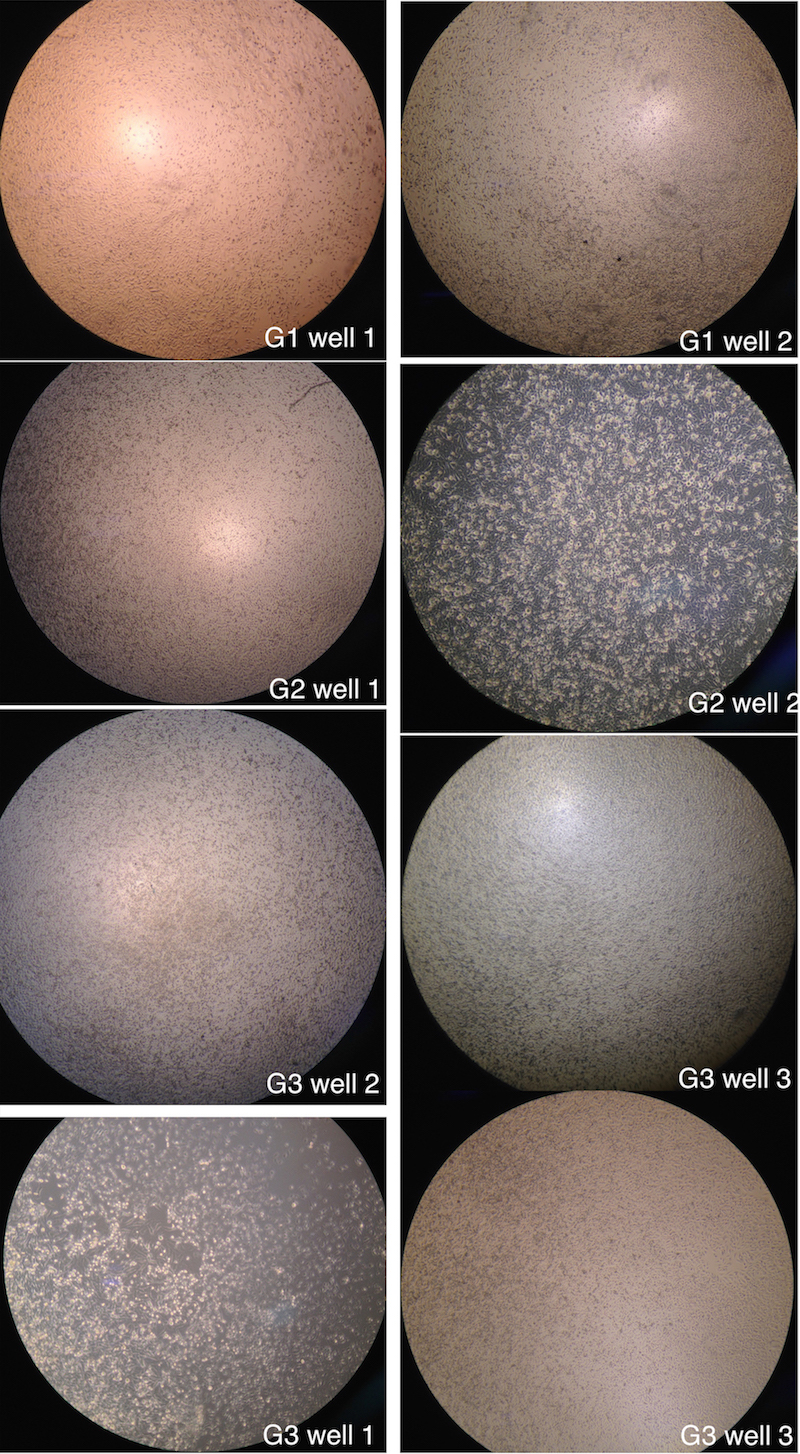
Figure 1. Pictures are captured by phase contrast microscope. We can see clearly that some cells has suspended and became round. Strangely the G3 well 1 has a apparent amount of cells at abnormal status.
It is found that part of the cells round and suspended, and part of cells just become round. But the morphology of most of the cells are normal.
Passage cell to dish
[2014 Aug 16th 15:00pm]
The first day after transfection
Passage part of cells to the 10cm petri dish (for picking monoclonal later except G5), and the remaining cells are still seeded on the previous 24-well plates (about 500μL cell suspension per well). (15:00 pm – 18:00 pm) For every group, two dishes with 5,000 cells seeded and two dished with 50,000 cells seeded.
Procedures
- Wash cells with PBS, trypsin digestion, add medium to stop digestion
- Transfer the cell suspension into 15 mL centrifuge tube and centrifuge at 800rpm for 5 min.
- Discard the supernatant and add 2 mL complete medium to suspend the cells.
- Count the cell concentration with blood counting chamber.
- Mark the new dishes, add 5 mL medium to every dish, and add corresponding cell suspension, mix well with the pipet.
- Culture.
| Group | Counted number | Concentration (cells/mL) | Volume needed |
|---|---|---|---|
| 1 | 30 | 300,000 | 167 and 16.7 |
| 2 | 20 | 200,000 | 294 and 29.4 |
| 3 | 30 | 300,000 | 294 and 29.4 |
| 4 | 30 | 300,000 | 143 and 14.3 |
Discussion
When counting cells, some dead cells were observed, and those cells were not included. The second day morning, some of the cells on the petri dish are round and suspended. Cells were few and scattered. For dishes with 5,000 cells, only several cells can be observed in one field under 4X objective lens. For dishes with 50,000 cells, near 10-20 cells can be observed in one field under 4X objective lens.
Aug 18th
Fluorescent Observation
[2014 Aug 18th 10:00am]
The third day after transfection
Observe the transfected cells on the plate under fluorescence microscope.
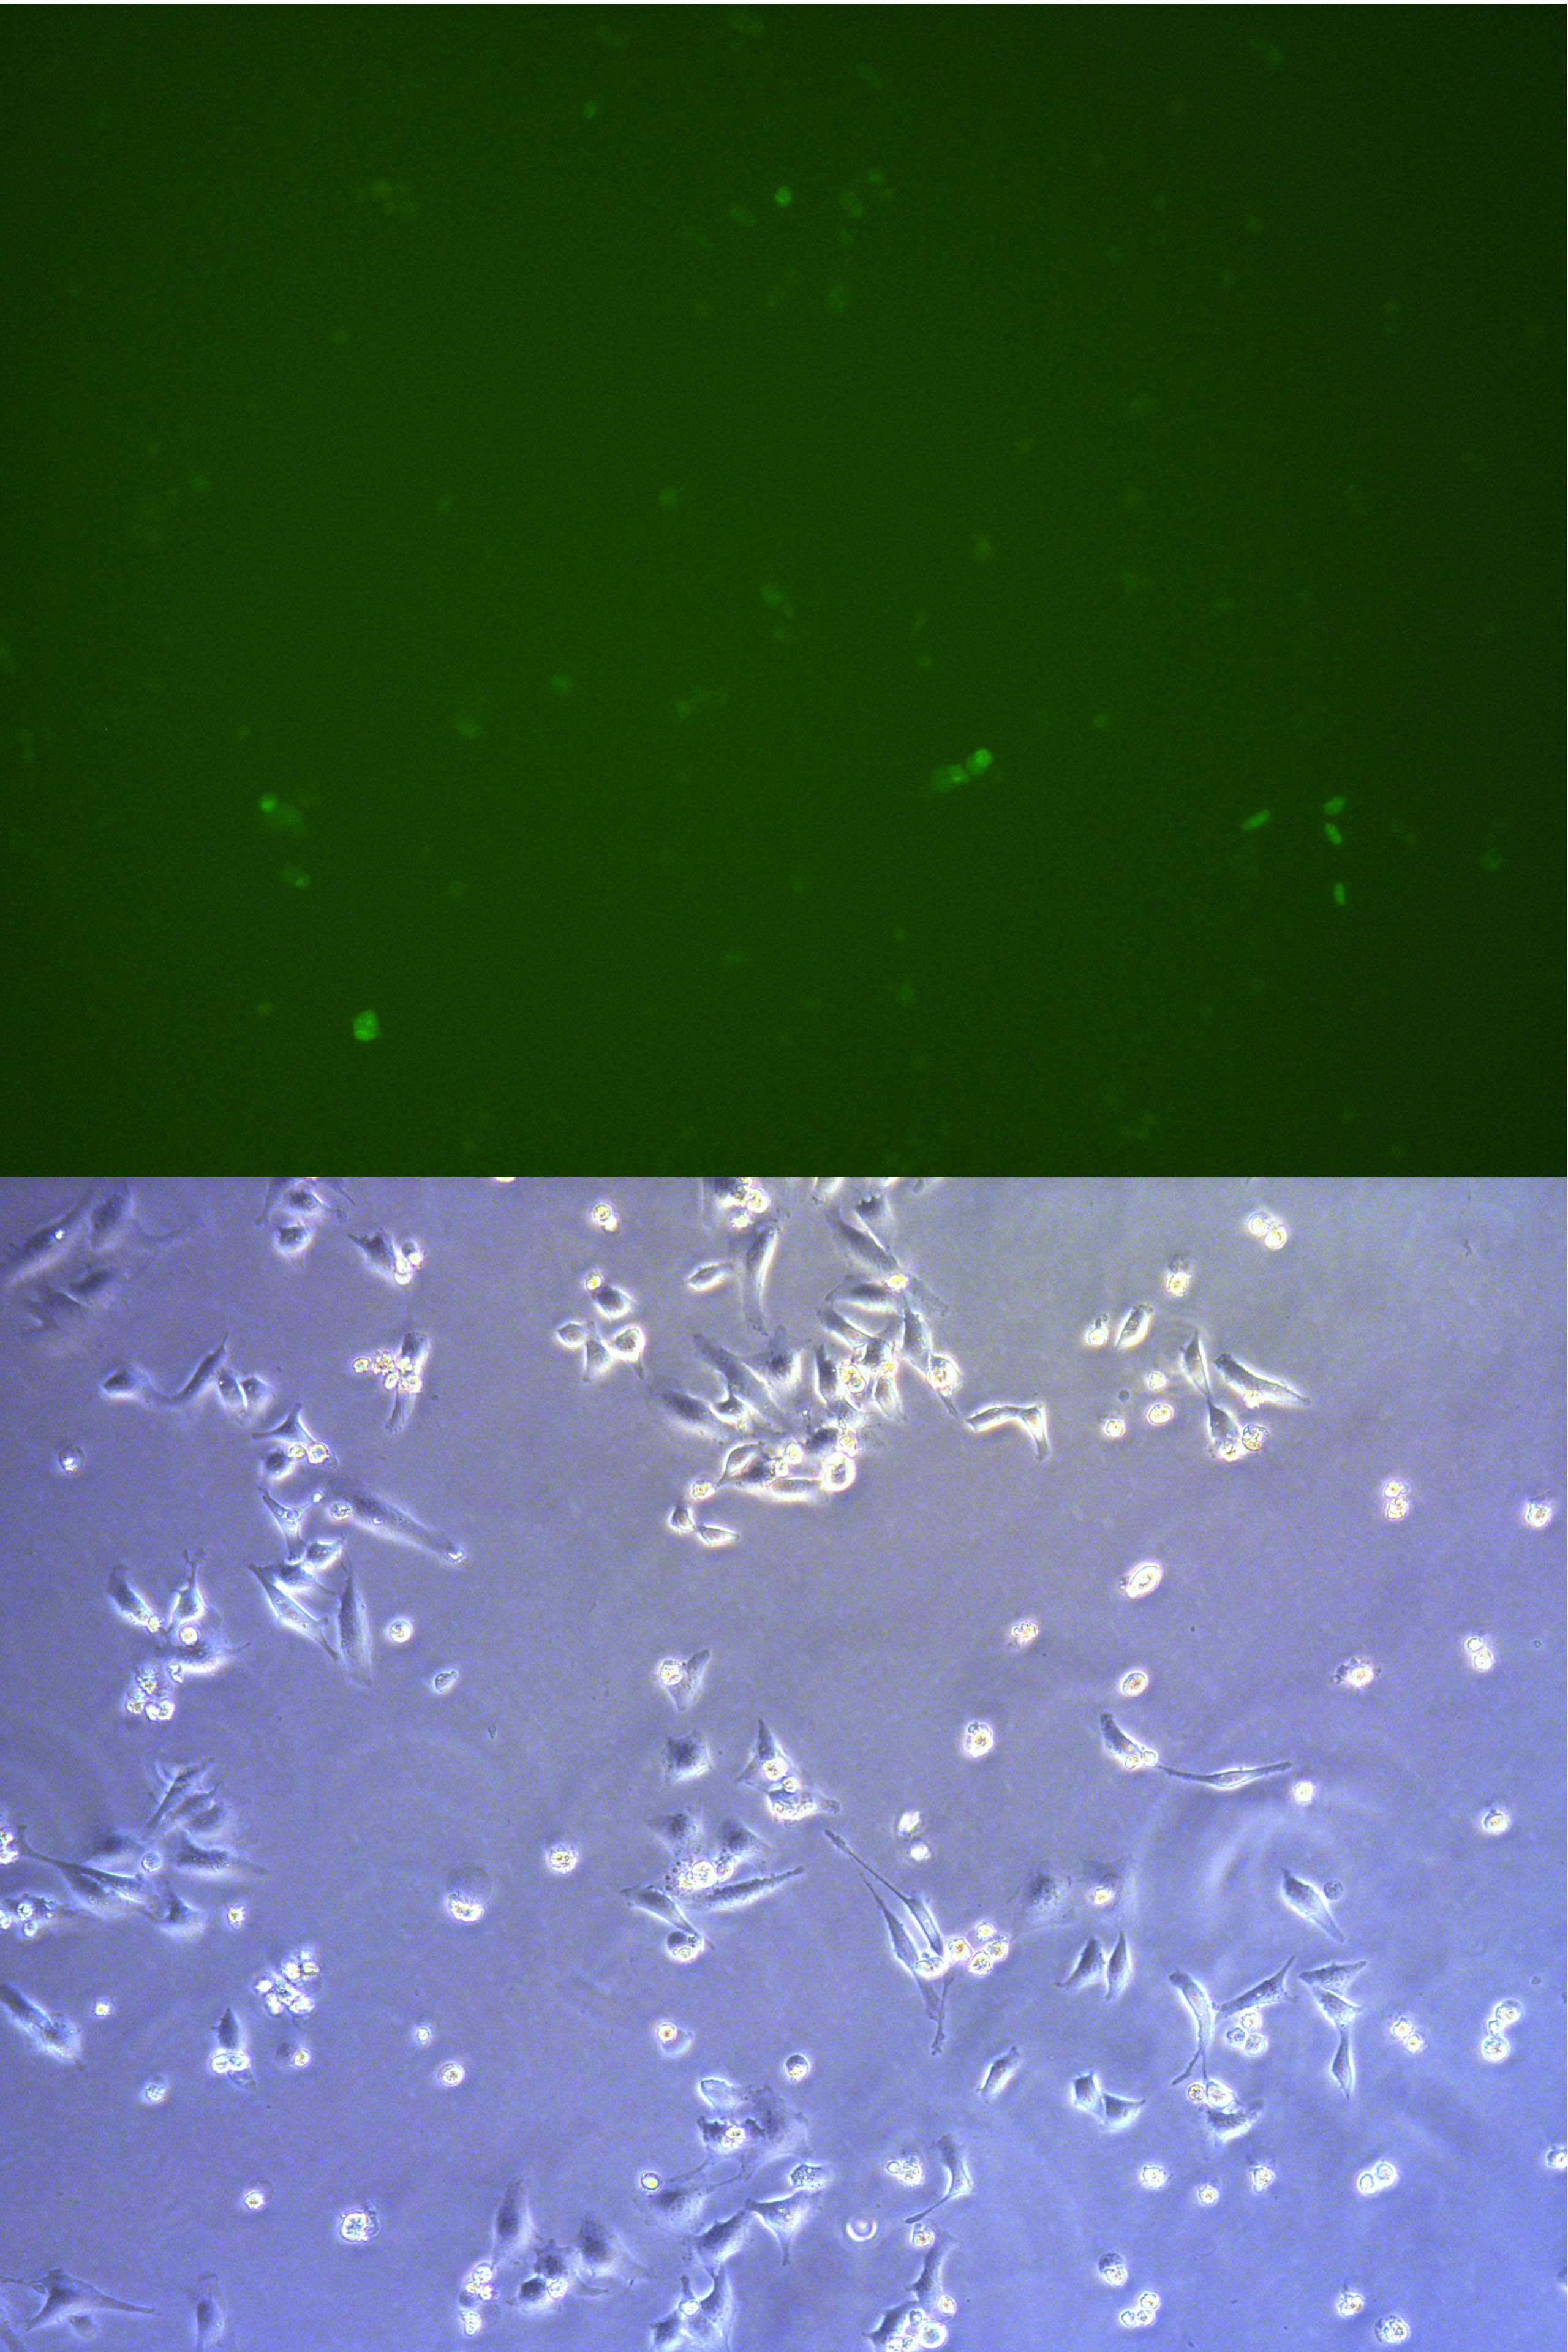
Figure . The fluorescent picture of G1 captured by microscope. of Cells has been passage to dish so the concentration is low. The rate of transefaction is pretty high, because the usage of pBx-083 expressing EGFP is high.
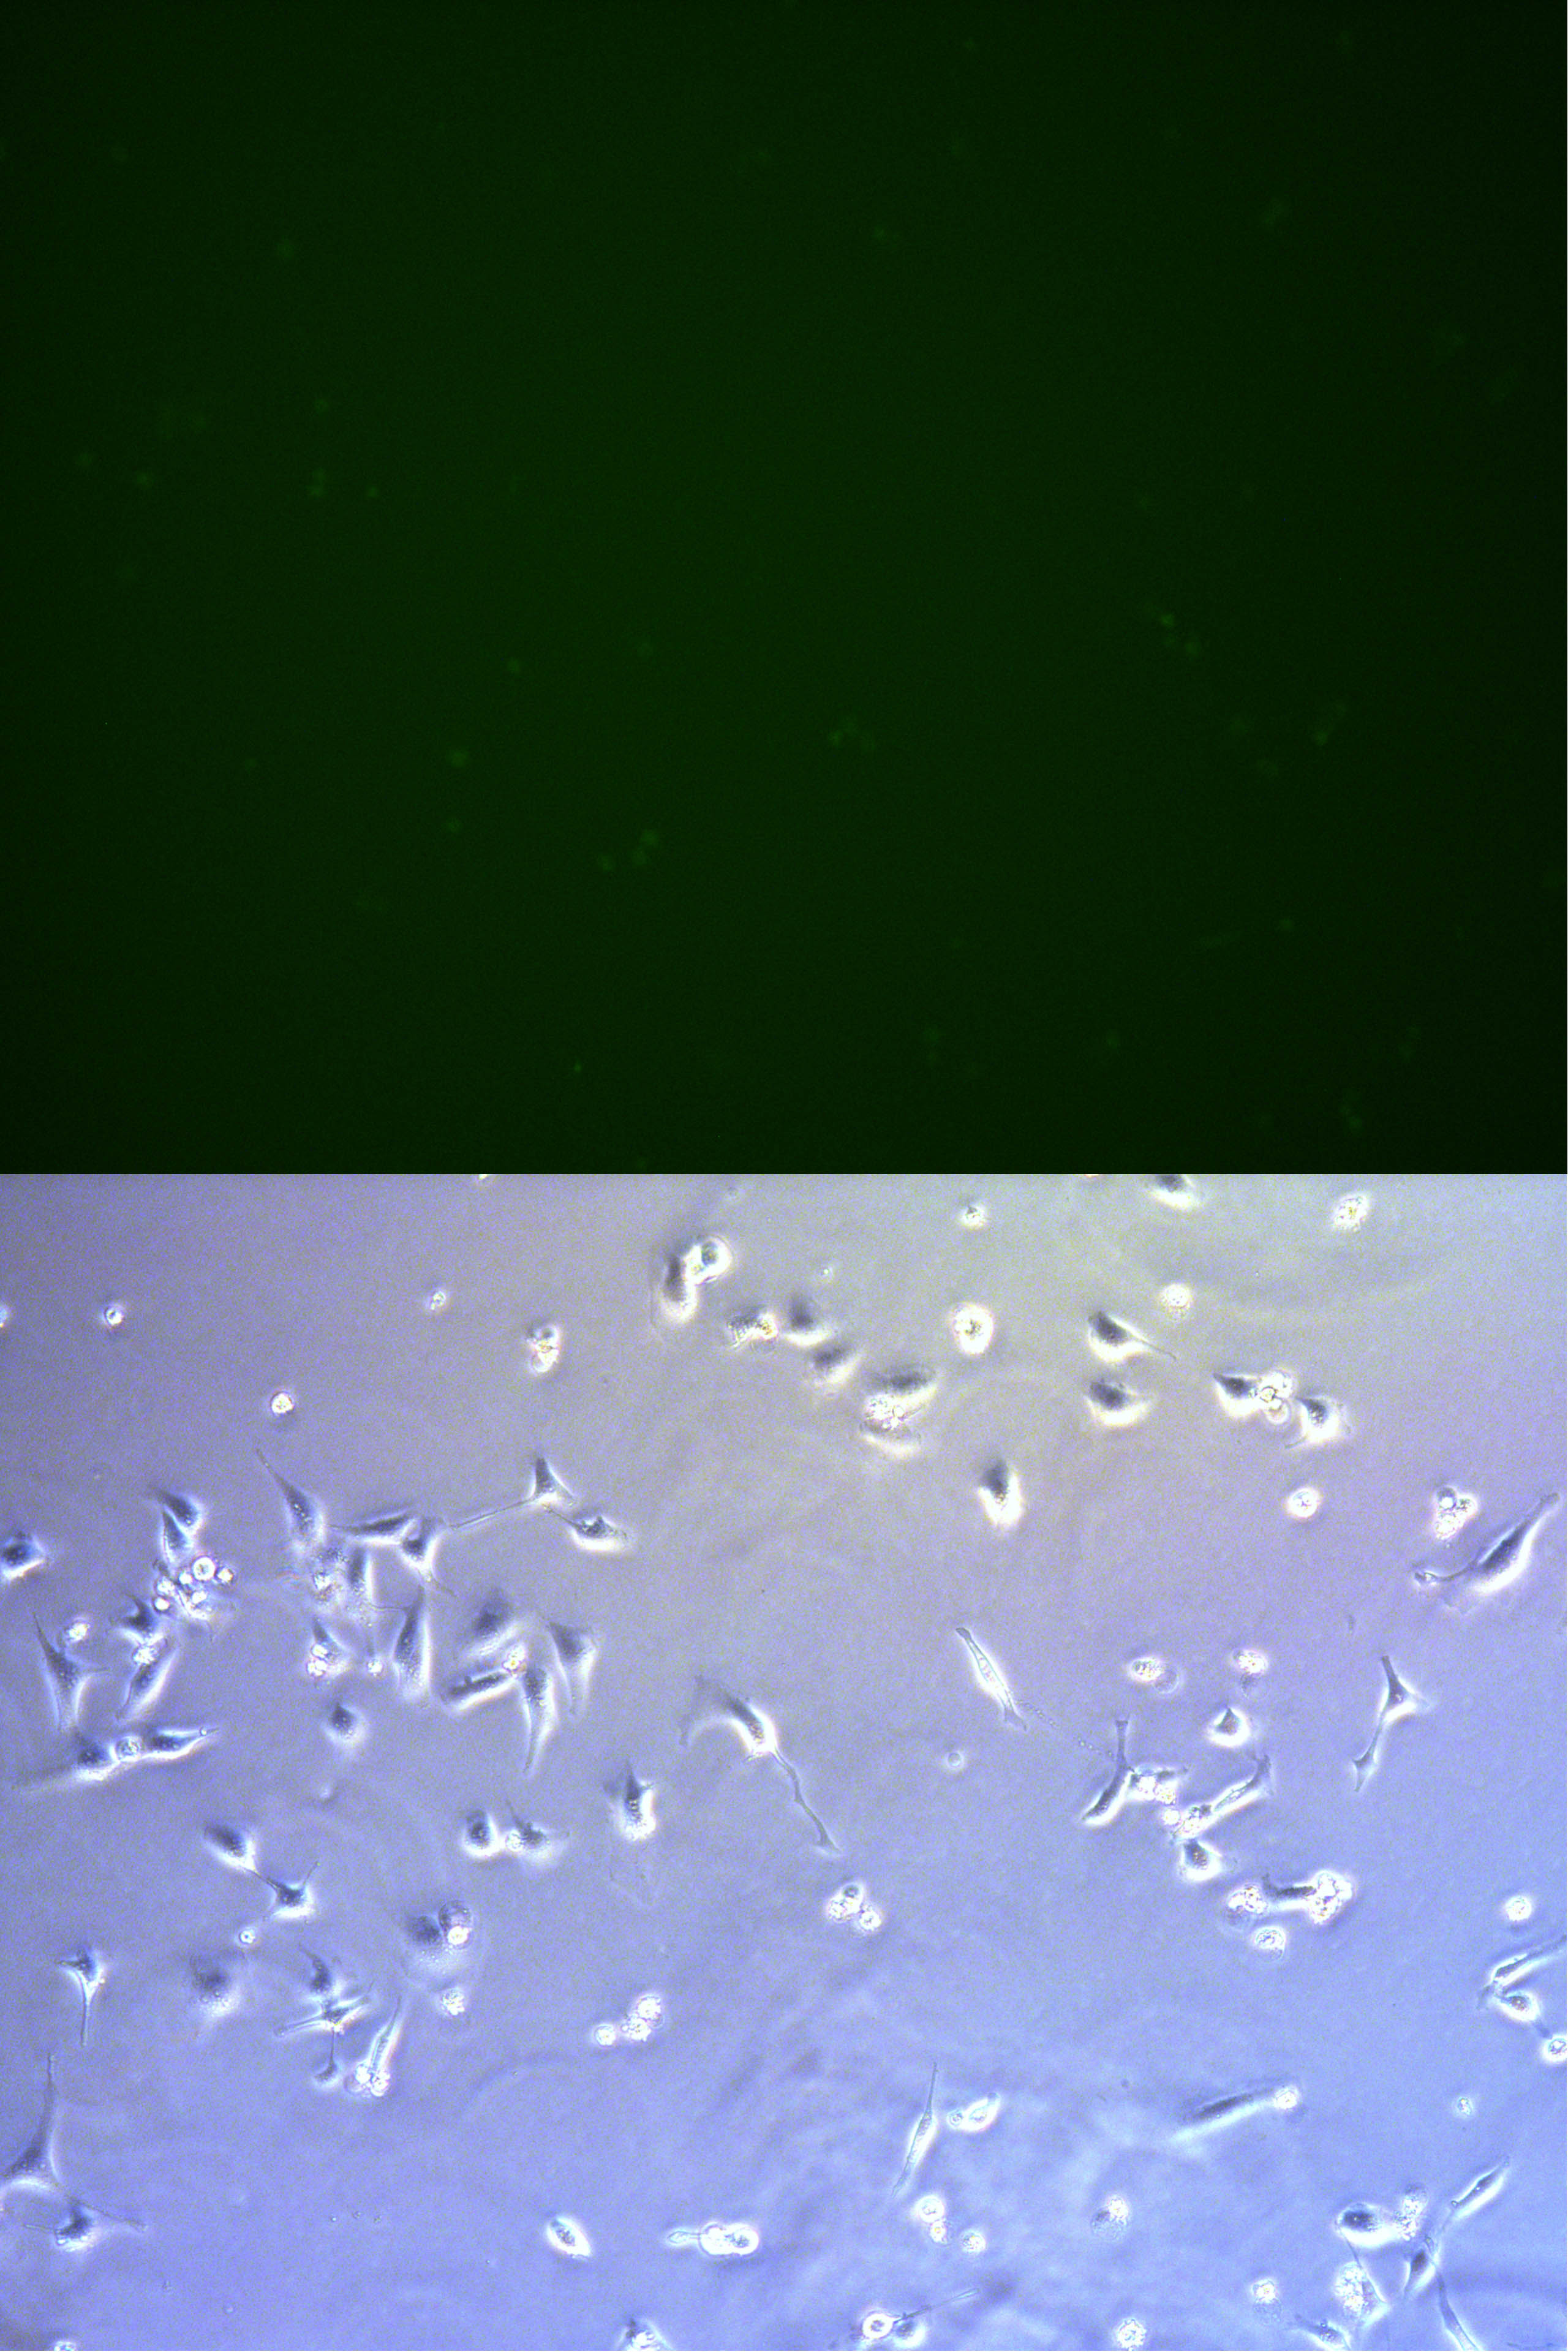
Figure 2. The fluorescent picture of G2. Rate of fluorescent and intensity is much lower comparing with G1.

Figure 3. The fluorescent picture of G3. G3 has transfected with plasmid expressing Cas9 protein and GFP.About 1/3-1/5 cells has been killed.

Figure 4. The fluorescent picture of G4. Same composition of plasmid as G3, but with lower usage of plasmid pBx-083 lower rate of transfection and lower intensity of fluorescencs.
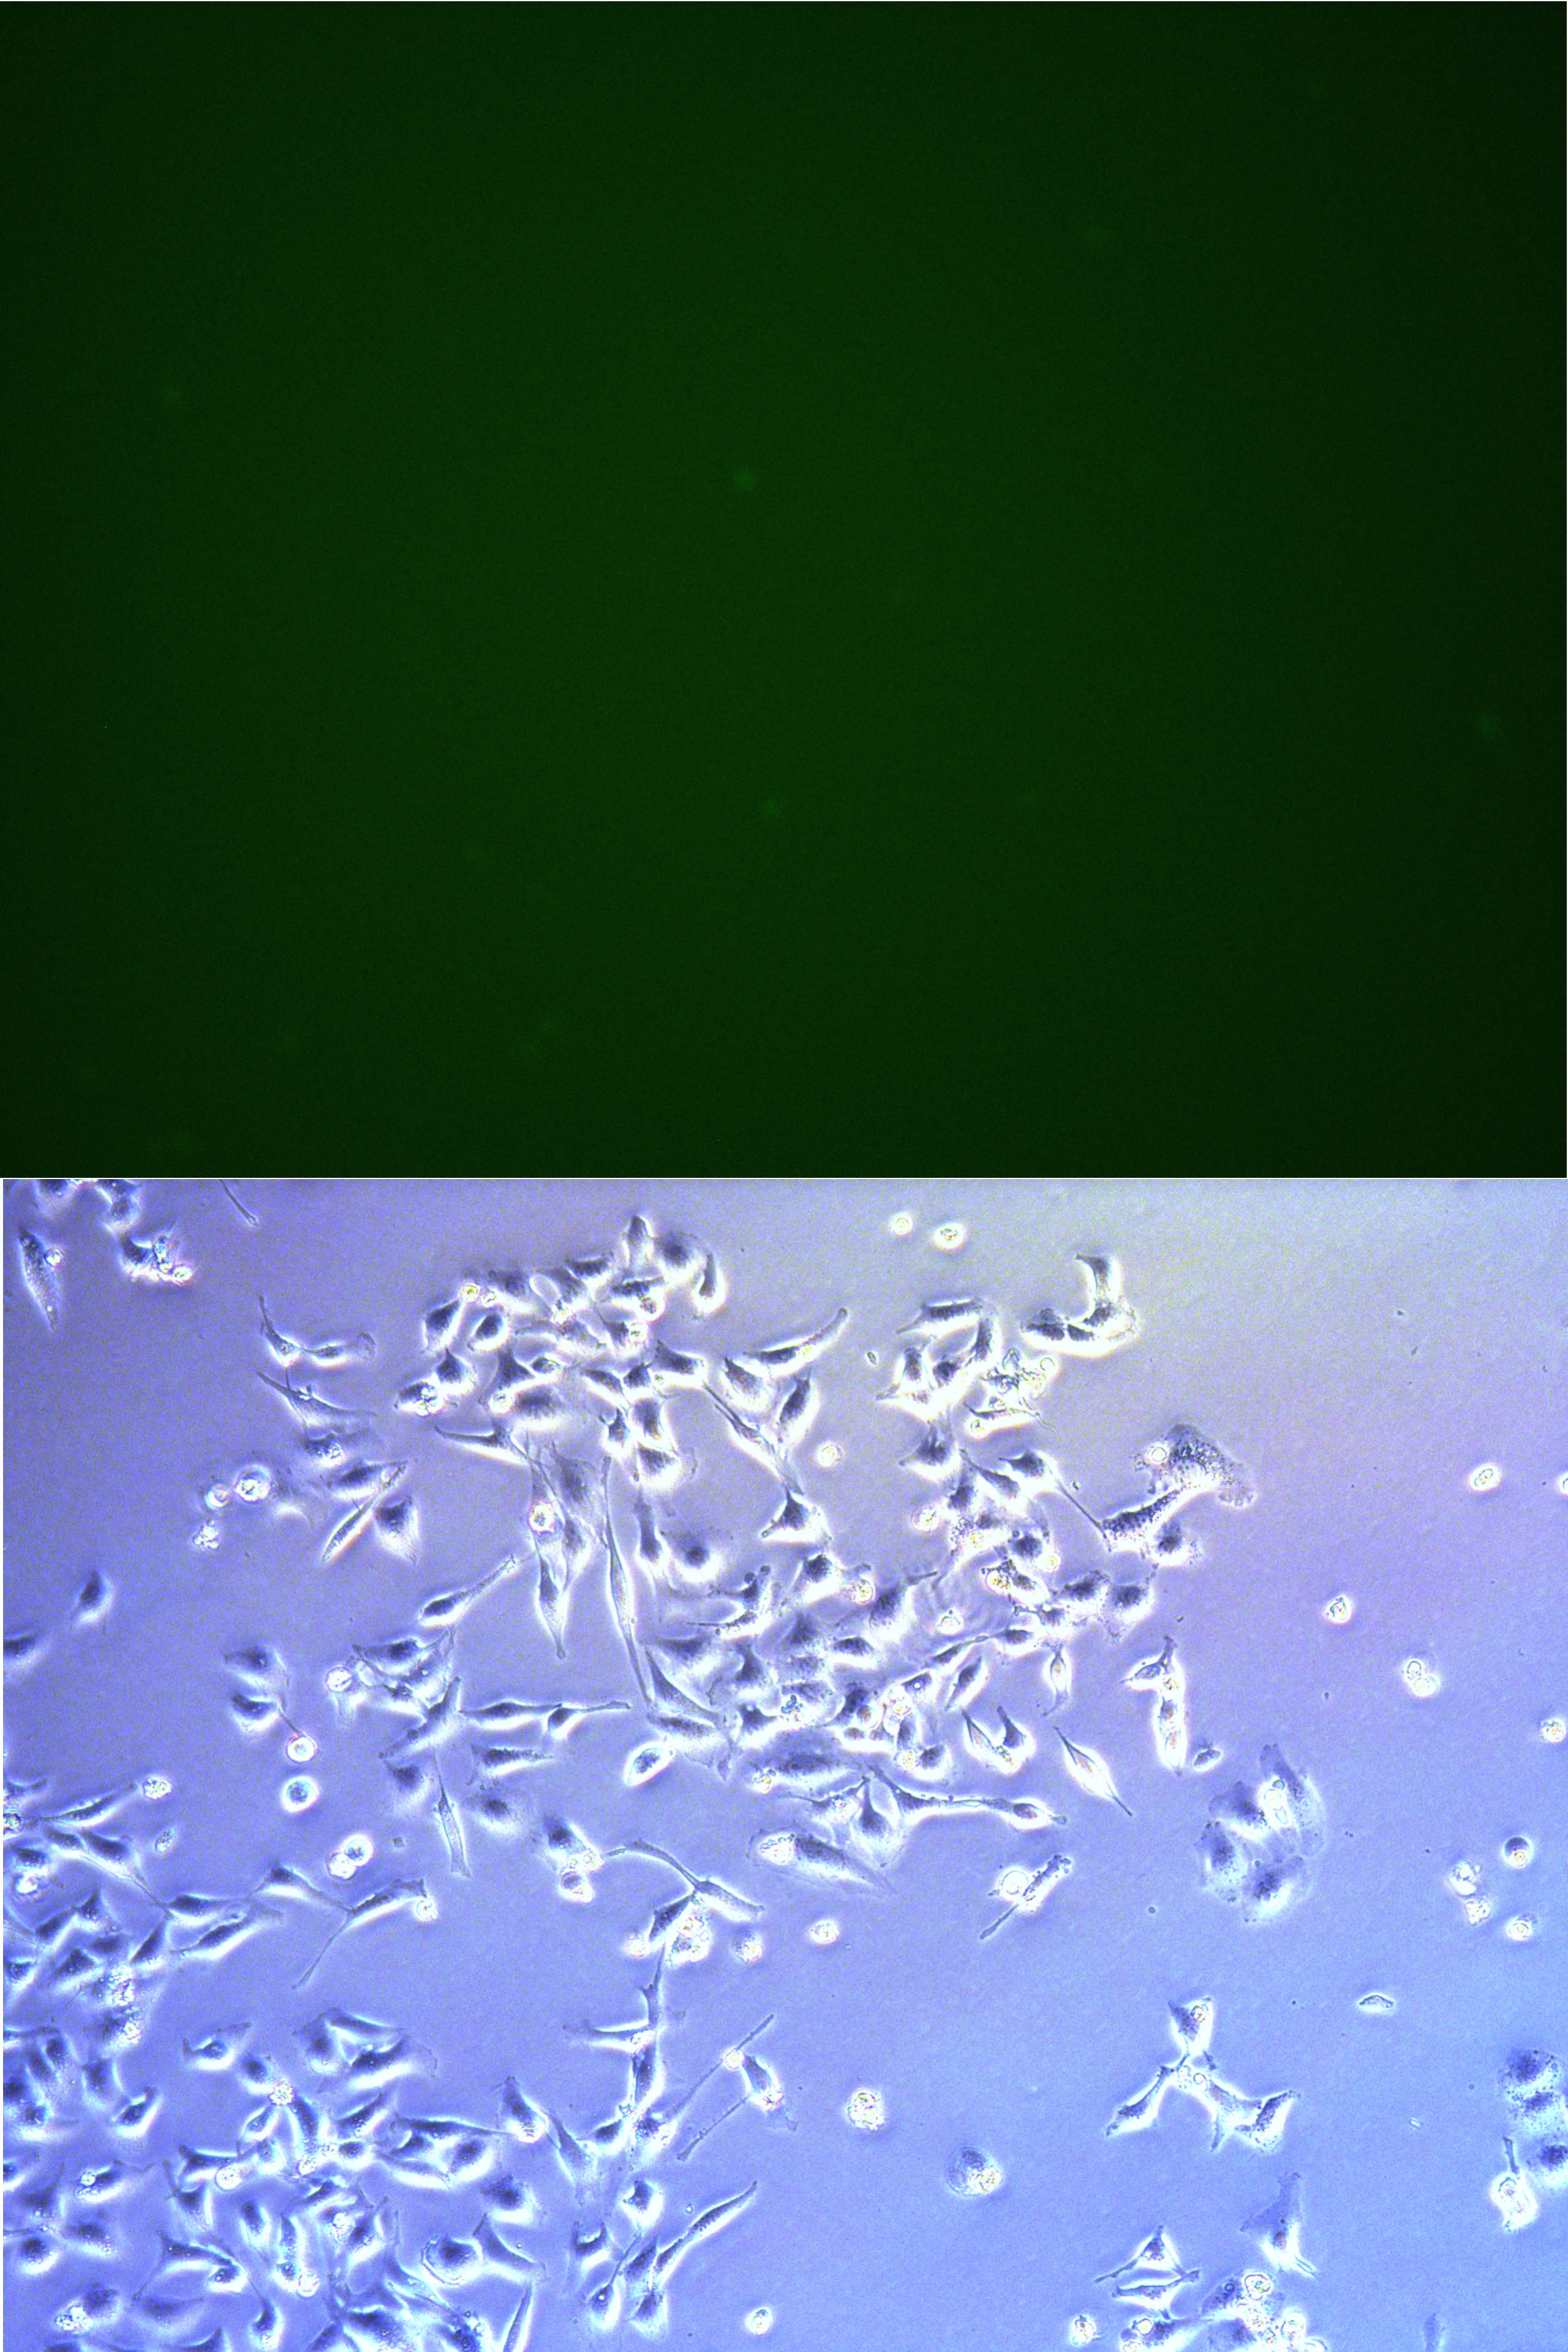
Figure 5. The fluorescent picture of G5. No green fluorescence on living cells, only some dead cells with auto-fluorescence.
[2014 Aug 18th 15:00pm]
The third day after transfection
And observe the transfected cells on petri dish with 50,000 cells under fluorescence microscope. For group 1 and 3 some living cells with fluorescence can be observed but for group 2&4, it is hard to find fluorescence.
Aug 19th
The forth day after transfection
Passage cells
[2014 Aug 19th 00:00am]
Passage cells of every Groups from wells to petri dishes. Use antibiotics to kill cells without resistance. Only those with resistance can survive, can express gene we transform both resistance gene and gene we need.
Cells left after passage to the petri dish for monoclones are passage to another petri dish to construct a pool of all kinds of cells expressing resistance.But less stable and less homogeneous than monoclones.
Procedures
- Wash cells with PBS for 2 times
- Add trypsin 1ml and discard to digest for 2min at 37°C.
- Add complete medium 2ml to end digestion, suspend cells.
- Passage cell suspension to 10cm petri dish, and 5ml complete medium mix well with pipet. Mark the dish.
Cell selection
[2014 Aug 19th 16:00pm]
The forth day after transfection
The first day selection
Start the screening of the transfected cells on the plate with corresponding antibiotics.
Start the selection and screening of the transfected cells on one petri dish with 50,000 cells with corresponding antibiotics.
| Group | Blasticidin(μg/mL) | Puromycin(μg/mL) |
|---|---|---|
| 1&2 | 2.8 | 0 |
| 3&4 | 2.8 | 2 |
| 5 | 0 | 2 |
Aug 20th
The fifth day after transfection The second day selection
Fluorescent Observation
[2014 Aug 20th 18:00pm]
Observe the cells on the petri dish with fluorescence microscope. It is easy to find many living with green fluorescence in the pate, and the fluorescence of groups 1&3 is stronger than that of groups 2&4 moreover group 1&3 have much more cells with fluorescence than 2&4.
Green fluorenscence image and bright field image has been put together overlaying. Because overlay the fluorescent intensity on pictures does not represent the real fluorescent intensity. But can show the ratio of cells have fluorescence.
Pool cells
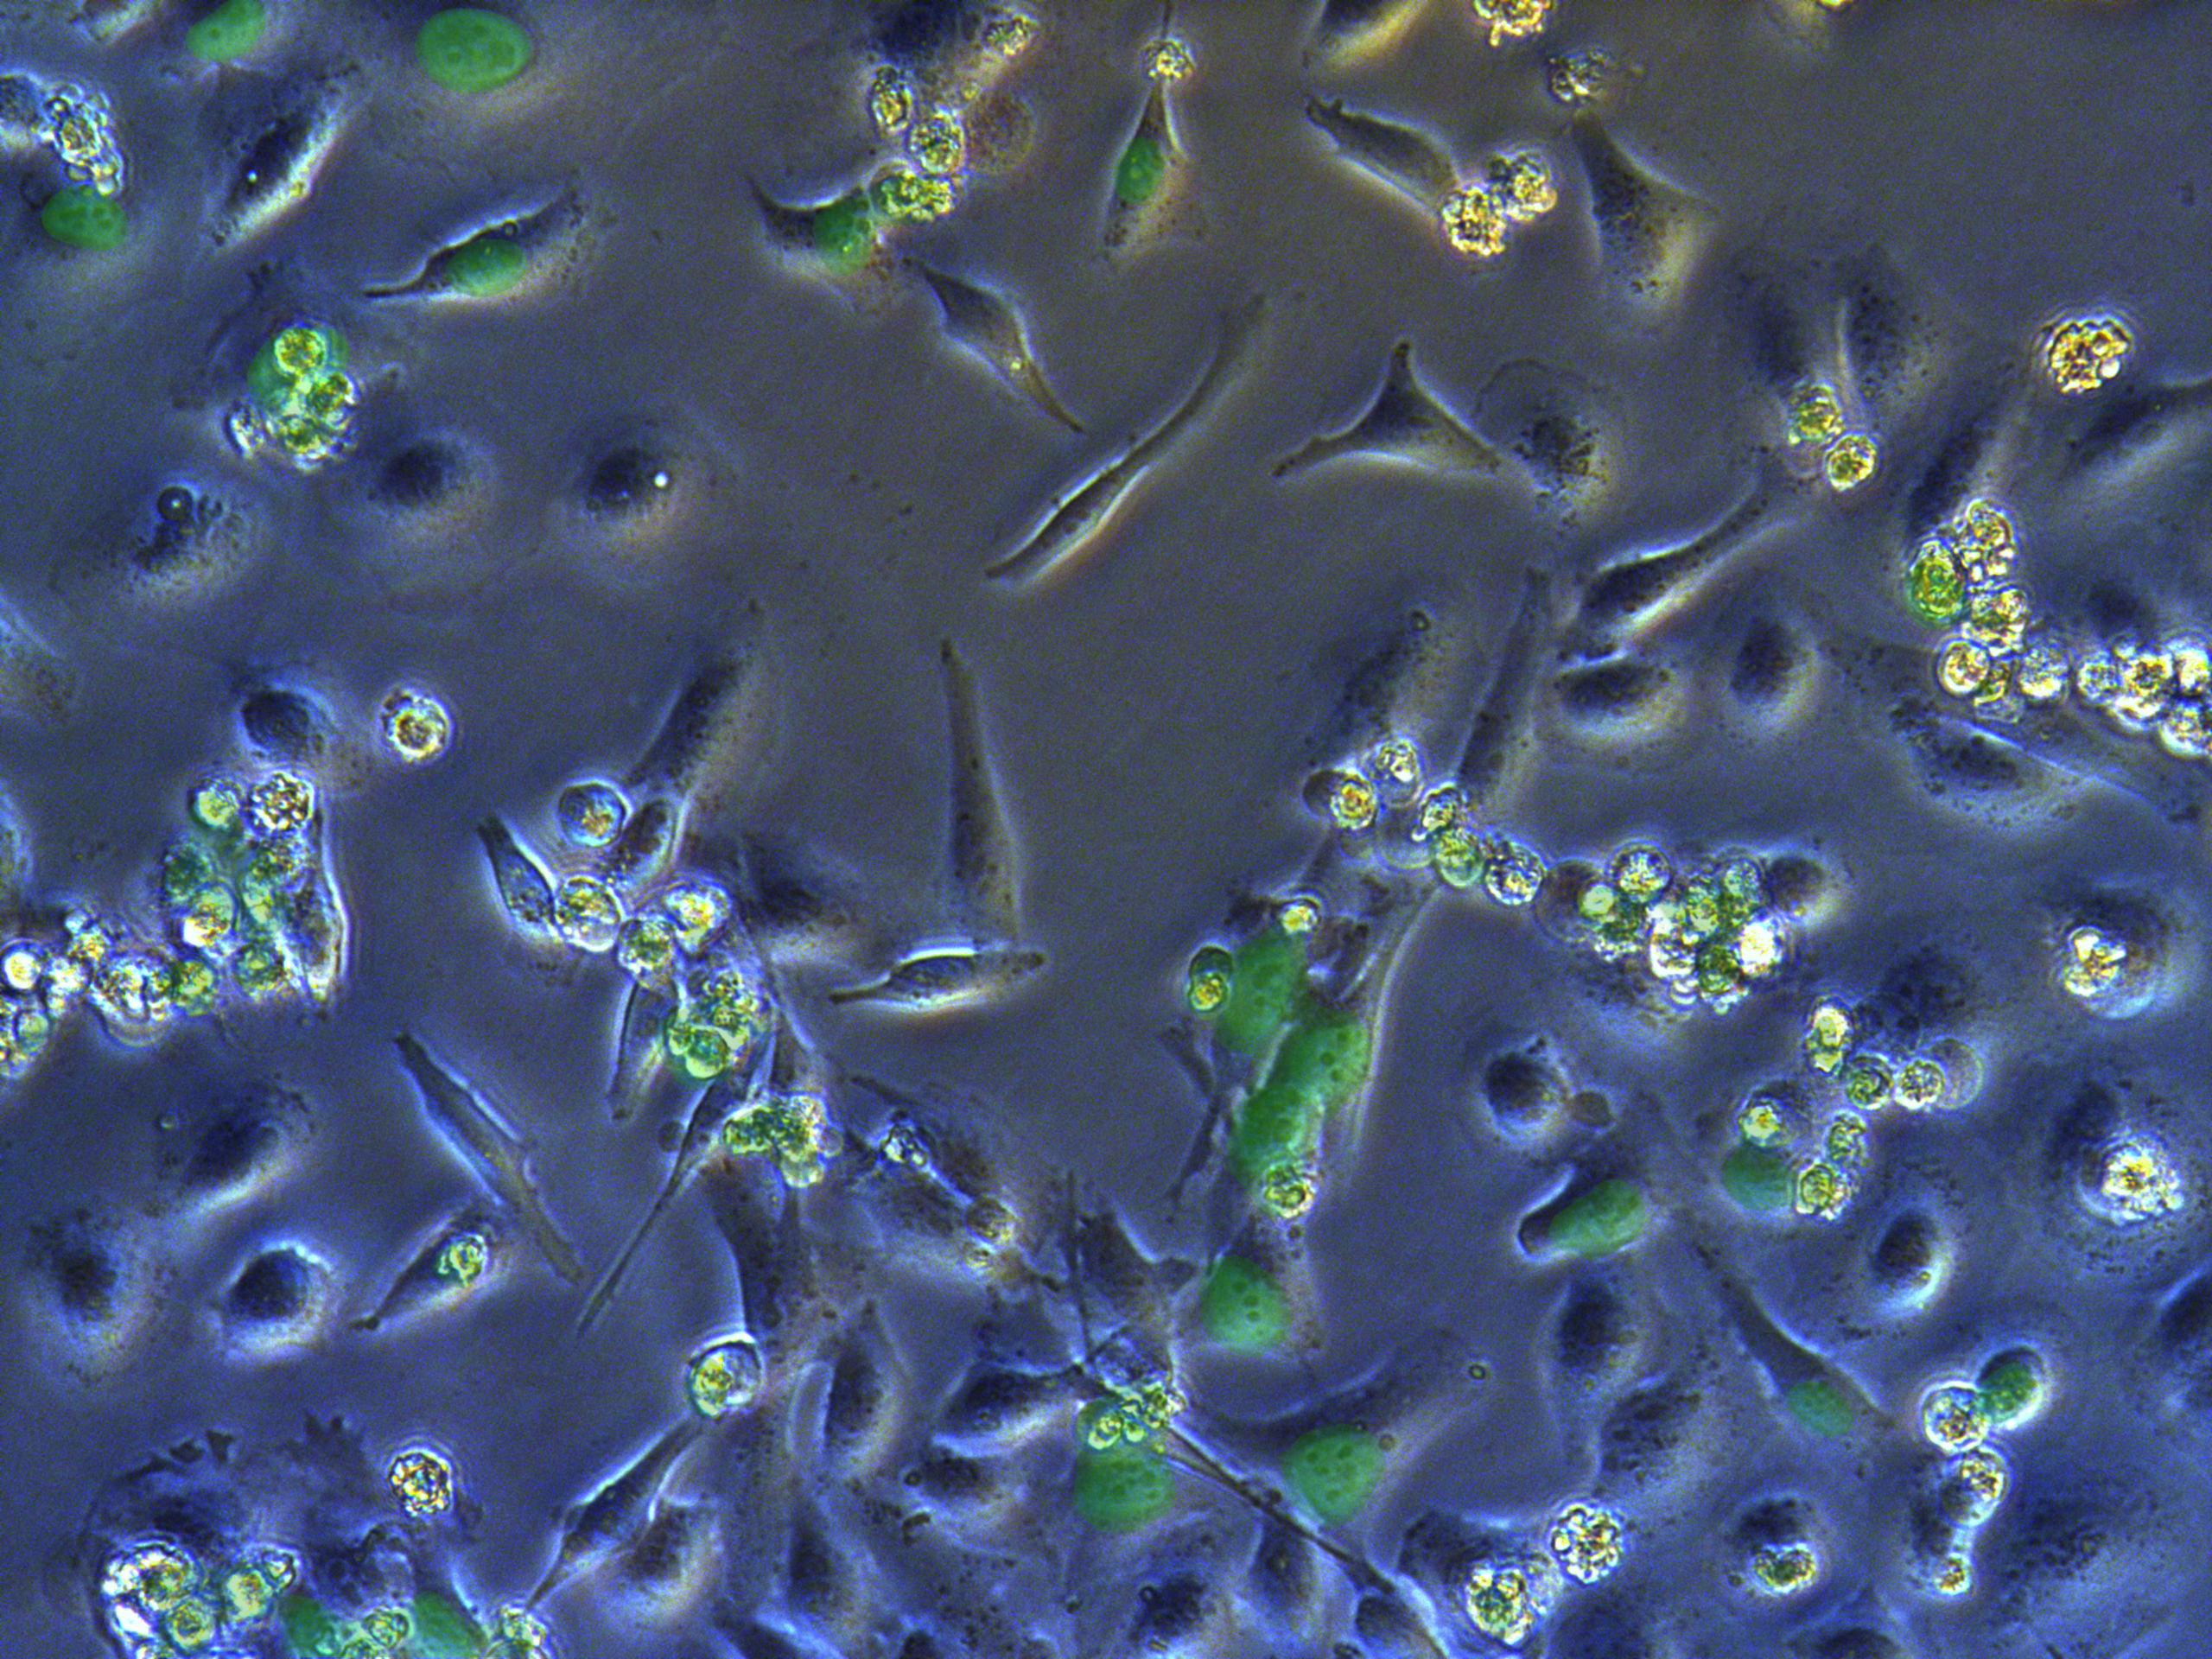
Figure 6. G1 pool cells on petri dish.
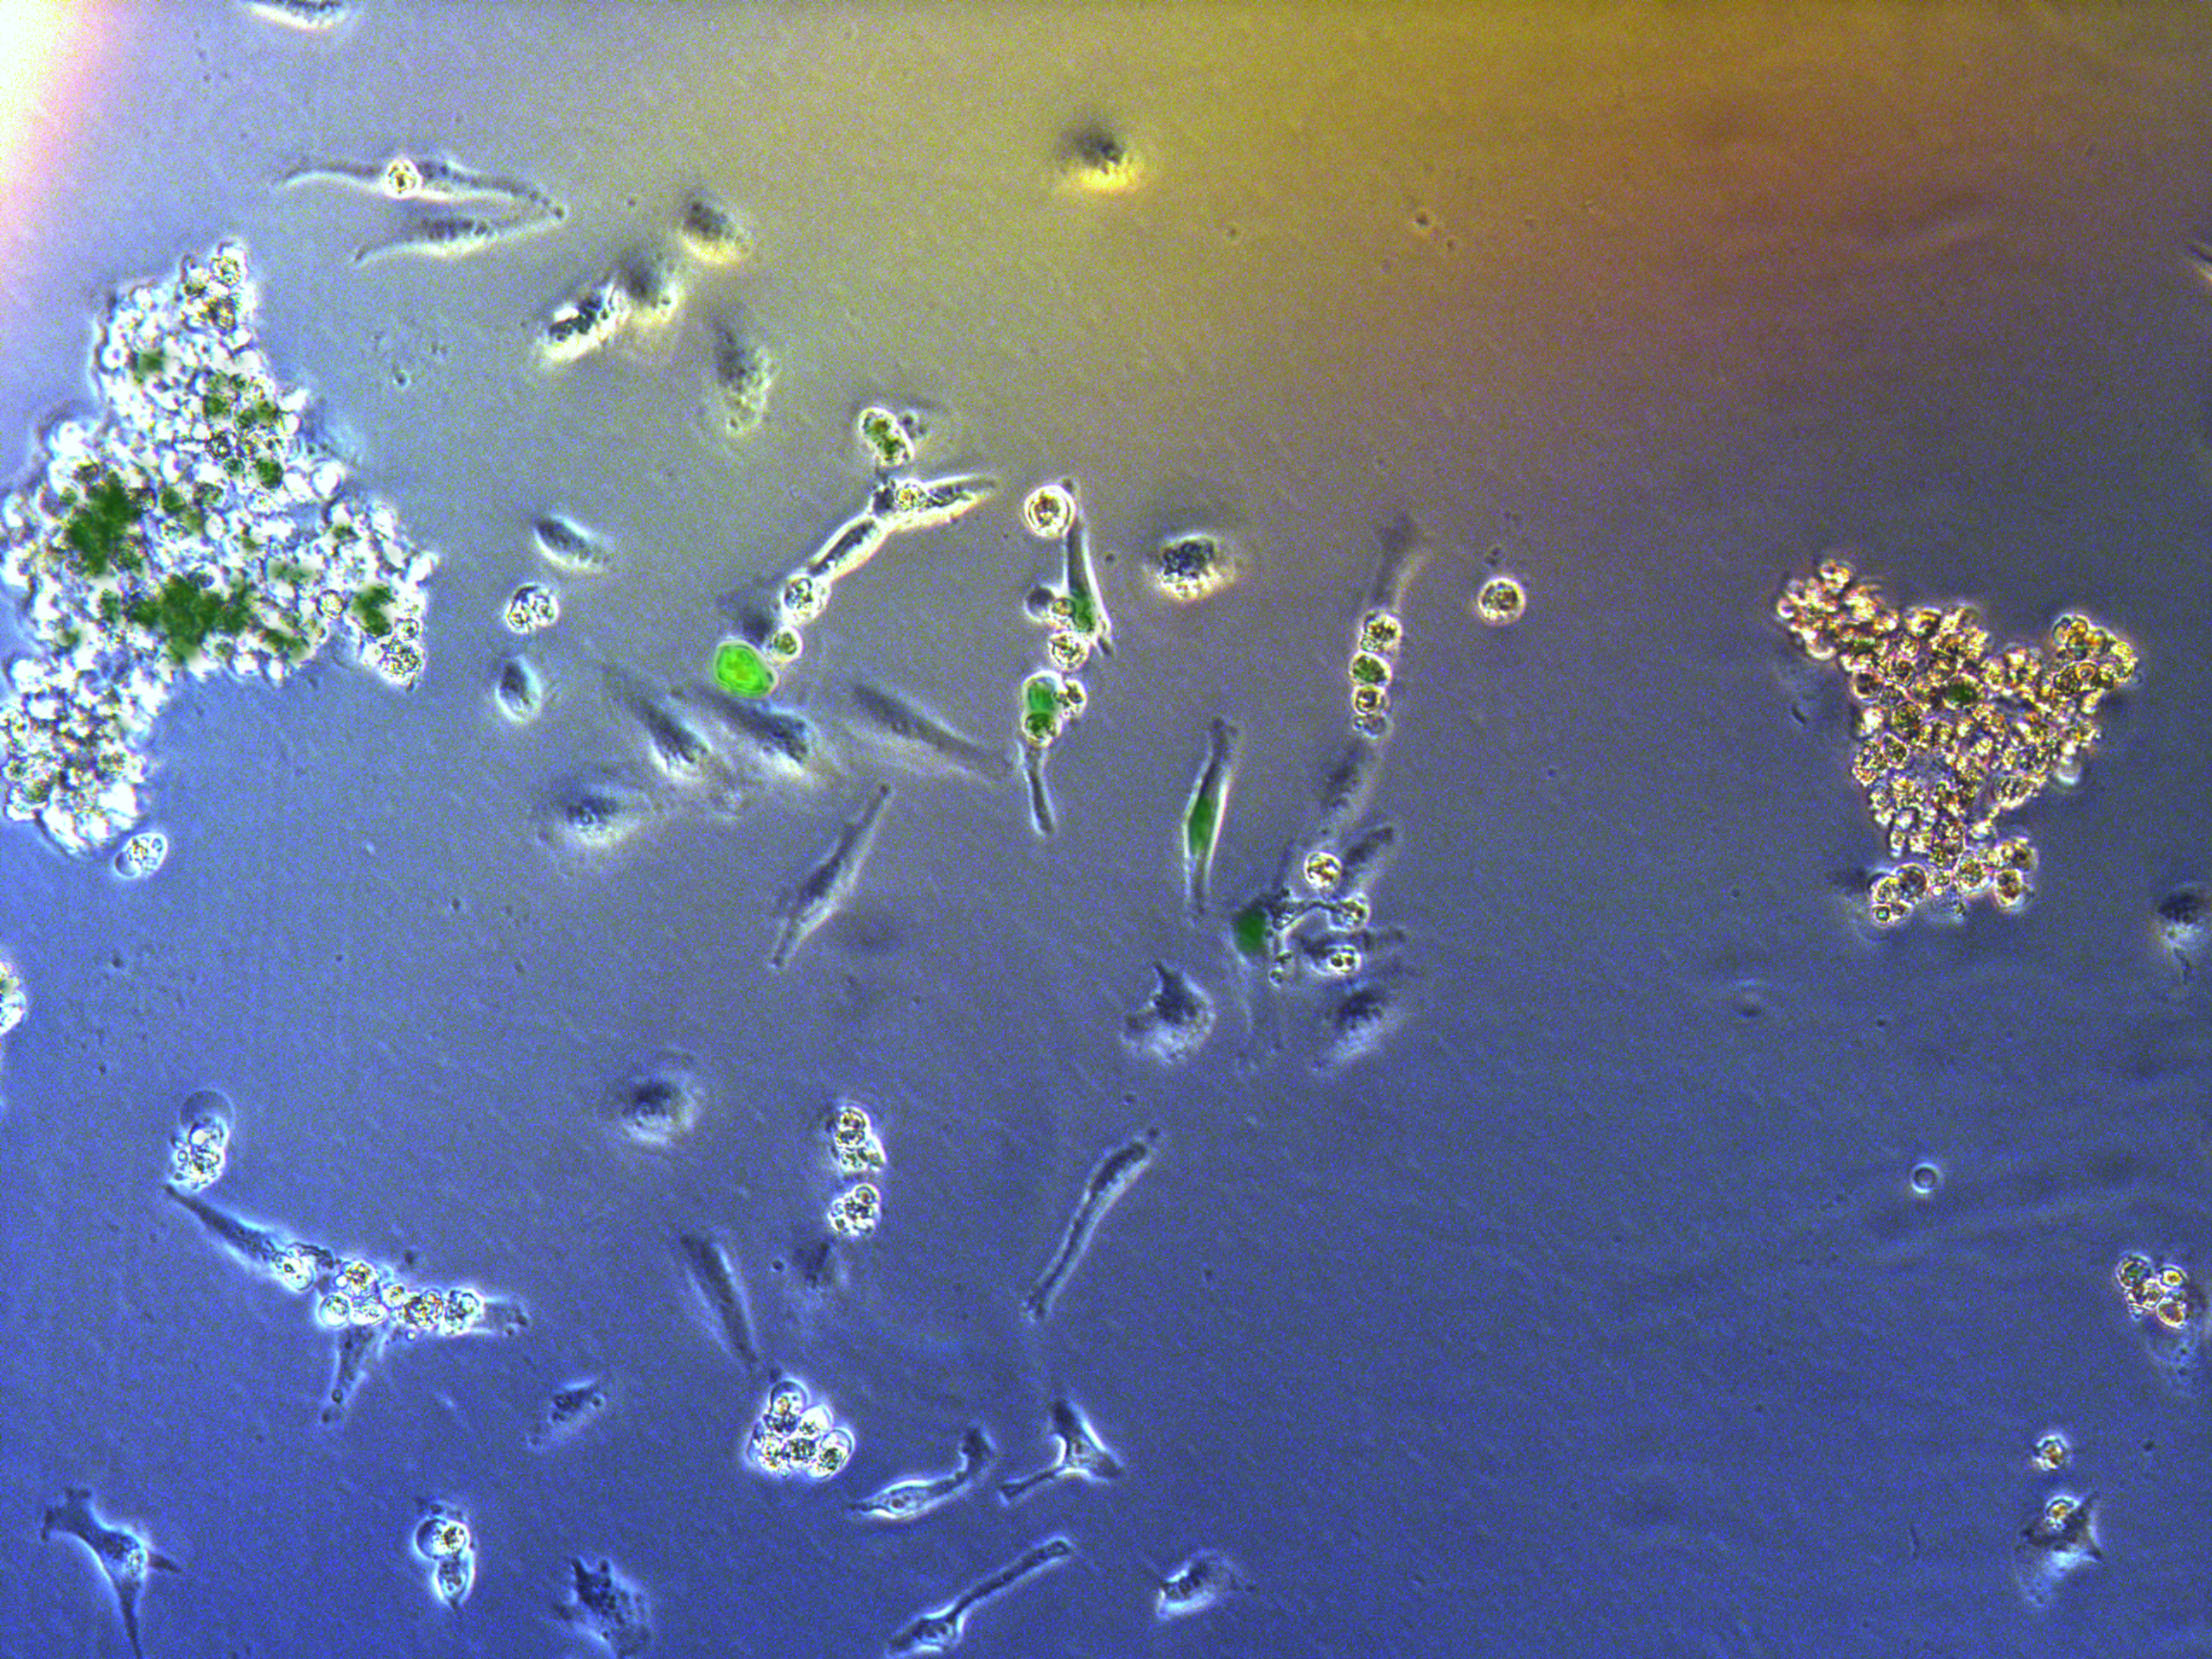
Figure 7. G2 pool cells on petri dish.

Figure 8. G3 pool cells on petri dish.

Figure 9. G4 pool cells on petri dish.
A considerable number of cells have been killed by antibiotcs. Those concentrated round cells in pictures are dead cells flouting in medium.
Monoclonal cells

Figure 10. Plate G1 seeded 50000 cells.
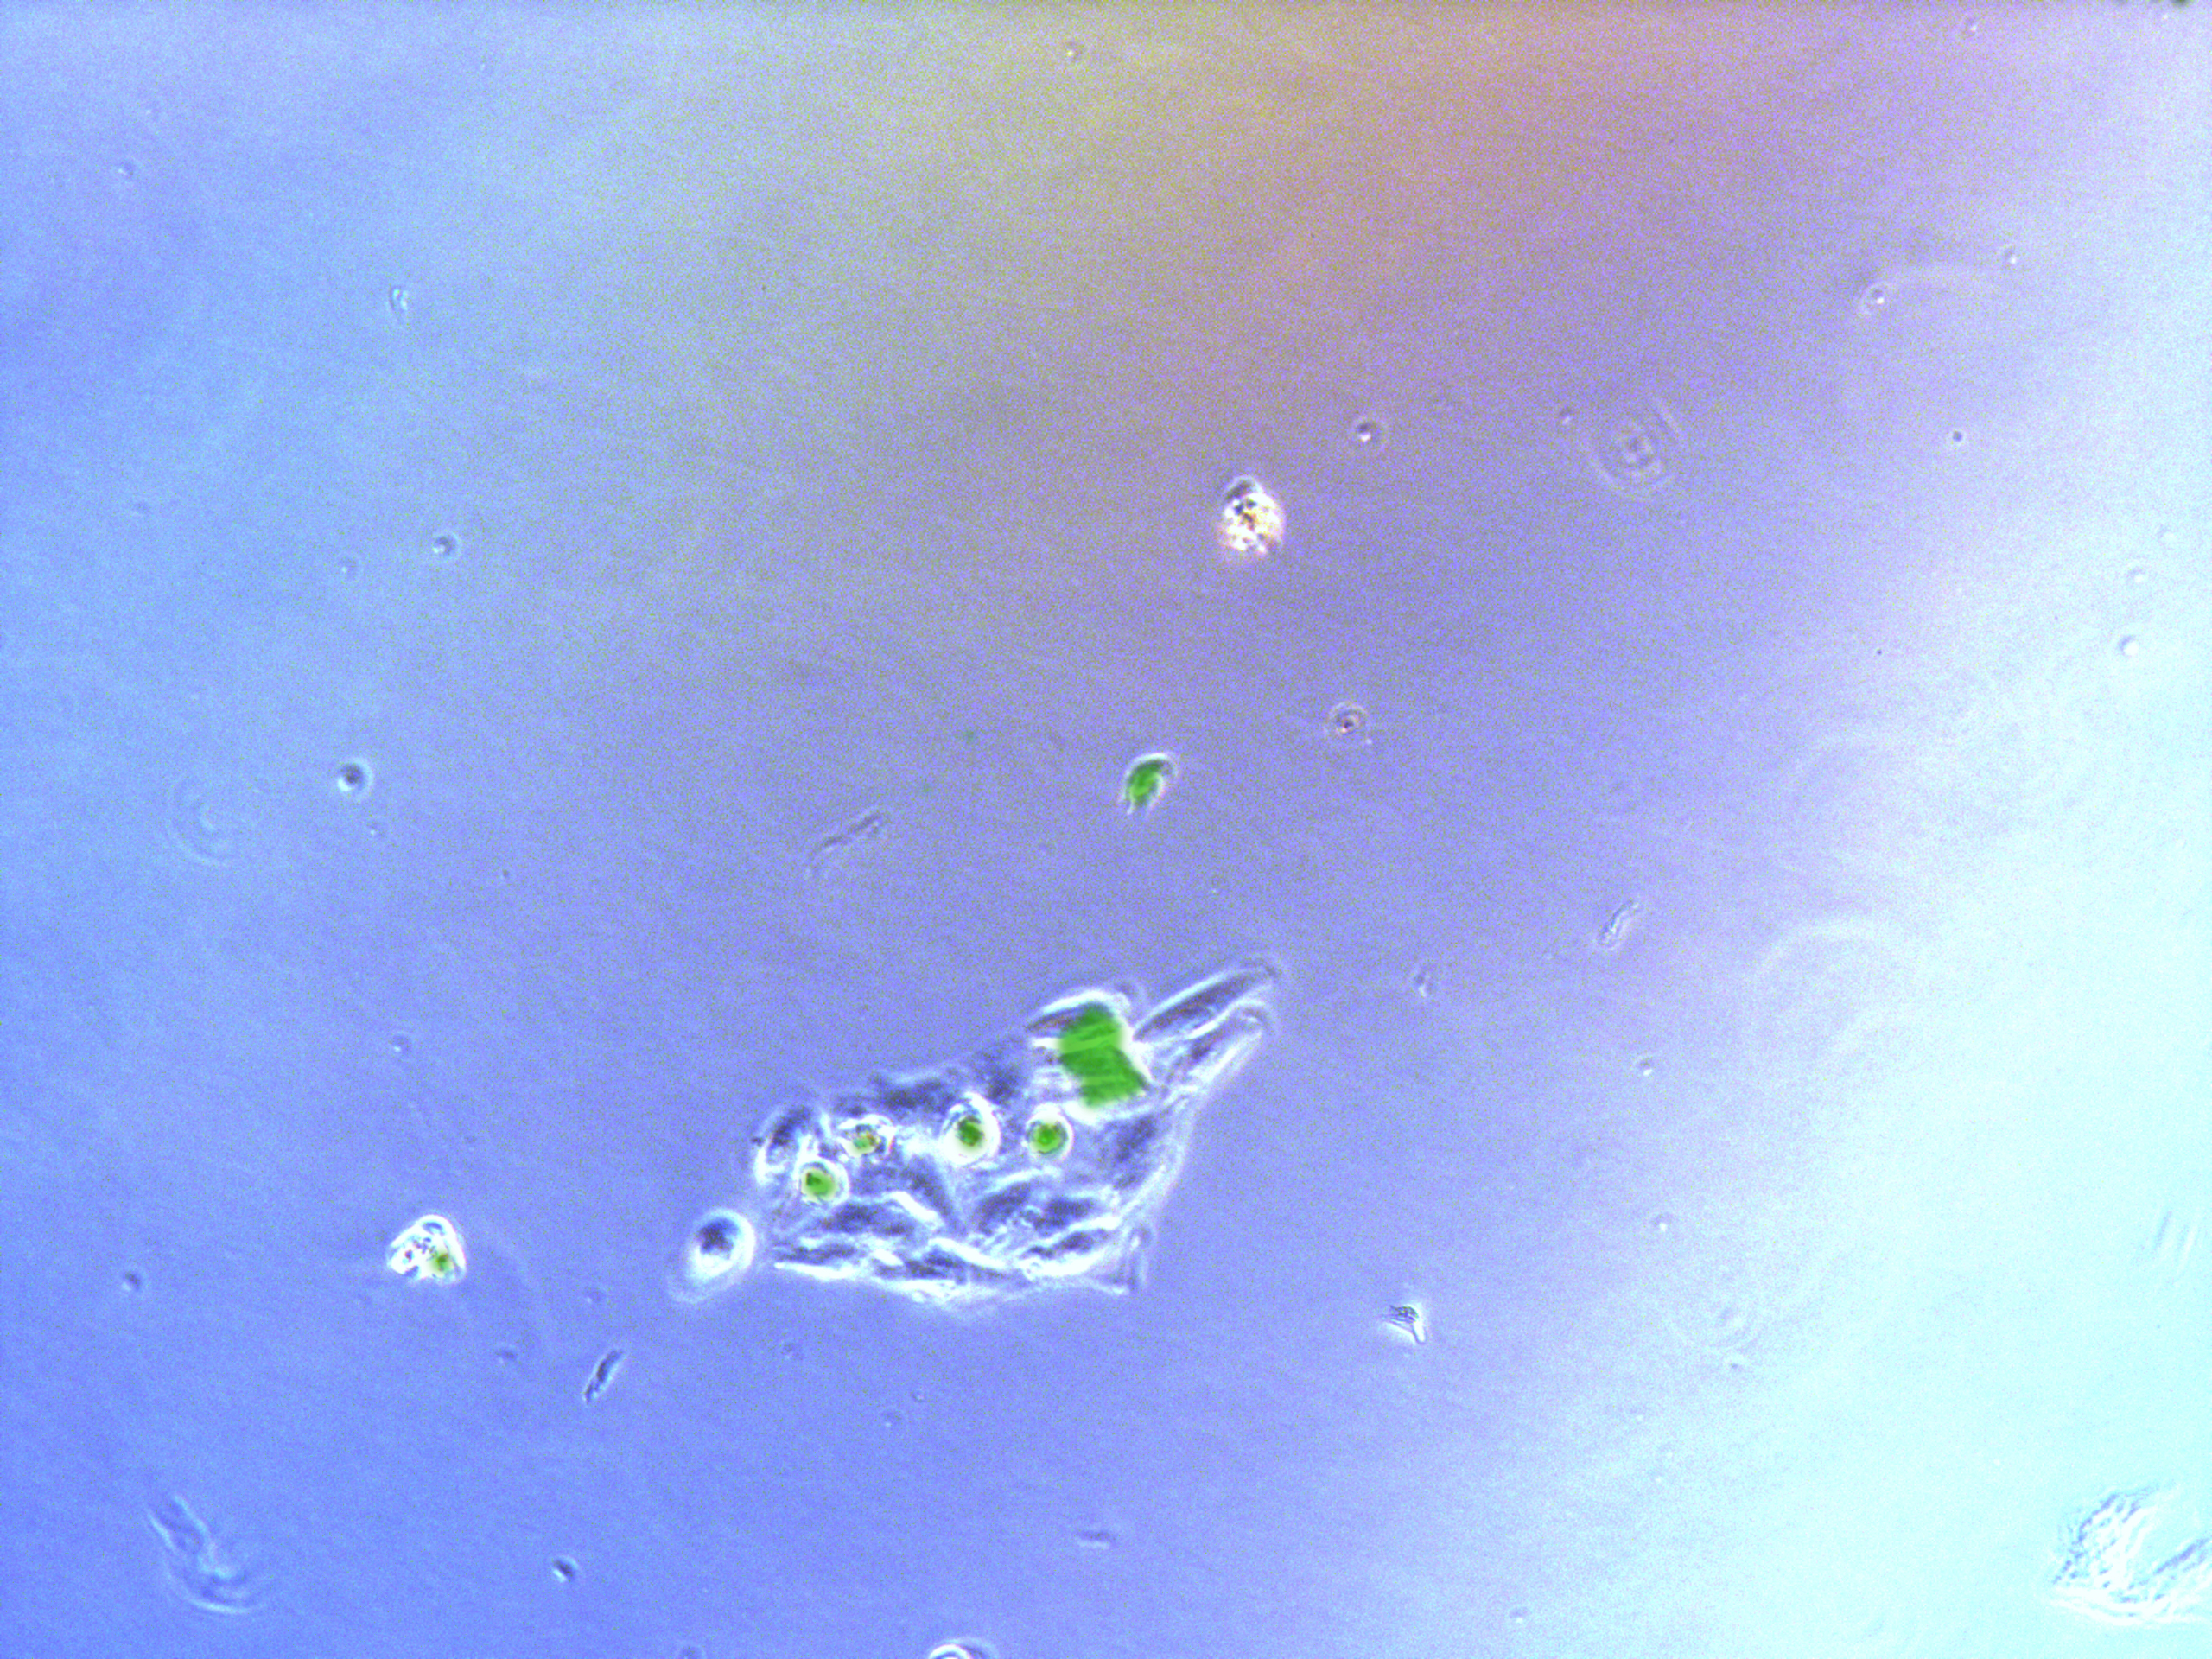
Figure 11. Plate G2 seeded 50000 cells.
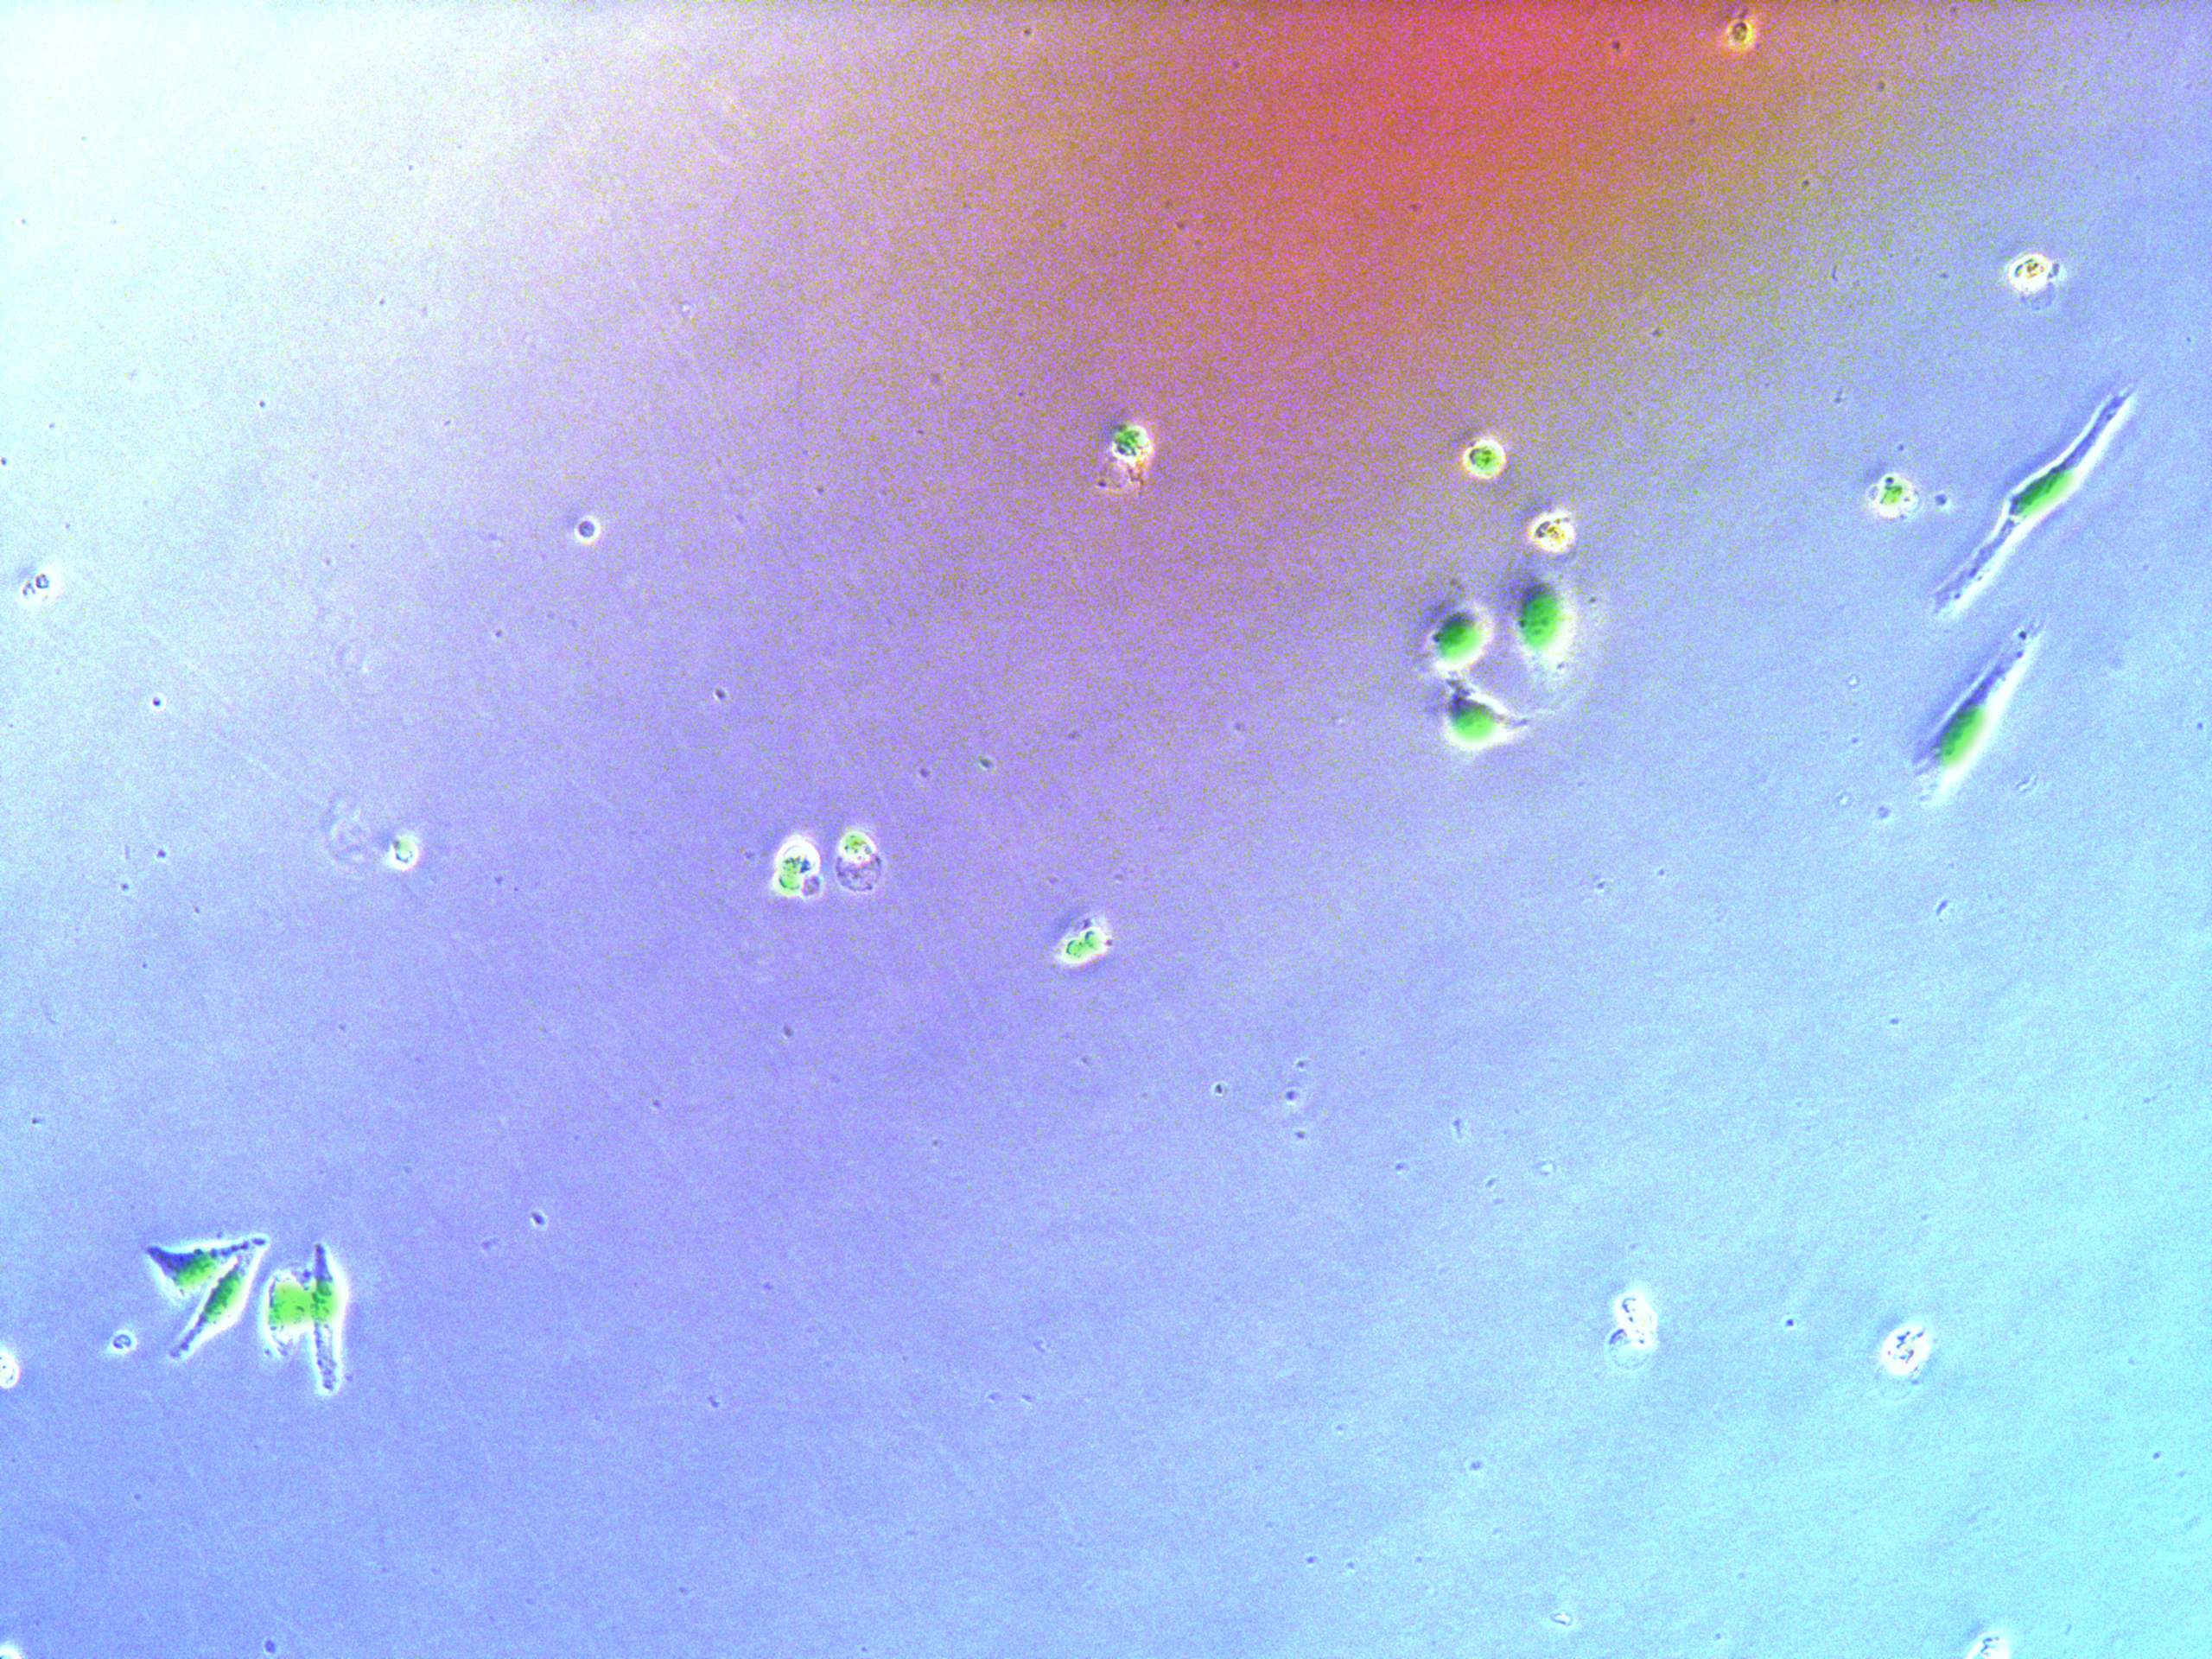
Figure 12. Plate G3 seeded 50000 cells.
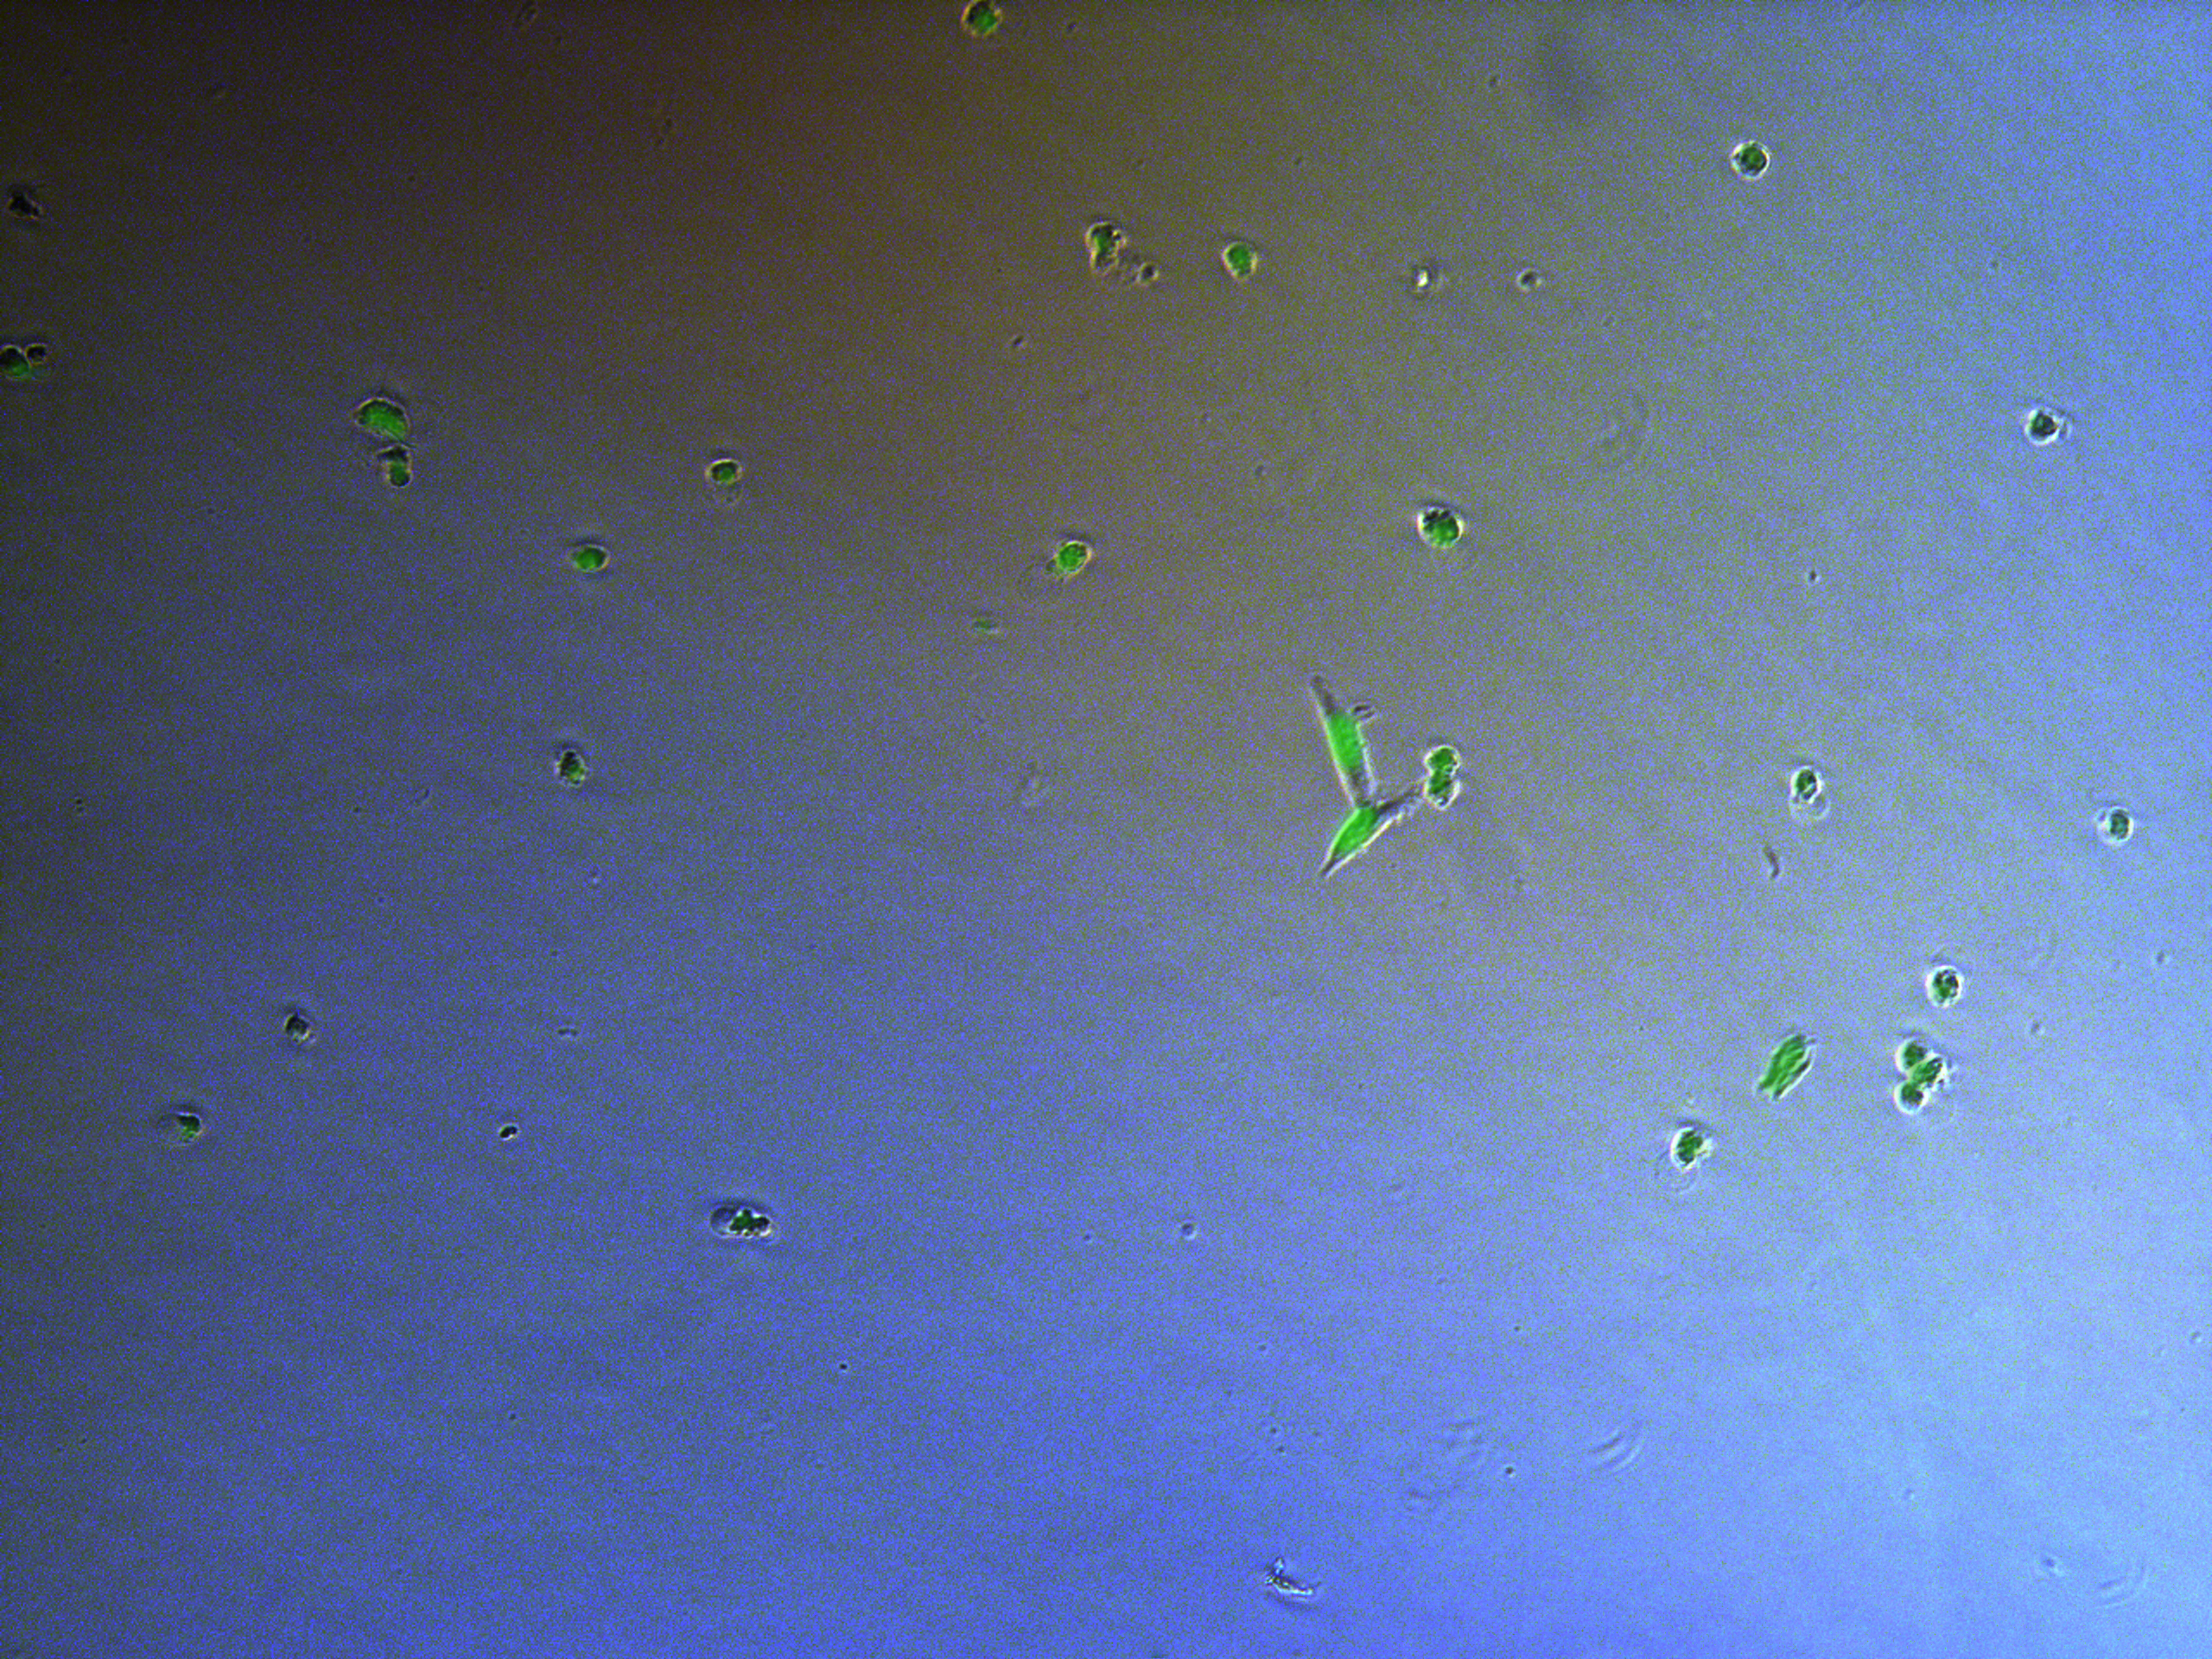
Figure 13. Plate G4 seeded 5000 cells.

Figure 14. Plate G4 seeded 50000 cells.
Cells on these plate has already grows into small monoclones. And some of clones having no fluorescence as well as resistance have not been killed by antibiotics. Clones and clones separate widely normally 2-3 clones per view.
Result
Plates to construct has a much higher concentration, esay to find a view with many cells. Group 1,3 has more cells with fluorescencs and more intense than group 2,4.
Aug 21st
The sixth day after transfection
The third day selection
Fluorescent Observation
[2014 Aug 21st 12:00am]
- G1-4 50,000 plate has many cells dead. Morethan half cells have been killed.
- Pool plate
- G5: Most cells are dead, only 1~2 clones per view field at 4x objective lens.
- G4: Many cells are dead, less than one clone every view field of 4x objective lens 10~20 cells per clone.
- G3: Many cells are dead and suspend in medium. 5~10 clone per view field. 30 cells per clone.
- G2: More cells than G4 but less than G3.
- G1: More cells than G3.
Change medium
[2014 Aug 21st 14:00pm]
All plate have been changed medium. The medium is seriously vaporated, only 3ml medium left in plate, 5ml orginally.
Aug 22th
The seventh day after transfection
The forth day selection
Seed plate for second transfection
[2014 Aug 22th 18:30pm]
Prepare for the second transfection.
We think that the first transfection may not be good enough, as a result, we prepare for the second time transfection. Just the same as the first time, we schemed to transfect HeLa cells with 3 different combination of plasmid.
| Group A | EGFP:Piggybac = 1:1 |
|---|---|
| Group B | Cas9:EGFP:Piggybac = 1:1:1 |
| Group C | Cas9:Piggybac = 1:1 |
We seed HeLa cells in 6-well-plate (6wells at total), 100,000 cells per well. For tansfection
- Procedure
- Wash cells with PBS, trypsin digestion, and medium to stop digestion.
- Discard the supernatant and add 8ml complete medium to resuspend the cells.
- Add 1ml PBS to every gap between well
- 1:10 dilution count the cell concentration with blood counting slide. Get the concentration: 760,000 cells/ml. 0.78ml cell suspendion + about 9ml DMEM with 10% FBS. Mix well and add 1.5ml per well, to mix well pepite the well gently.
Result
Cells seeded really even, but wrong concentration. Fever concentration of transfection is about 200,000 cells per well, so we have to culture cells in well for days.
Aug 23rd
The eighth day after transfection
The fifth day selection
Fluorescence Observation
[2014 Aug 23rd 10:29]
After 5 days selection, almost every cell surviving expressing green fluorescence. Only a few cells on 10cm petri dish for monoclones do not express green fluorescence.
When peak up monoclones to construct a stable cell-line, we will check its green fluorescence under fluorescence microscope.
Monoclones
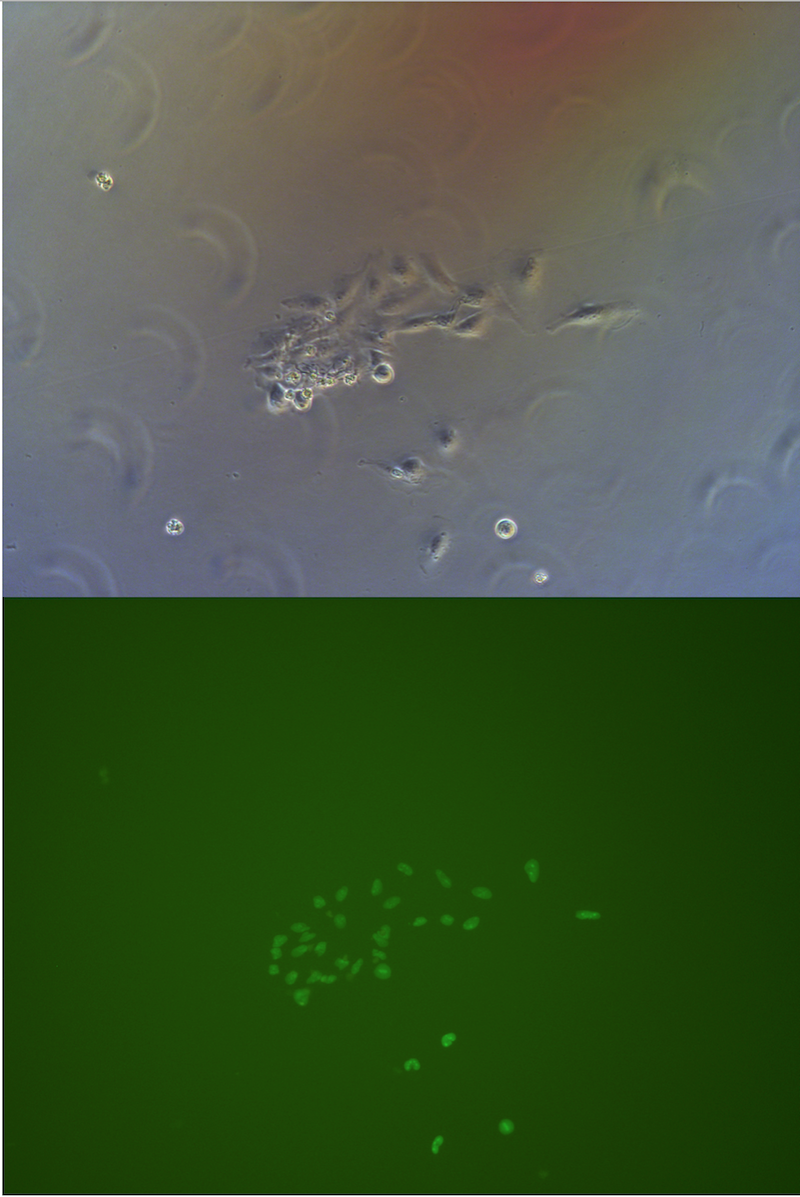
Figure 15. Picture of G1 monoclones, almost every cells has fluorescece.
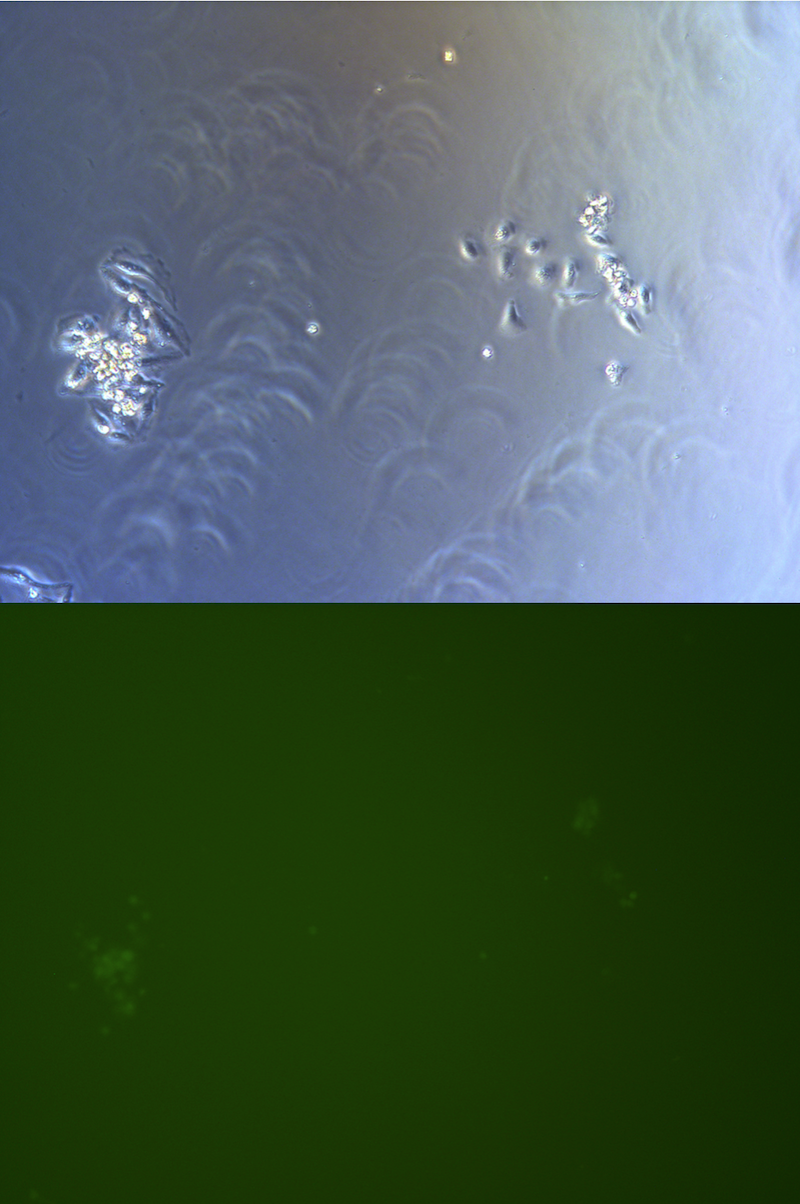
Figure 16. Picture of G2 monoclones, hardly to find cells expressing GFP.

Figure 17. Picture of G3 monoclones, almost every cells has GFP.

Figure 18. Picture of G4 monoclones, some of cells expressing GFP.
We observed and note clones expressing clones in all clones we observed under fluorescent microscope.
| Groups | With GFP | Without GFP |
|---|---|---|
| Group 1 | 11 | 12 |
| Group 2 | 4 | 11 |
| Group 3 | 10 | 10 |
| Group 4 | 9 | 11 |
Pool cells
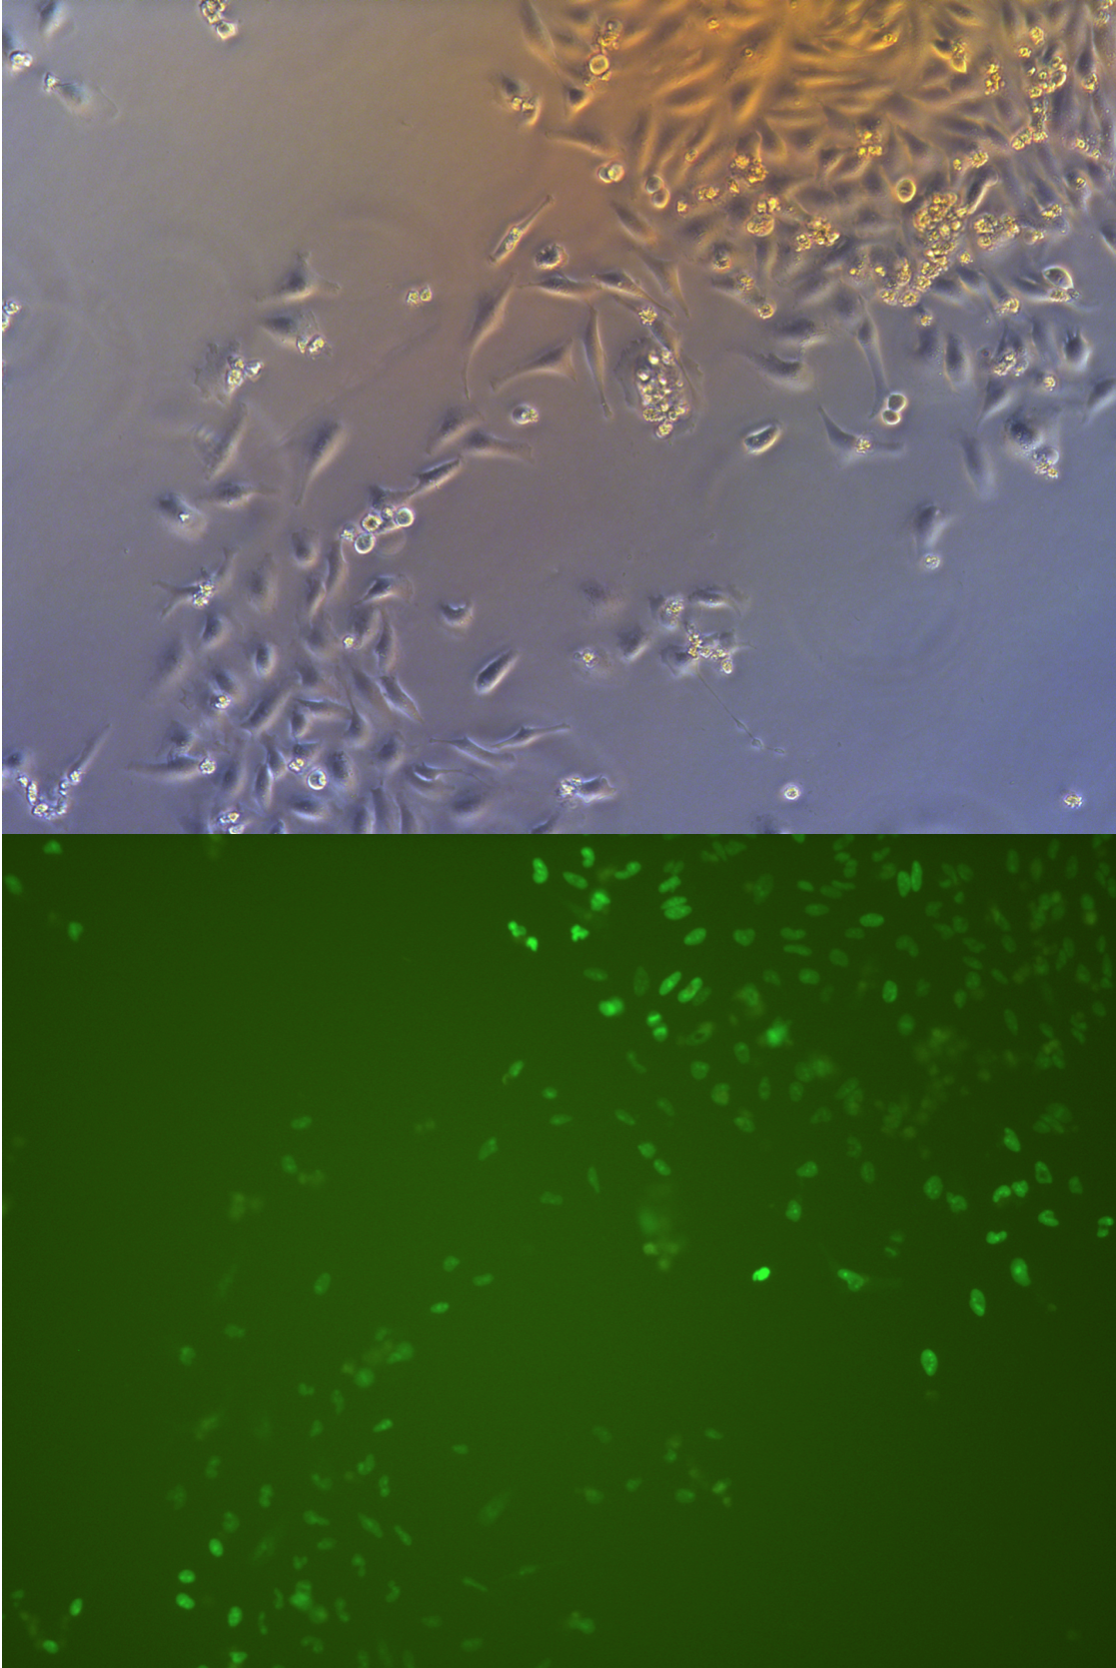
Figure 19. G1 pool cells of first transfection, under fluorecenct microscope. Nine days after transfection.
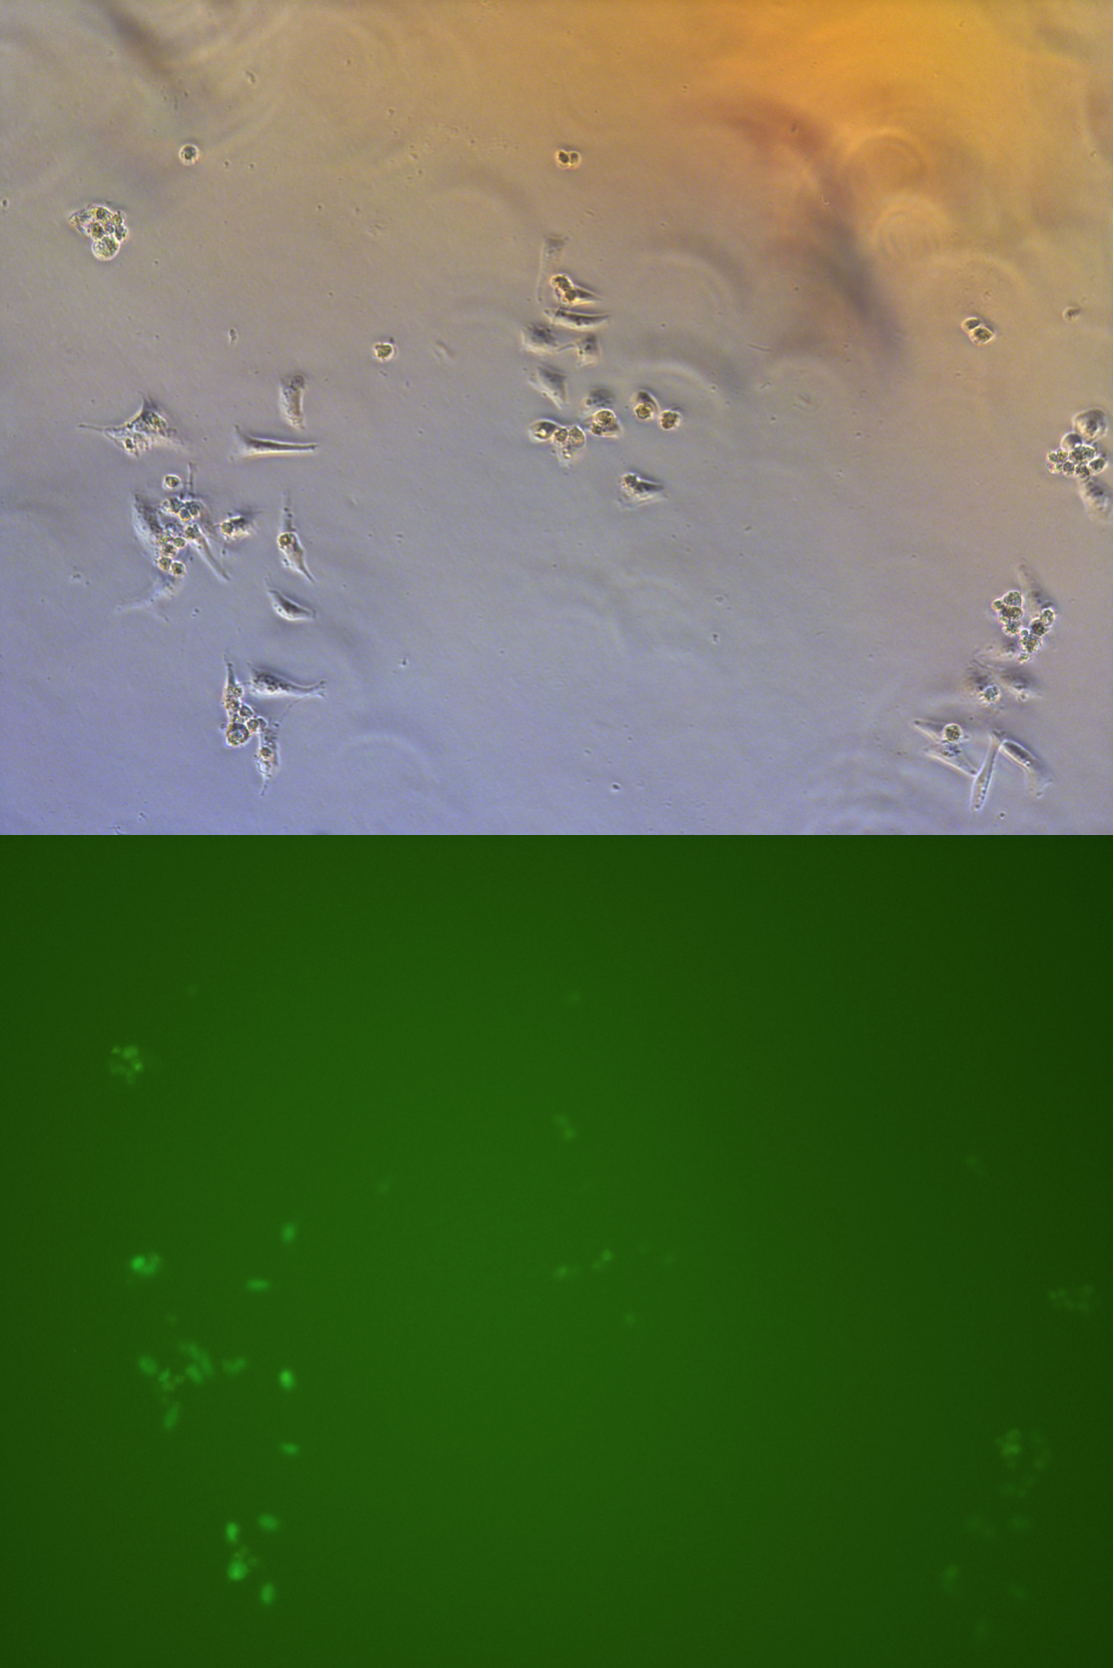
Figure 20. G2 pool cells of first transfection, under fluorecenct microscope. Nine days after transfection.
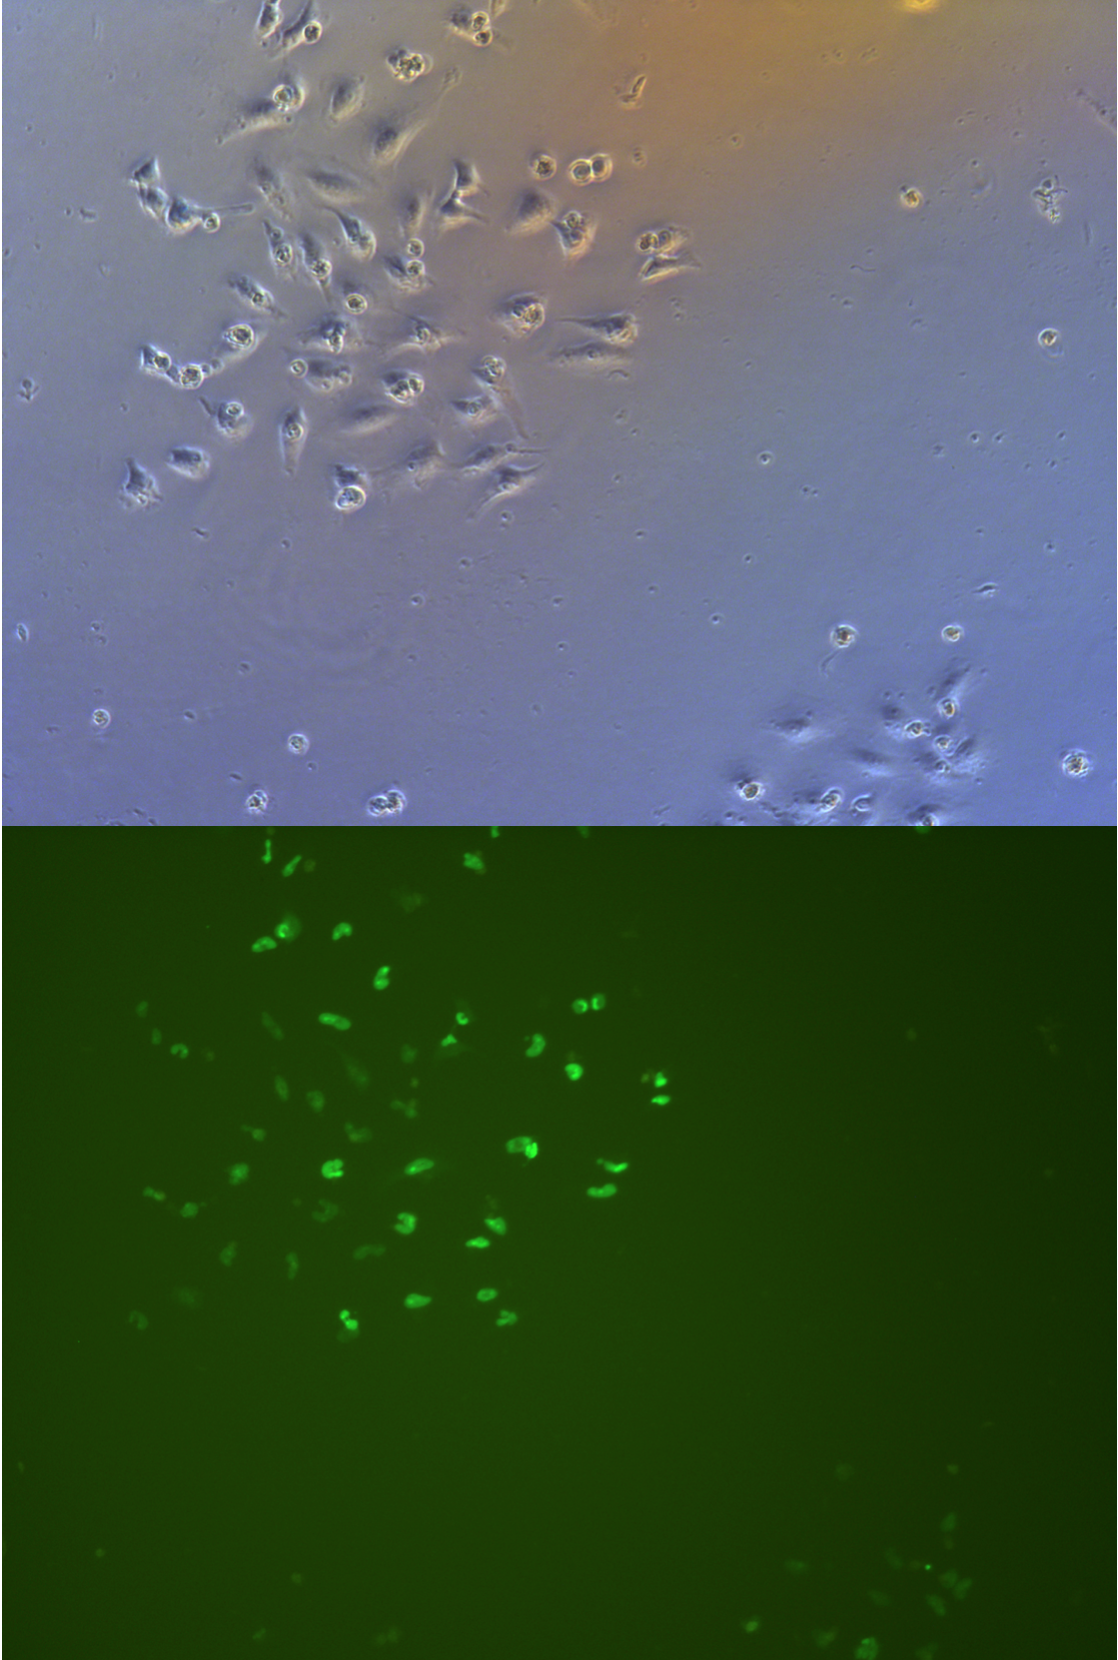
Figure 21. G3 pool cells of first transfection, under fluorecenct microscope. Nine days after transfection.
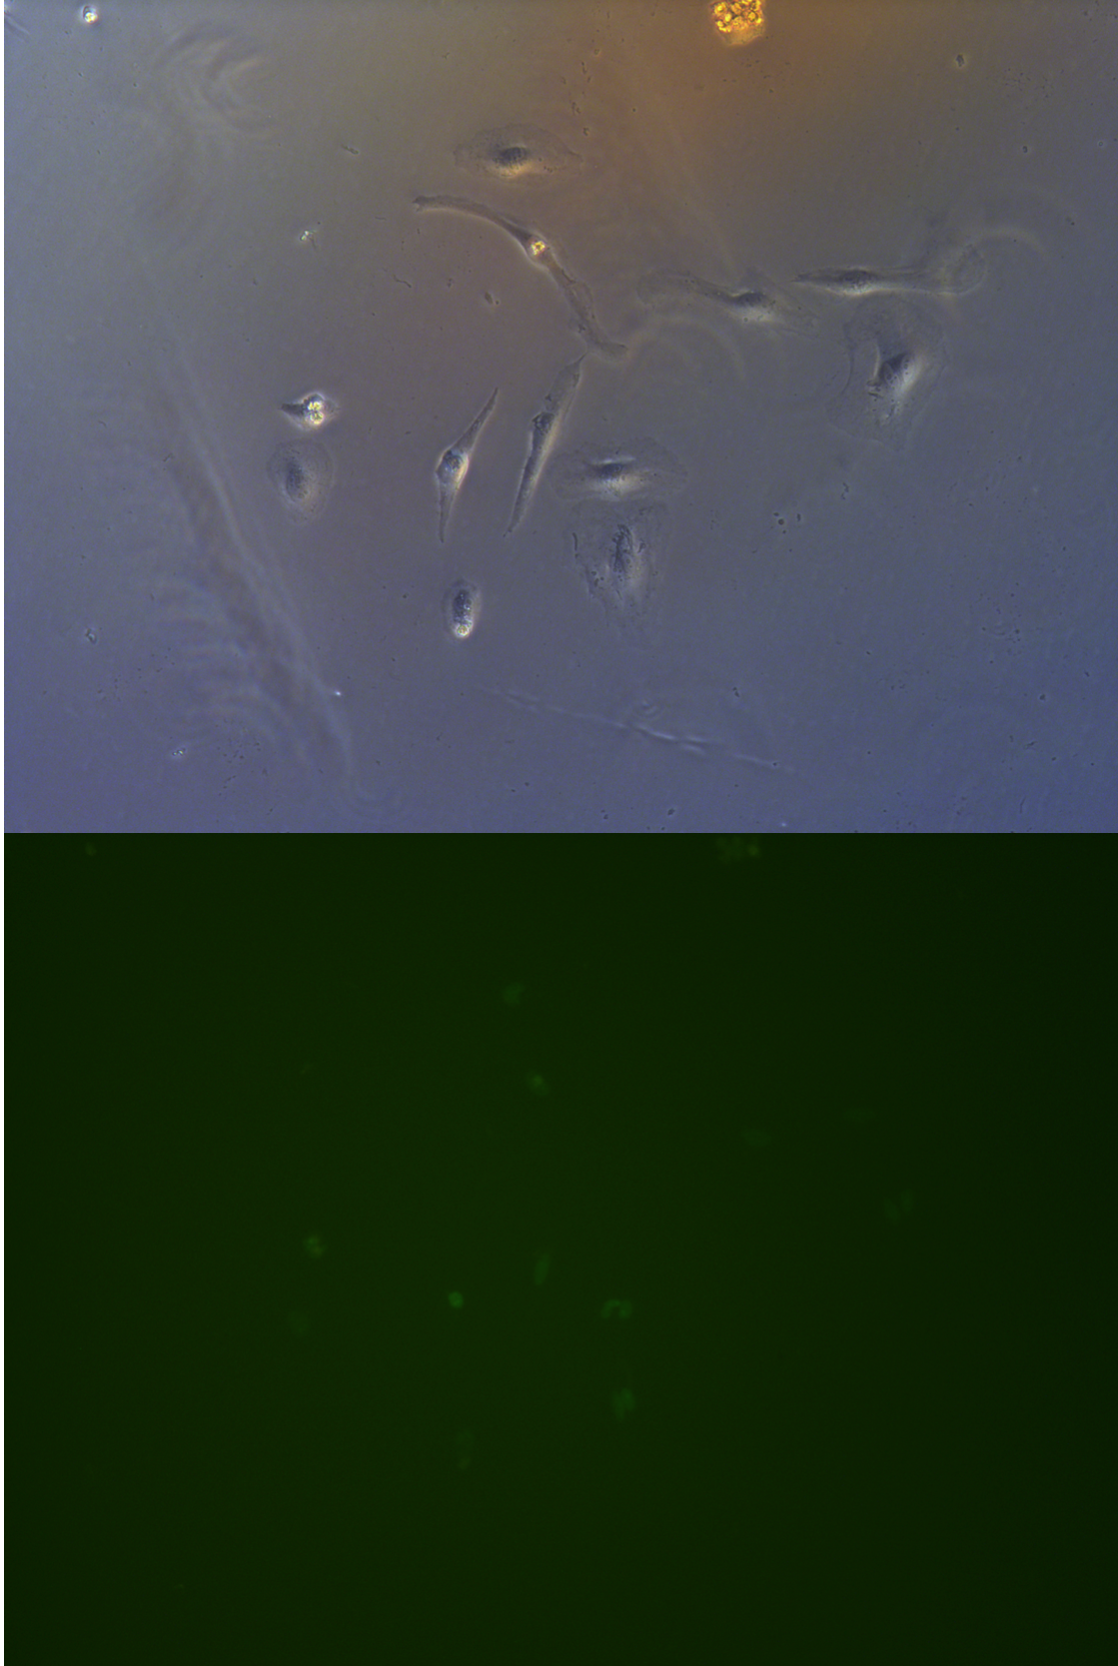
Figure 22. G4 pool cells of first transfection, under fluorecenct microscope. Nine days after transfection.
Aug 25th
The tenth day after transfection
The seventh day selection
Second transfection
[2014 Aug 25th 11:00am]
Method
| Groups(3wells/group) | EGFP(μl) | Cas9(μl) | Piggybac(μl) |
|---|---|---|---|
| Group A(3wells) | 2.29 | 0 | 1.30 |
| Group B(3wells) | 1.49 | 1.359 | 0.612 |
| Group C(3wells) | 0 | 1.60 | 1.30 |
Procedure
- Dilute 3.75μl/well Lipofectamine 3000 reagent in 25μl/well Opti-MEM, and incubation for 5min
- Prepare master mix of 5DNA μg/well by dilutiong DNA in Opti-MEM medium 25μl/well according to the form, then add P3000 reagent.
- Add dilutetd DNA to each tube of diluted lipo 3000.
- Incubation for 10min
- Add DNA lipid complex to cell waiting for the harvest.
Change medium
- We changed all medium in dishes.
- Puro 2.0 μg/mL for selection cells with puromycin resistance.
- Bla 2.8 μg/mL for selection cells with blasticidin resistance.
Fluorescent Observation
- Resutl
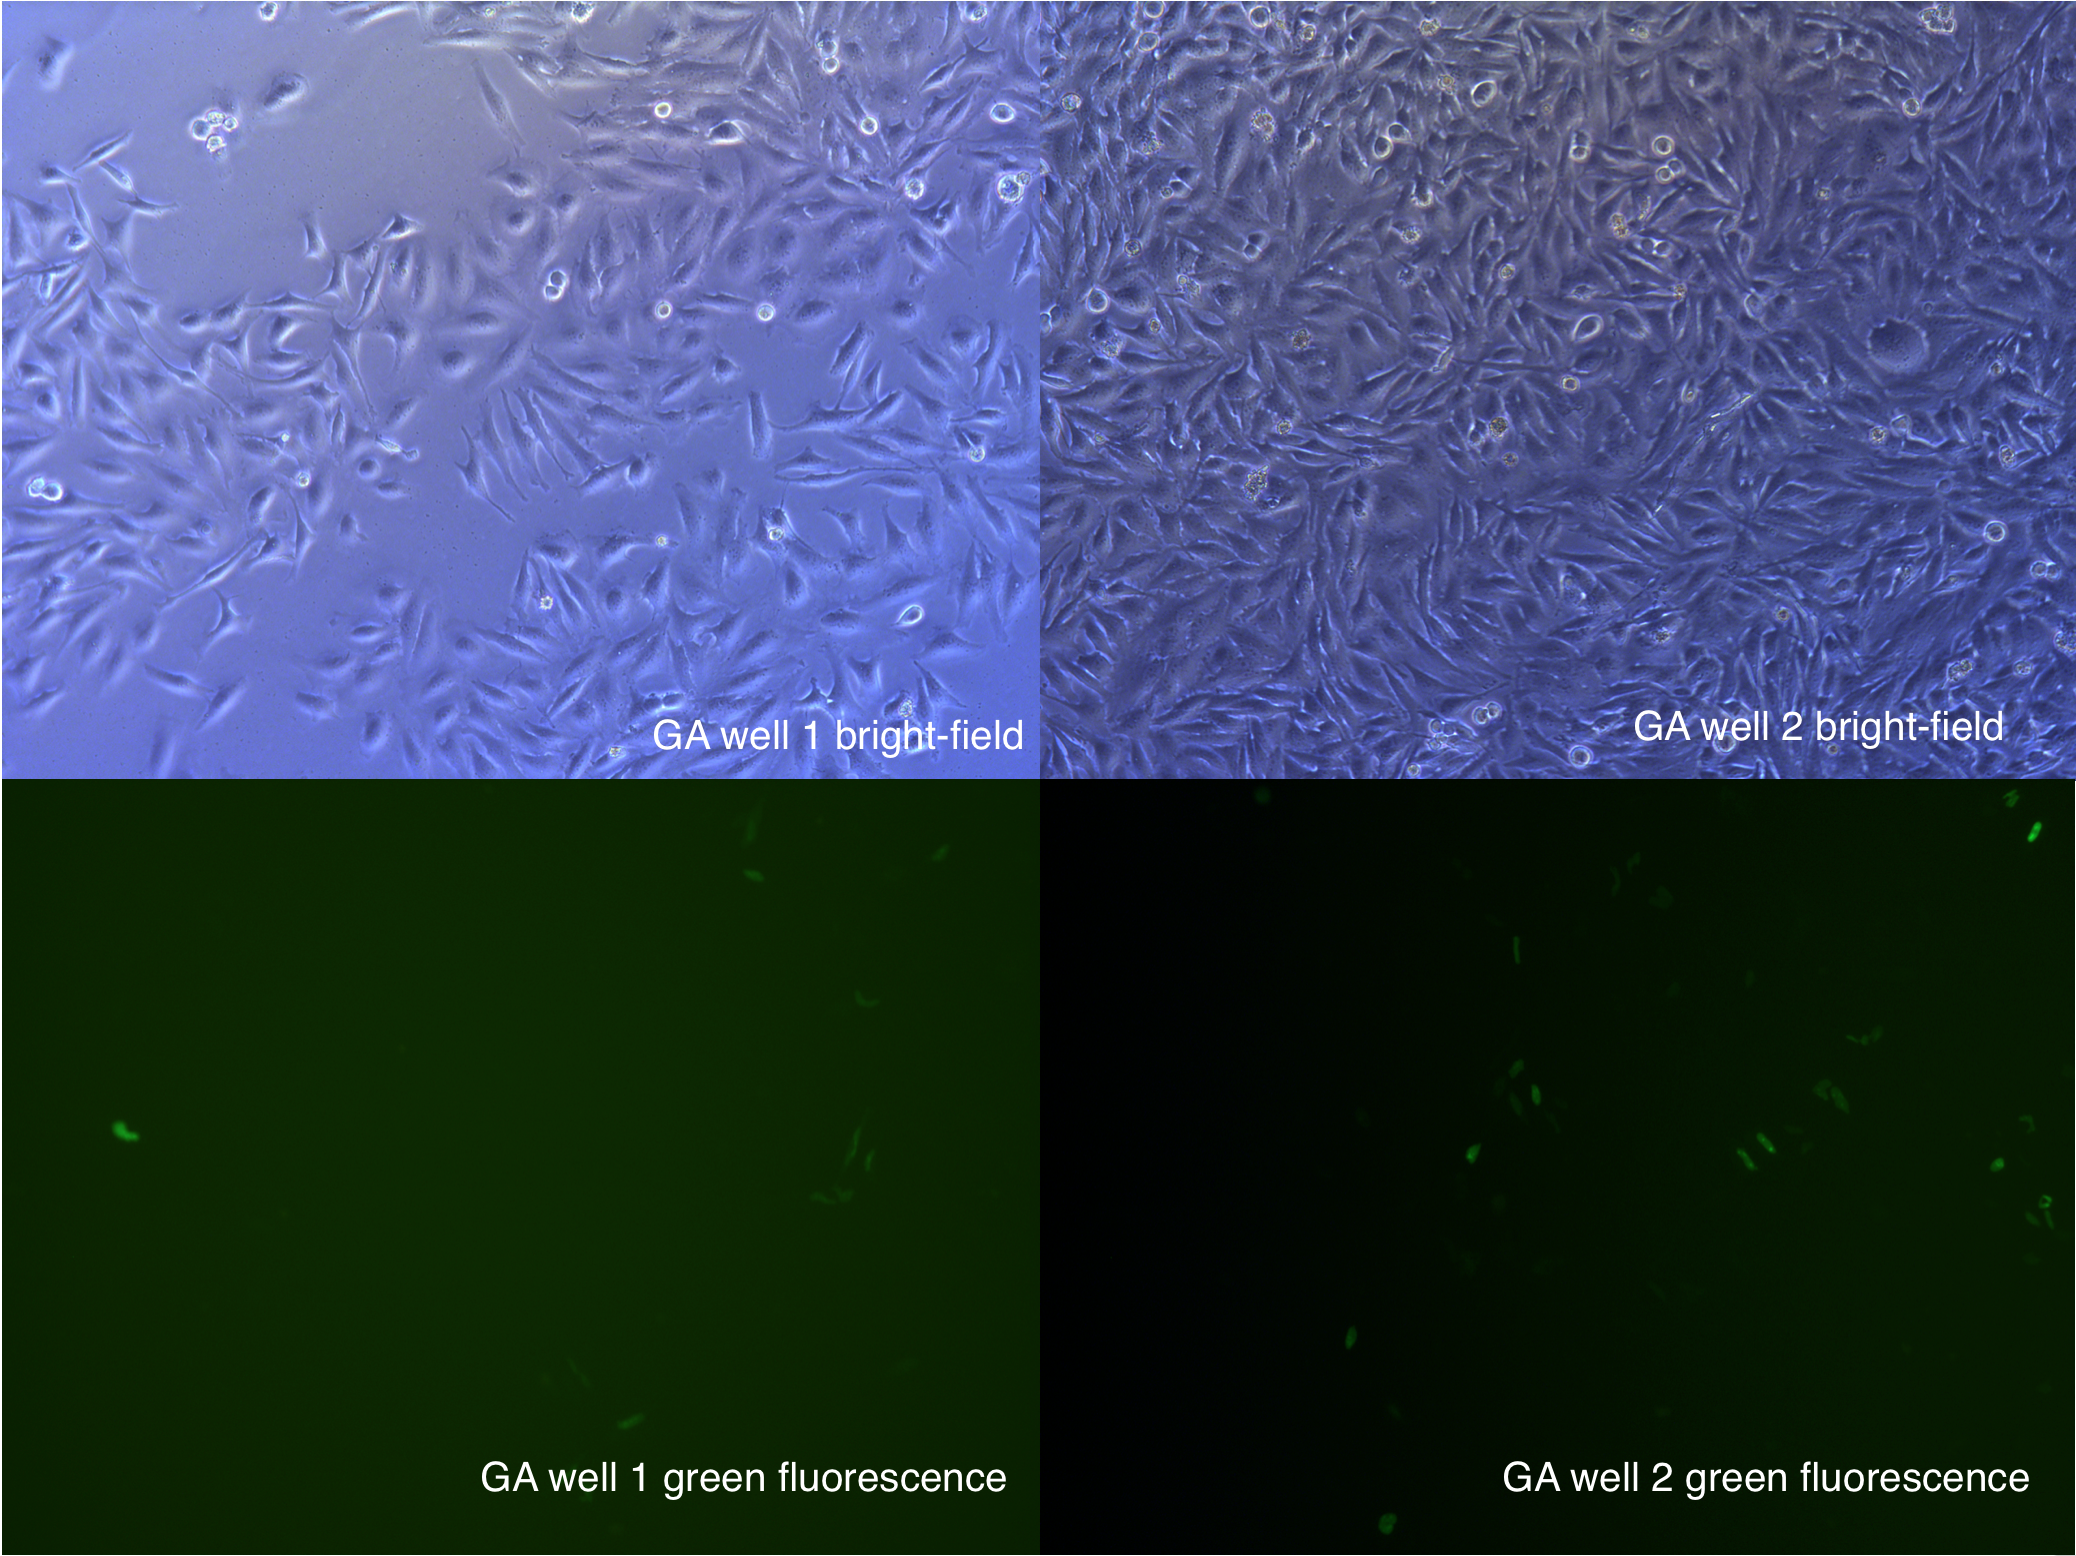
Figure 23. 10hours after transfection
Aug 26th
Fluorescence Observation
[2014 Aug 26th 11:30]

Figure 24. 24 hours after transfection
[2014 Aug 26th 21:50]
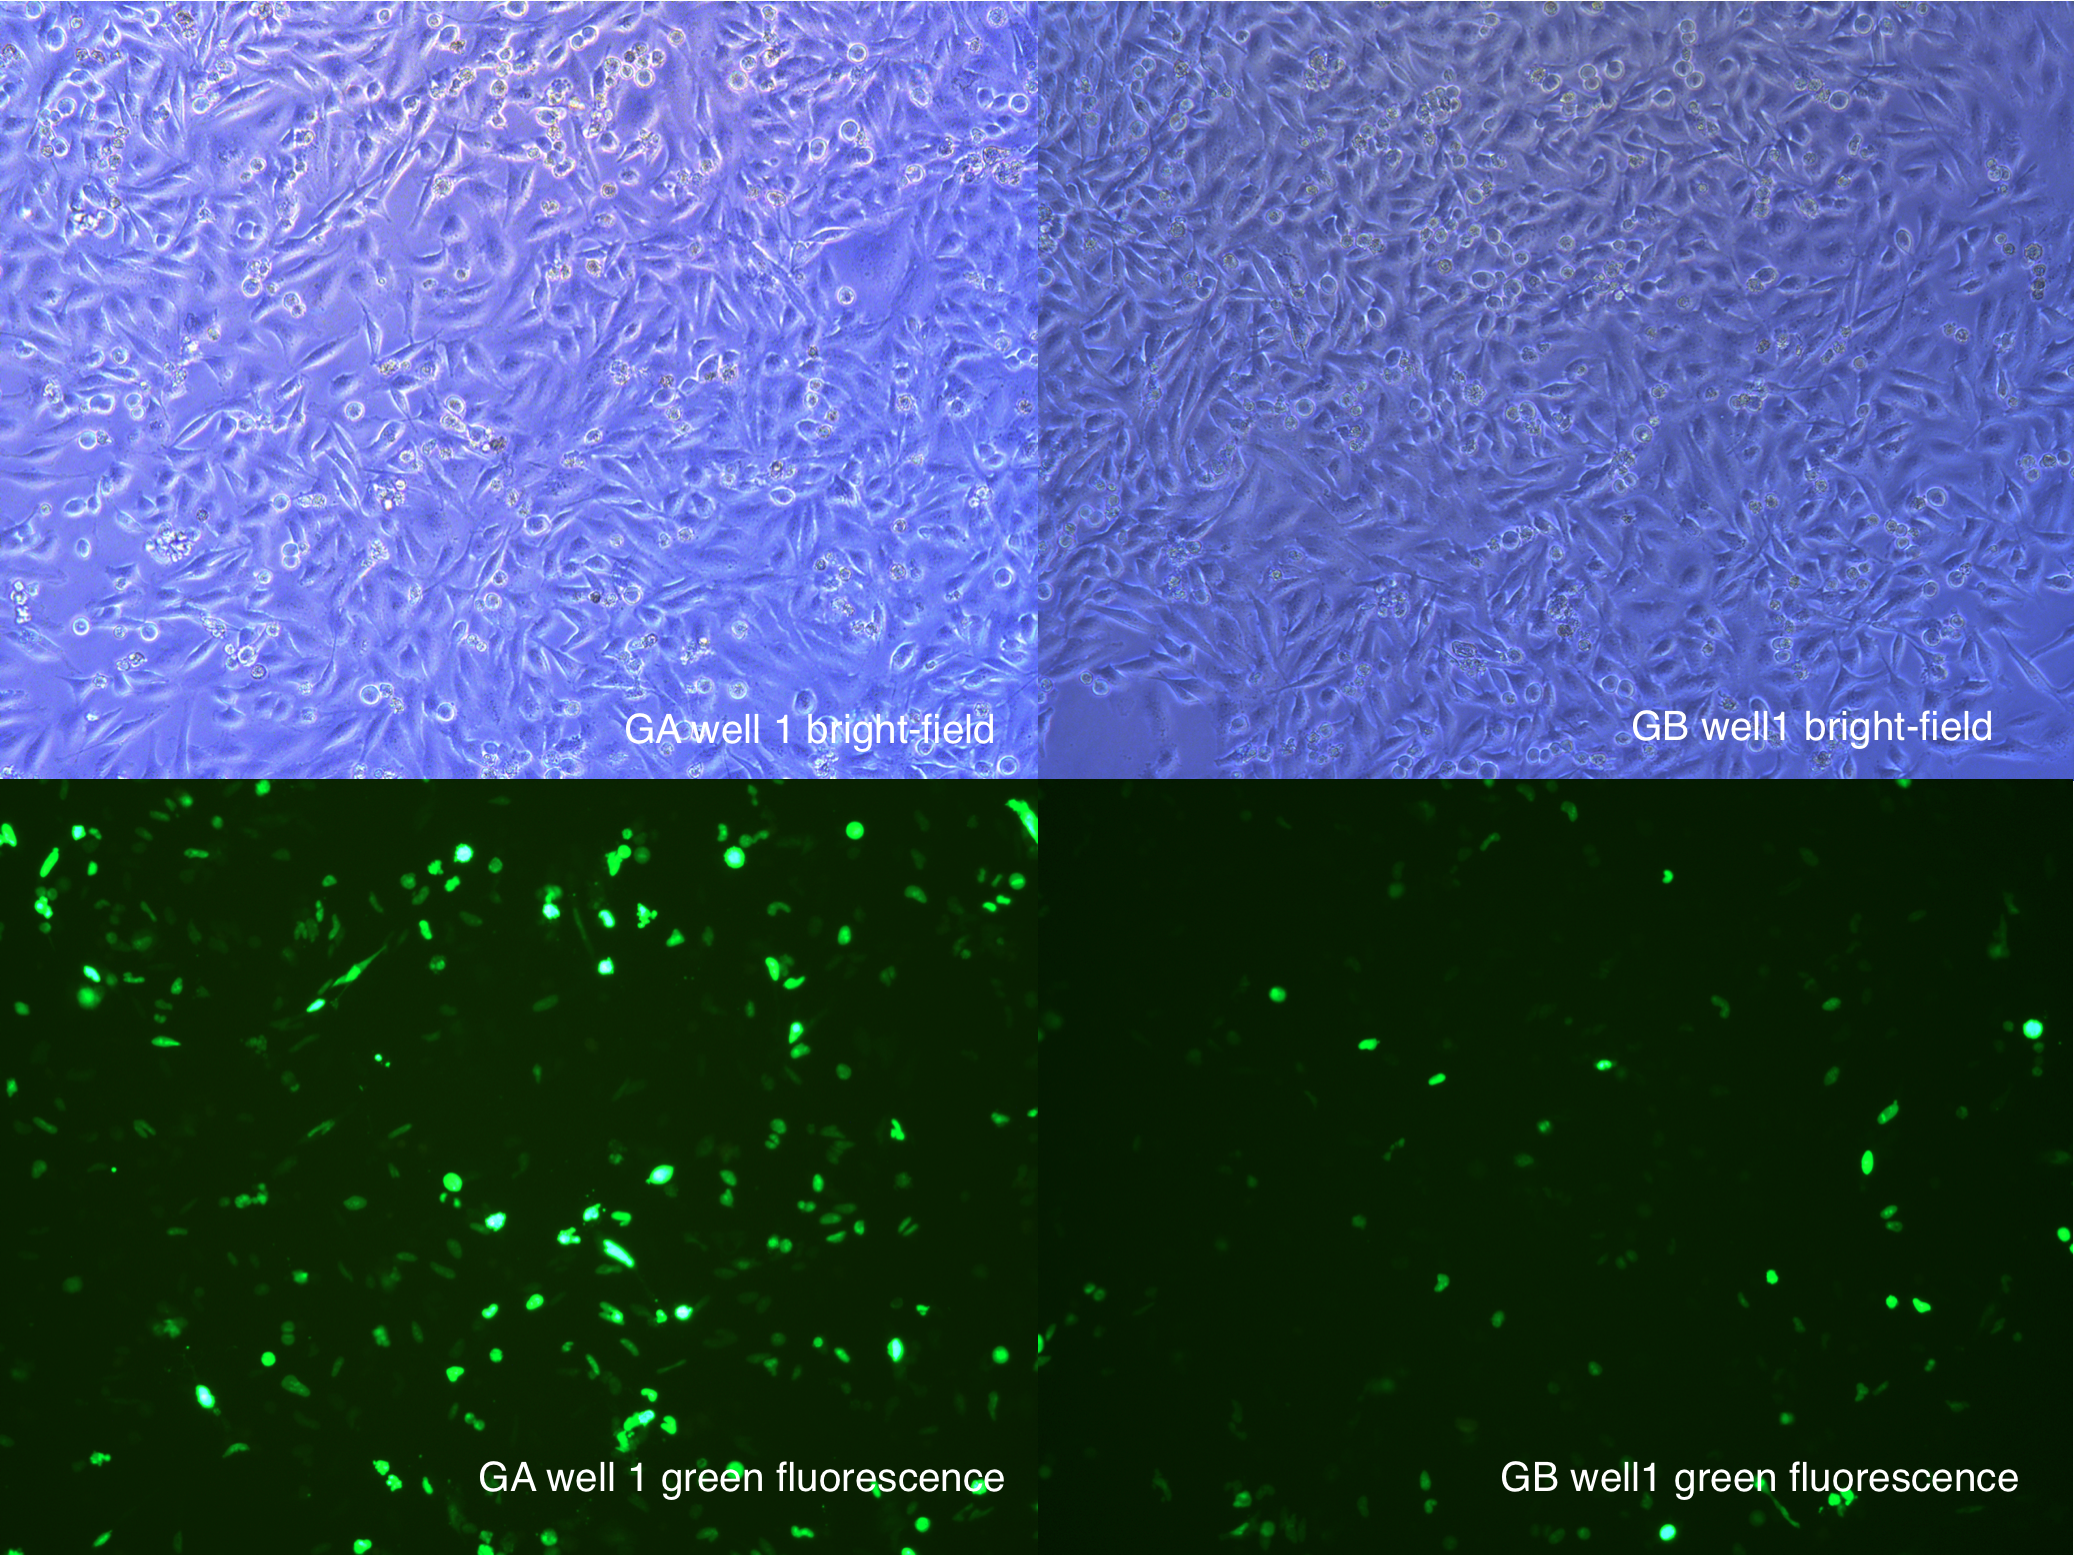
Figure 25. 35 hours after transfection
Passage T2(transfection 2) cells
The concentration in well is very high, so we have to passage those cells.
Passage cells of every Groups from wells to petri dishes, one 50000 cells per dish. Use antibiotics to kill cells without resistance. Only those with resistance can survive, can express gene we transform both resistance gene and gene we need.
Cells left after passage to the petri dish for monoclones are passage back to well to construct a pool of all kinds of cells expressing resistance.But less stable and less homogeneous than monoclones.
Procedures
- Wash cells with PBS for 2 times
- Add trypsin 1ml and discard to digest for 2min at 37°C.
- Add complete medium 2ml to end digestion, suspend cells.
- Count cell number with blood counting chamber.
- Passage 50,000 cell suspension to 10cm petri dish, and 5ml complete medium mix well with pipet. Mark the dish.
- Add complete medium to 6 well plate, mix well.
Aug 27th
The first day after second transfection
Fluorescent Observation
[2014 Aug 27th 11:00] 48h after second transfection
- In GA,GB groups, there are about 1/5 cell became round.
- 1/5 cells has a magnificent fluorescence.
- 50k plates has a dead cells accounting for 20%.
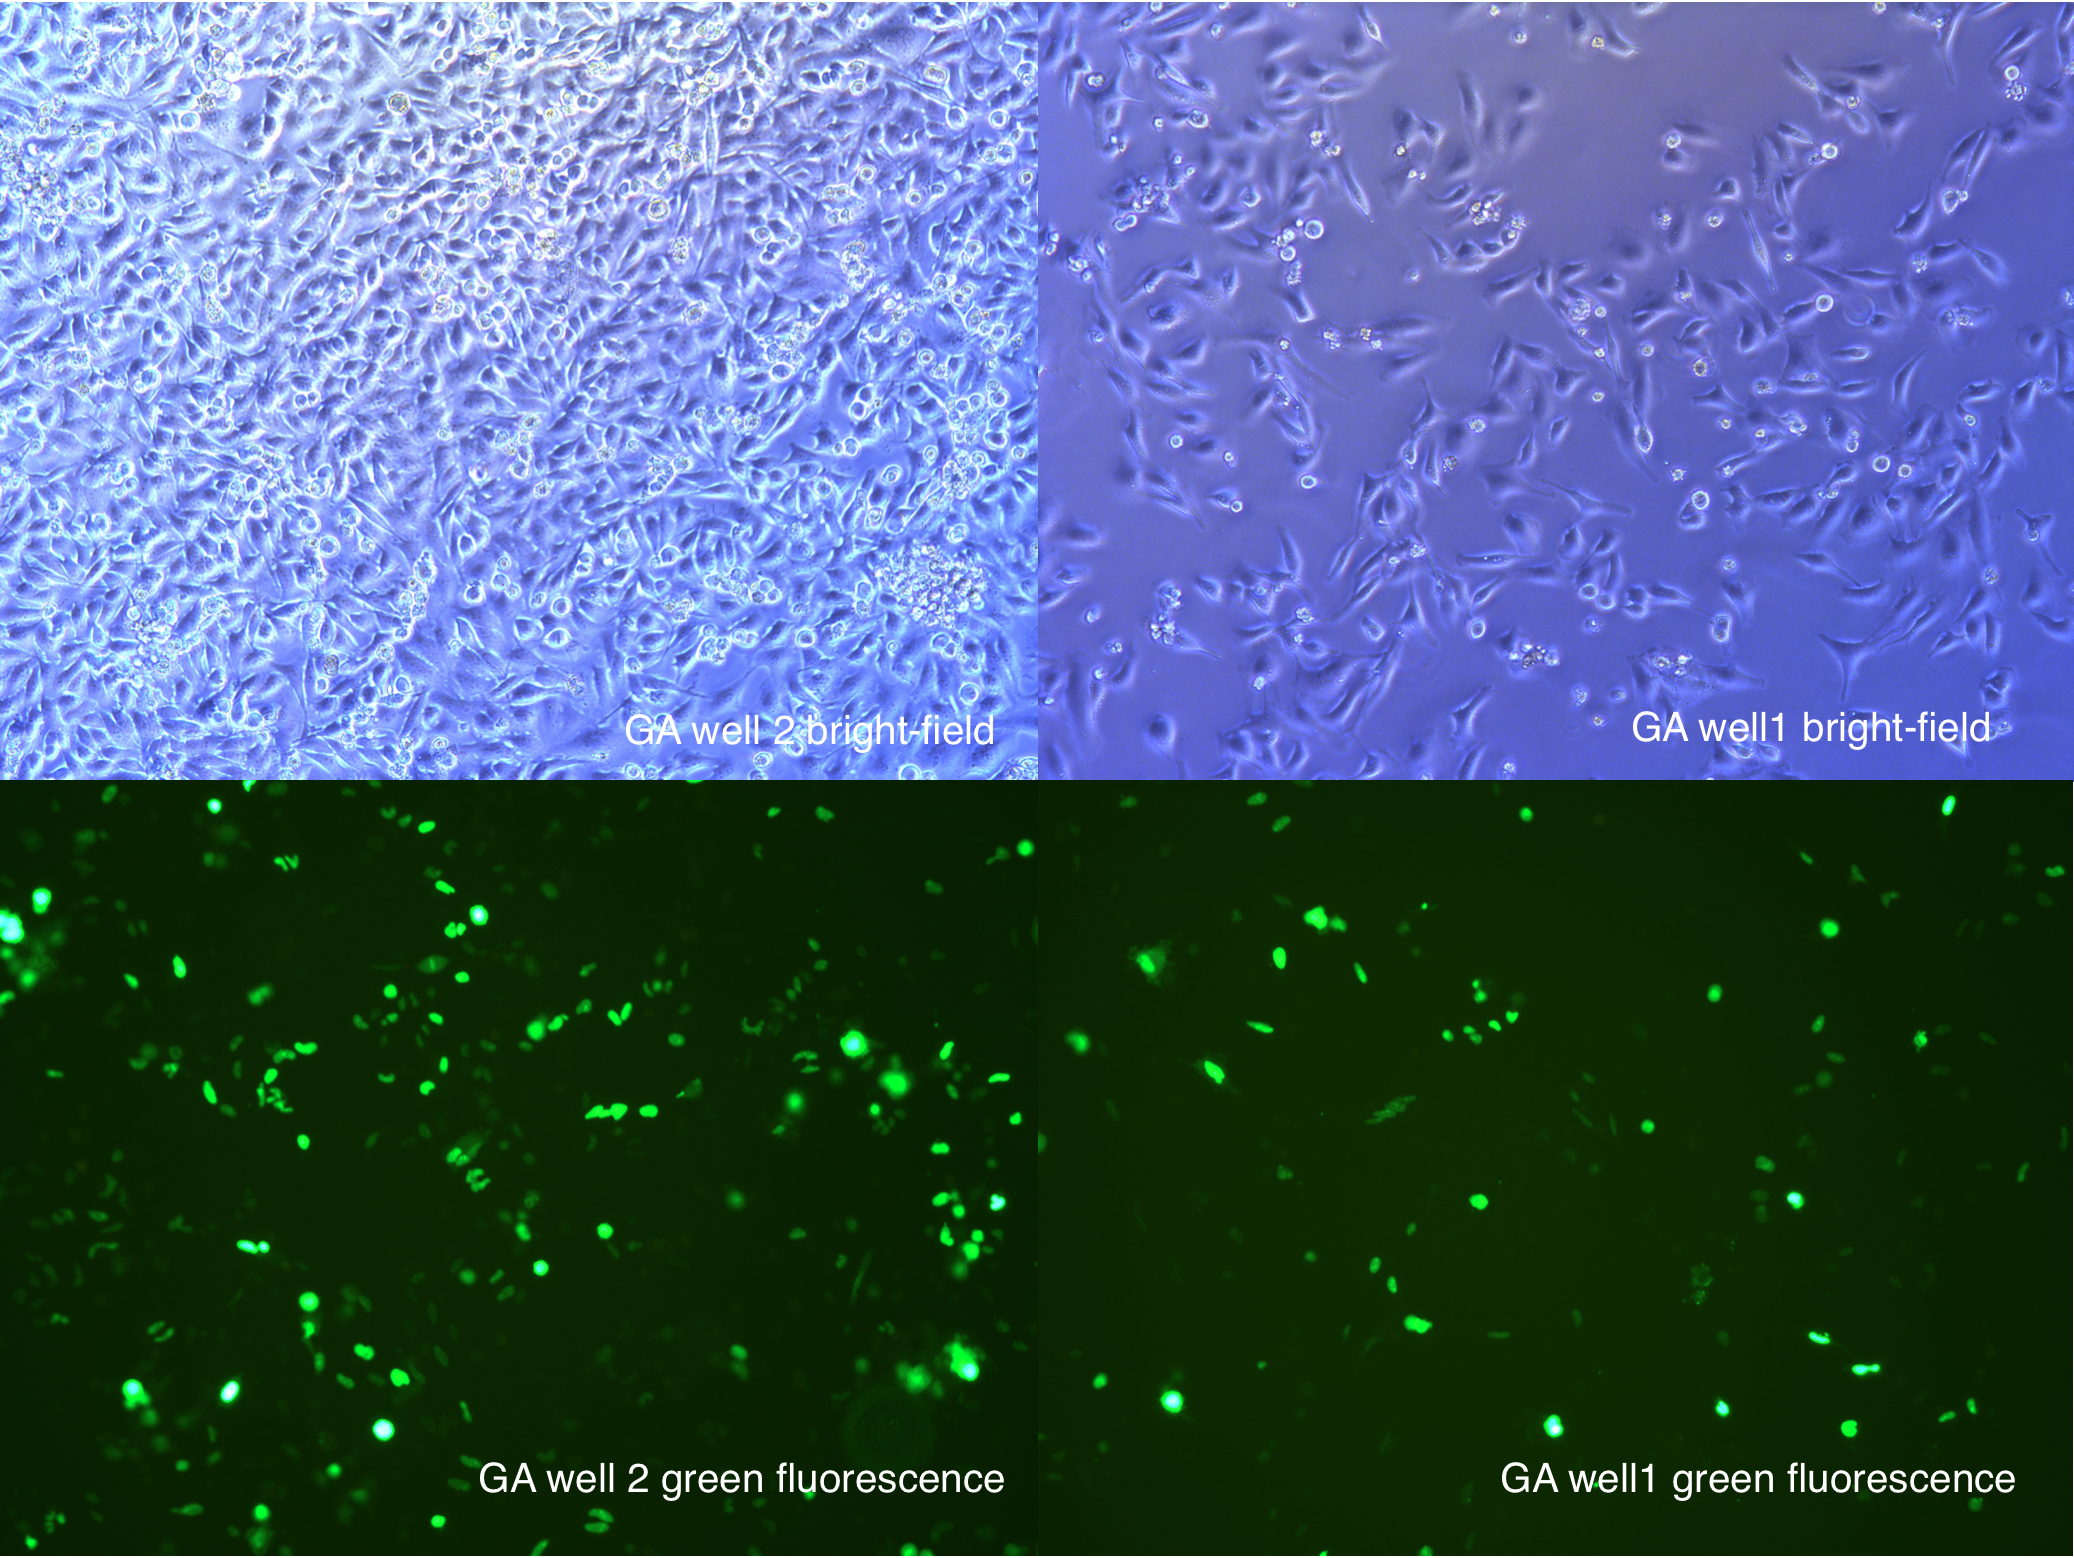
Figure 26. GA 48hours after transfection

Figure 27. GB 48hours after transfection
[2014 Aug 27th 20:40]

Figure 28. GA and GB 60hours after transfection
Aug 28th
The second day after second transfection
Resistance Selection
[2014 Aug 28th 11:00] 72h after second transfection Change medium to medium with antibiotics.
Fluorescence Observation
[2014 Aug 28th 23:58]
108 hours after second transfection
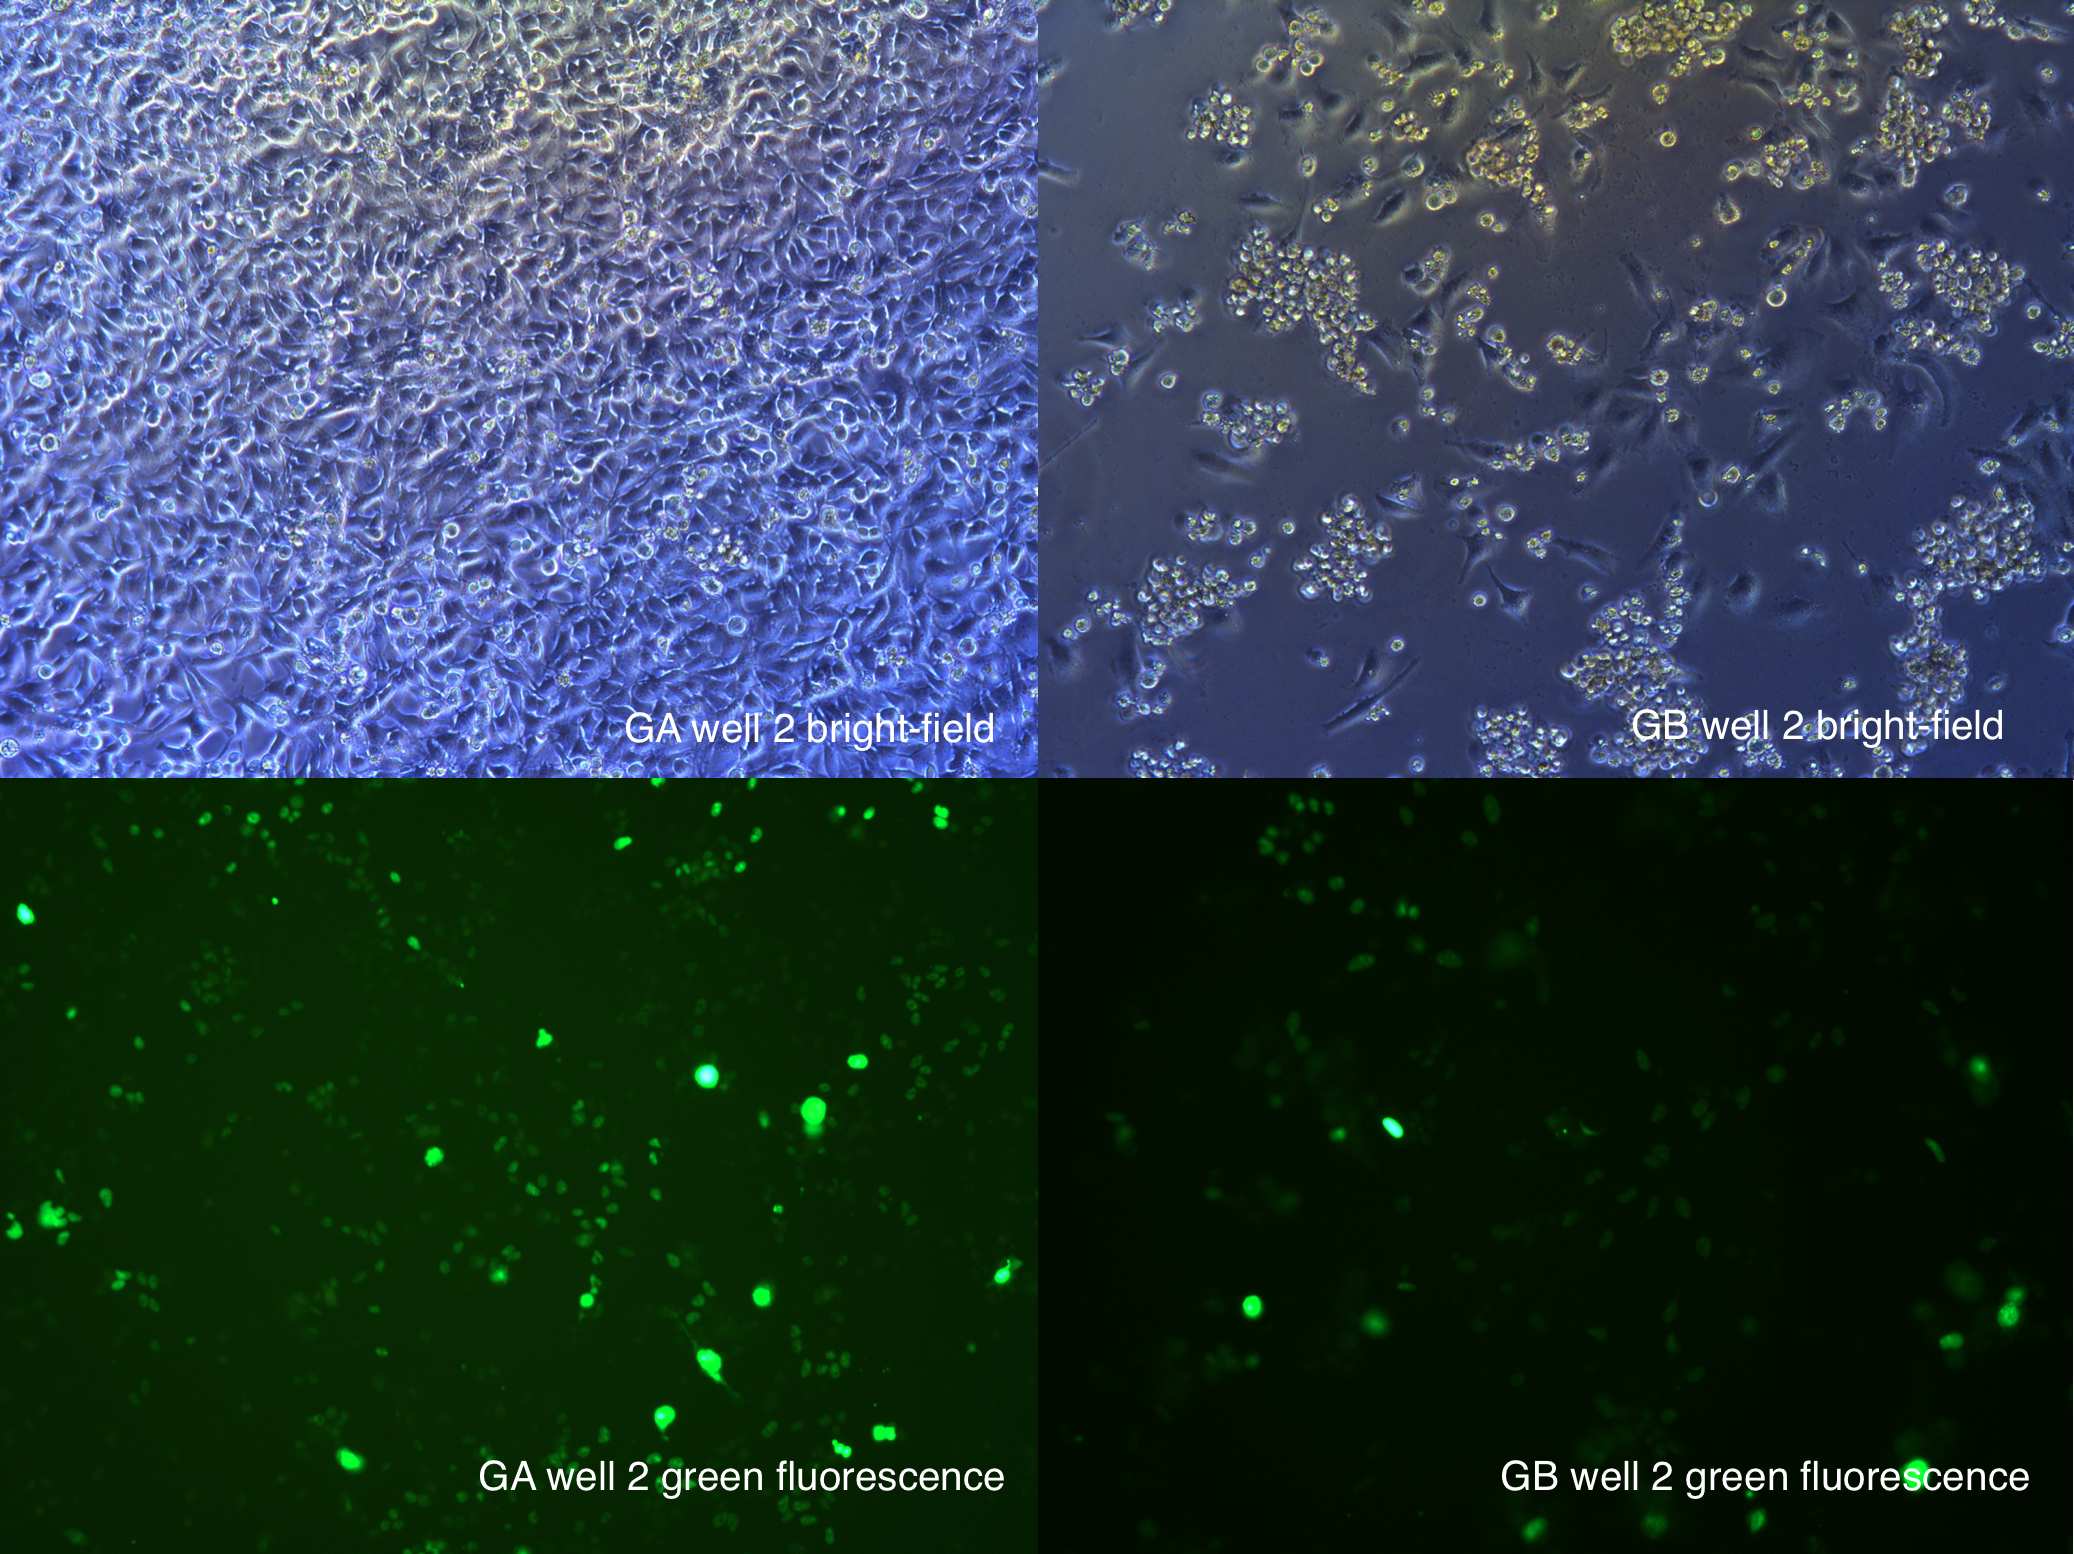
Figure 29. GA GB 108 hours after transfection
Aug 29th
The third day after second transfection
Pick up clones
[2014 Aug 29th] Due to we have gone to Guangzhou having application of visa to U.S. Out teacher help us finish the experiment
Result
One 24-well-plate each group.
Aug 30th
The forth day after second transfection
Fluorescence Observation
[2014 Aug 30th 12:22]
120h after second transfection
Figure 30. GA GB 120 hours after transfection
[2014 Aug 30th 23:00]
132h after second transfection

Figure 31. GA GB 132 hours after transfection
Aug 31st
The fifth day after second transfection
The fluorescence rate is very high of the first time transfected cells. So we passage them and prepare to preserve.
Change medium
- We change the selection medium of T2 cells.
- We change medium of monoclones.
- We change medium of T1 cells.
Sept 1st
The sixth day after second transfection
Fluorescent Observation
[2014 Sept 1st 11:35]
We Observed the fluorescent condition of T2 cells, decide wether the selection is finished or not.
The Observation result shows that the fluorescent rate of GB(Cas9+EGFP) is high, and selection is almost finished.
But for GA, cells are still dying, everyday many cells round up, we still have keep selection with antibiotics.
Result
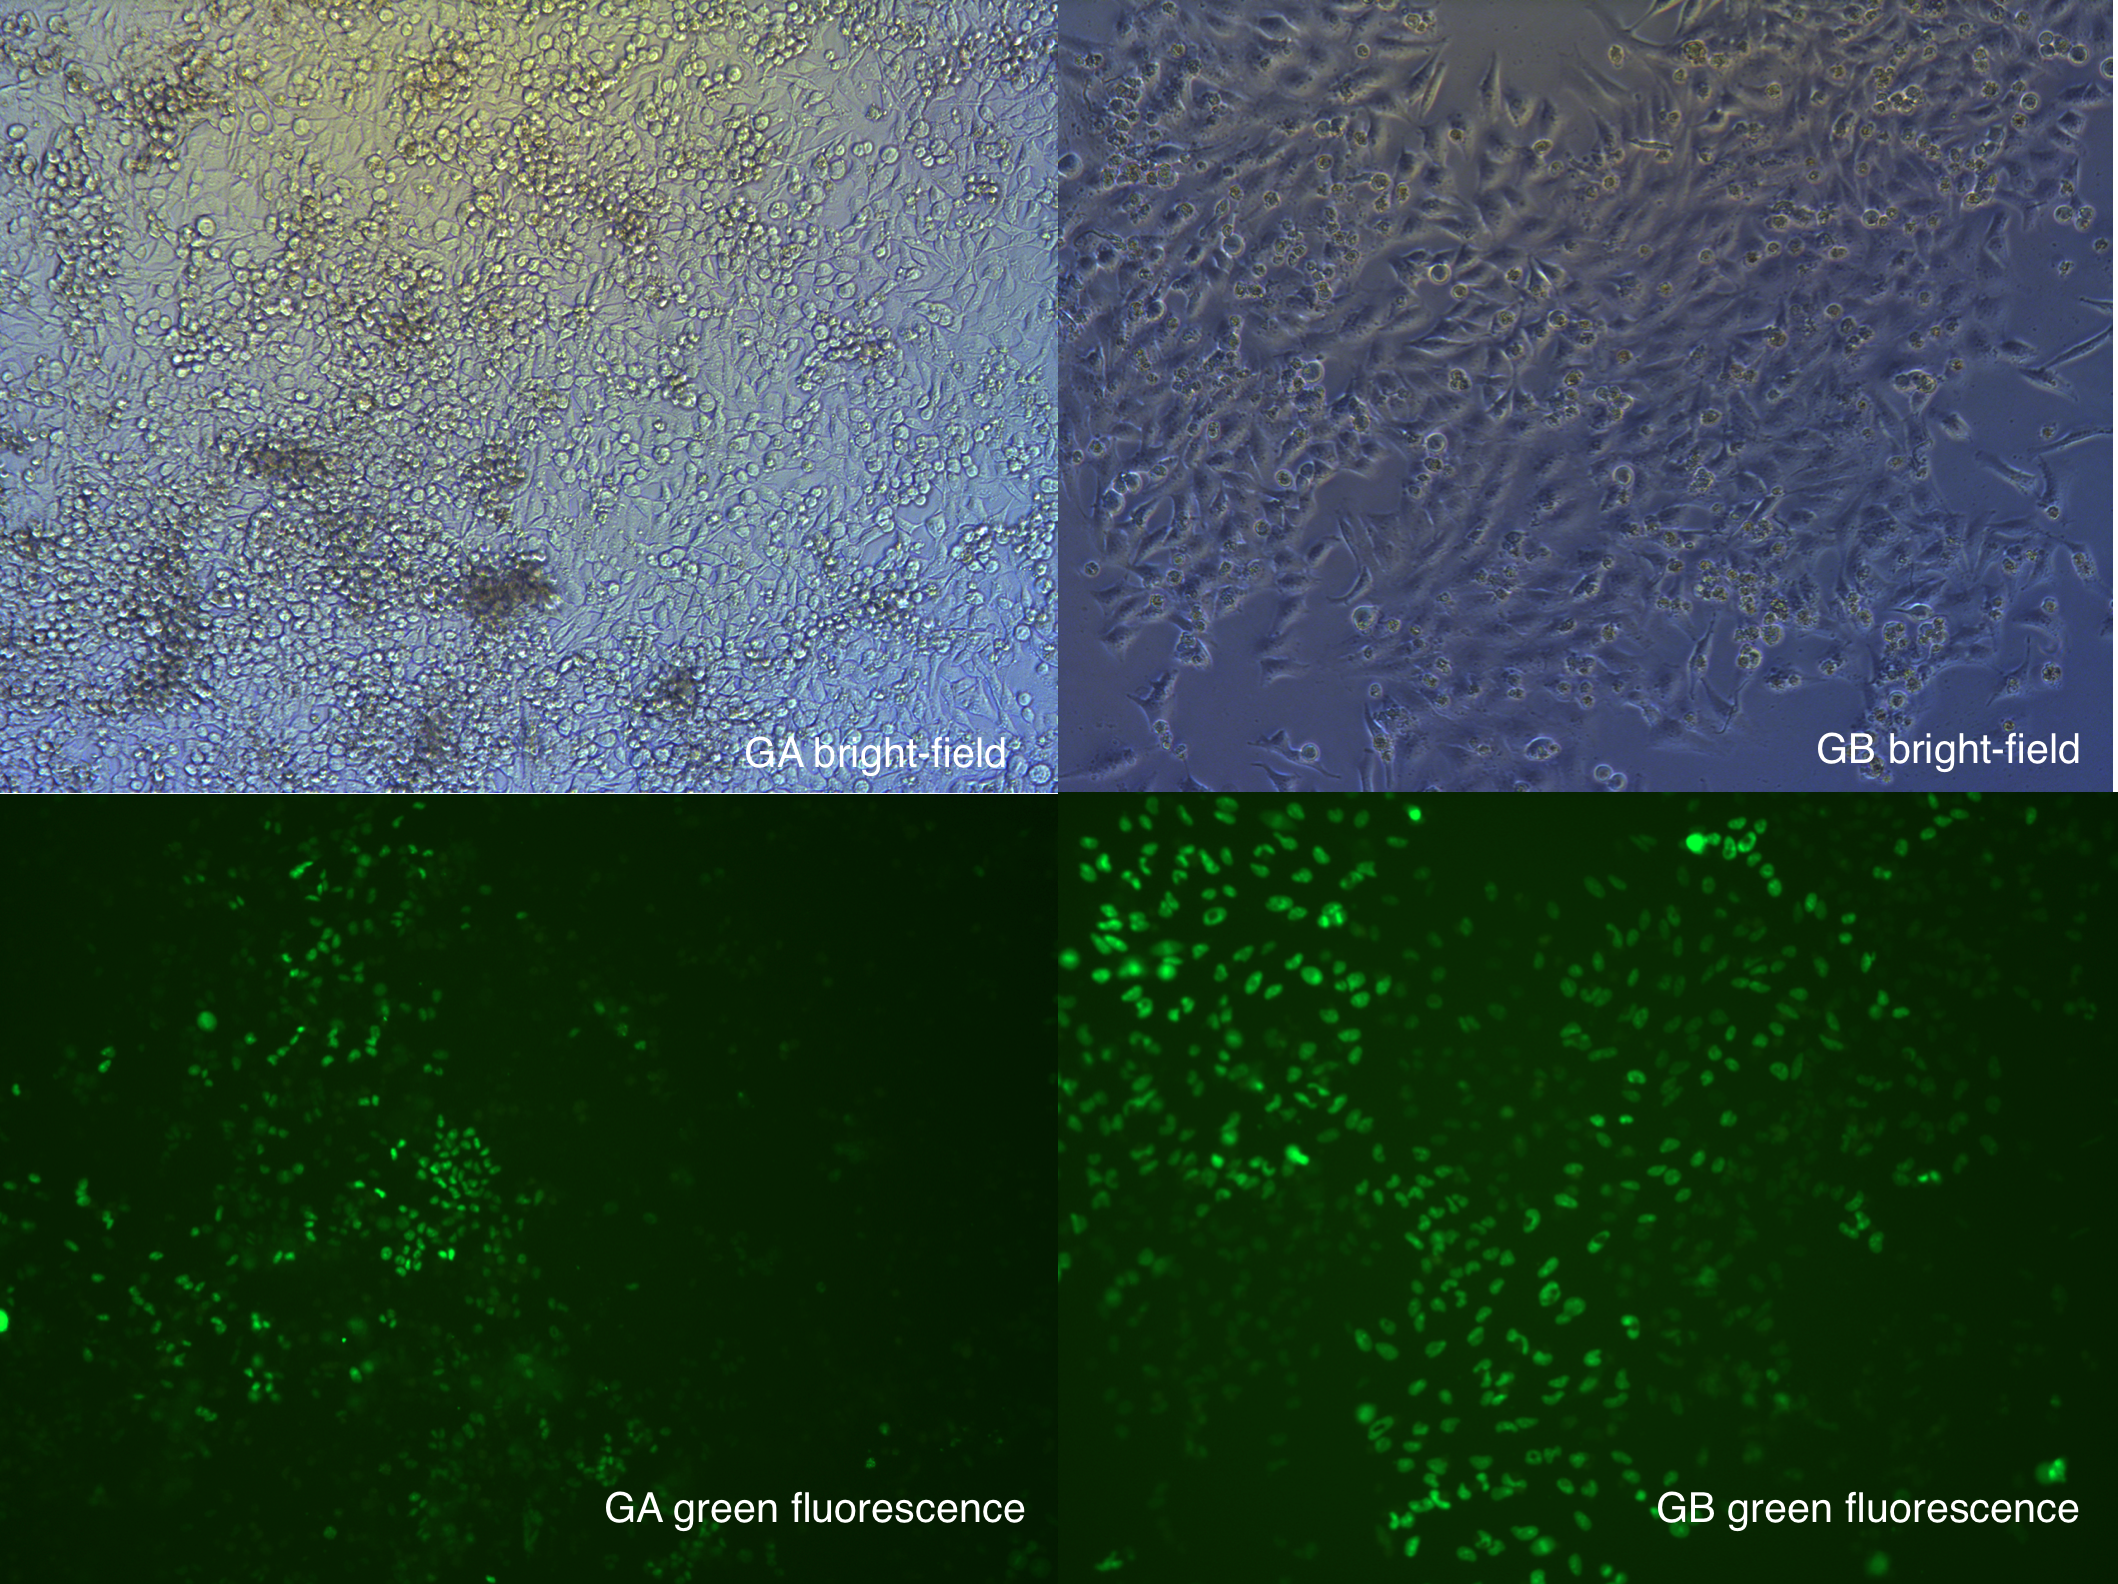
Figure 32. Image took under fluorescent microscope, at 9.1.
Dicussion
We disscused the our instructor, who give a hypothesis to explain the relative longer selection period of GA compare to GB. Which is the highly correlative transfection two plasmid by Lipofectamine.
So those have not transfected with resistance of puro usually have not resistance of bla, vice versa. As a result puromycin helps to select cells with resistance of bla.
Sept 2nd
Prepare freezing preserve cells
To freeze cells, we have to expand our cells' population. As a result we passage each groups of cells from 1 petri dish to 2 10cm petri dishes.
Change medium
- T2 cells.
For keep select T2 cells with fluorescence and resistance, we change medium to insure the concetration of antibiotics.
Fluorescence Observation
More cells in GA are expressing green fluorescence, compare to picture we took at Sept. 1.
Which indicate that the selection of antibiotics is still processing. We still have to keep working on the T2 cells.
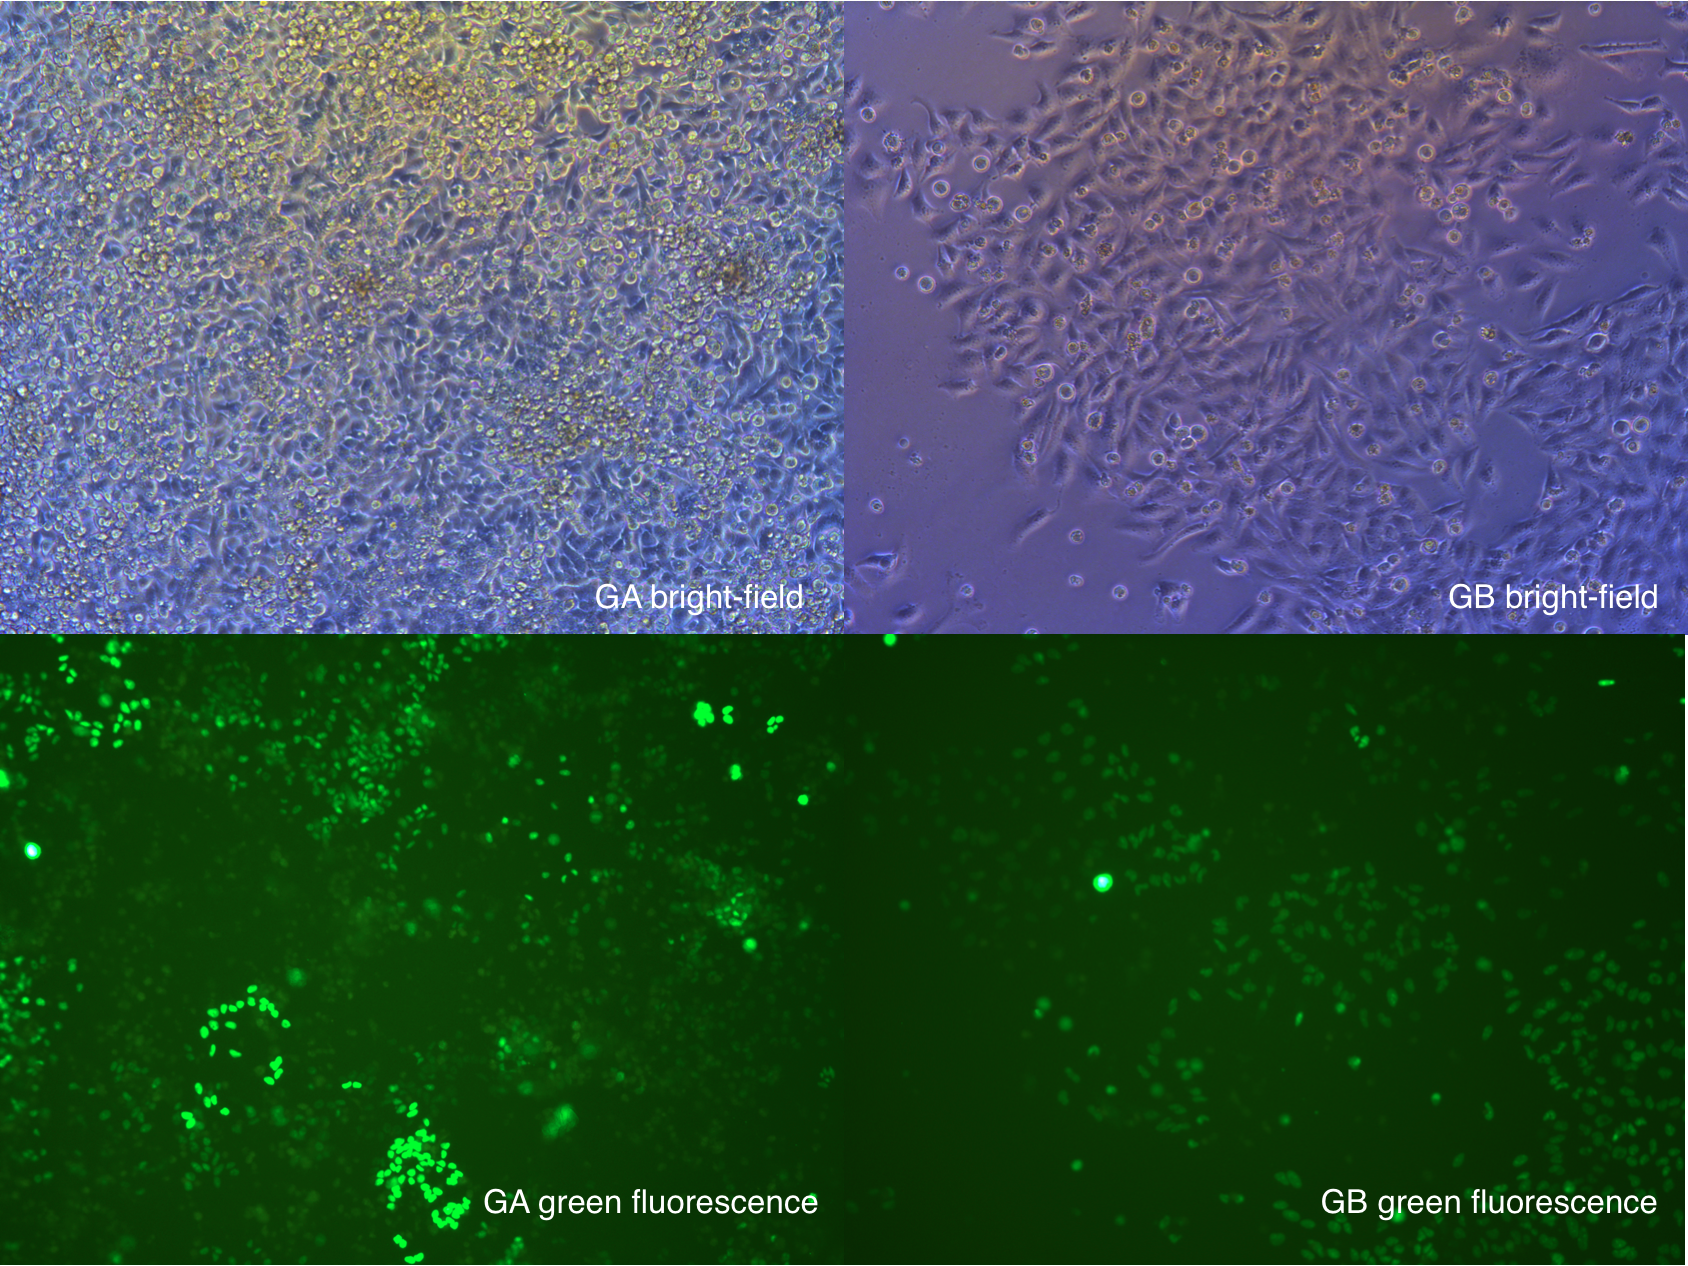
Figure 33. GA GB pool cells Sept.3
Sept 3rd
Freezing T1 stable cells
As we have created and tested our newly constructed cell-line, we must prepare multiple frozen aliquots to ensure a renewable source of cells.
Before we start freezing, we took picture under fluorescent microscope.
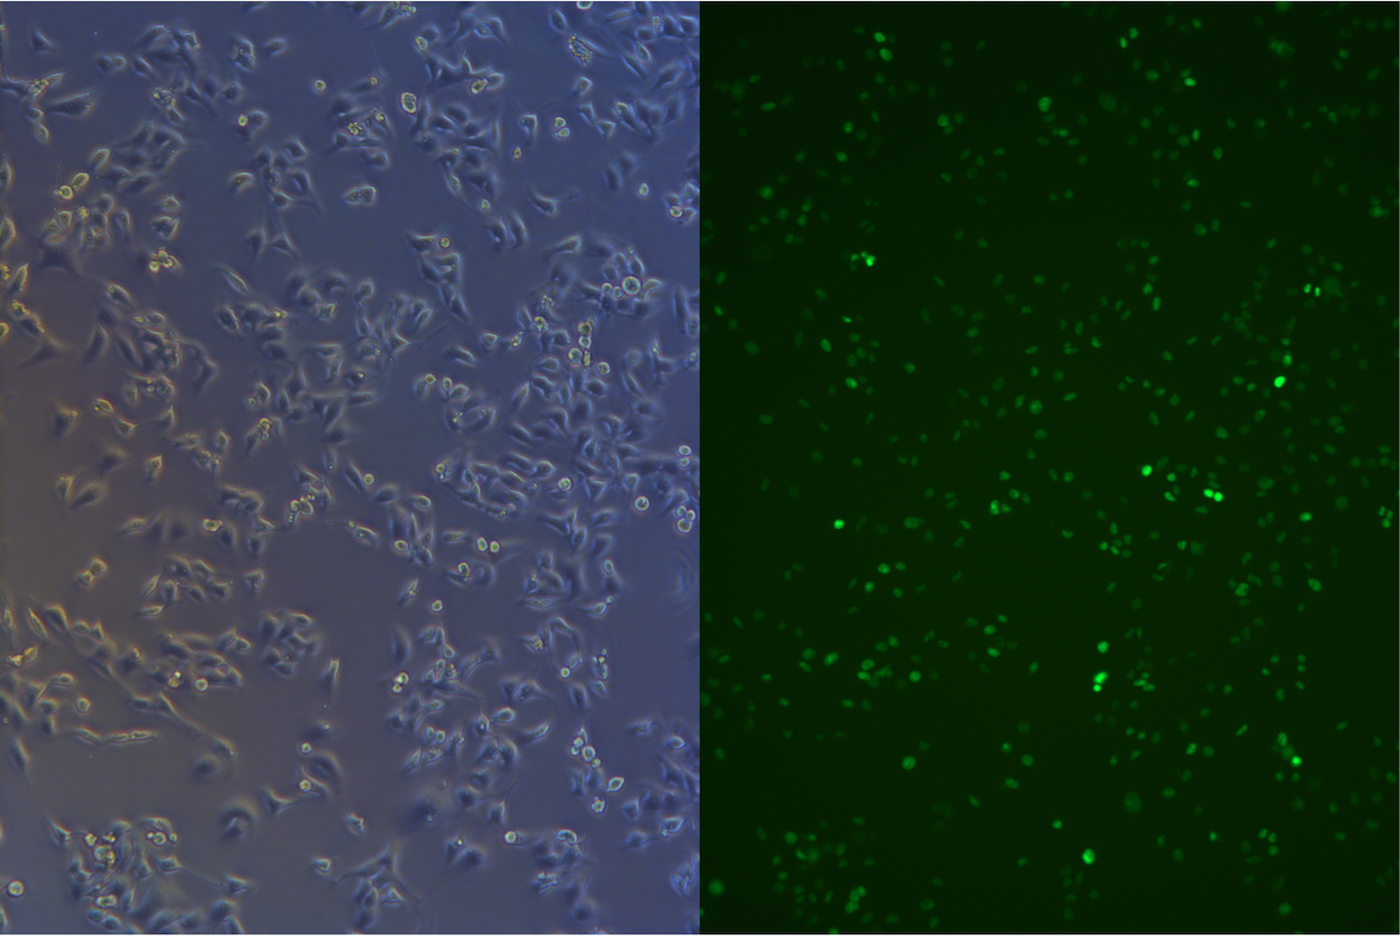
Figure 34. G1 pool before freezing. This picture taken under microscope indicate that almost every cell has expressed green fluorescence.
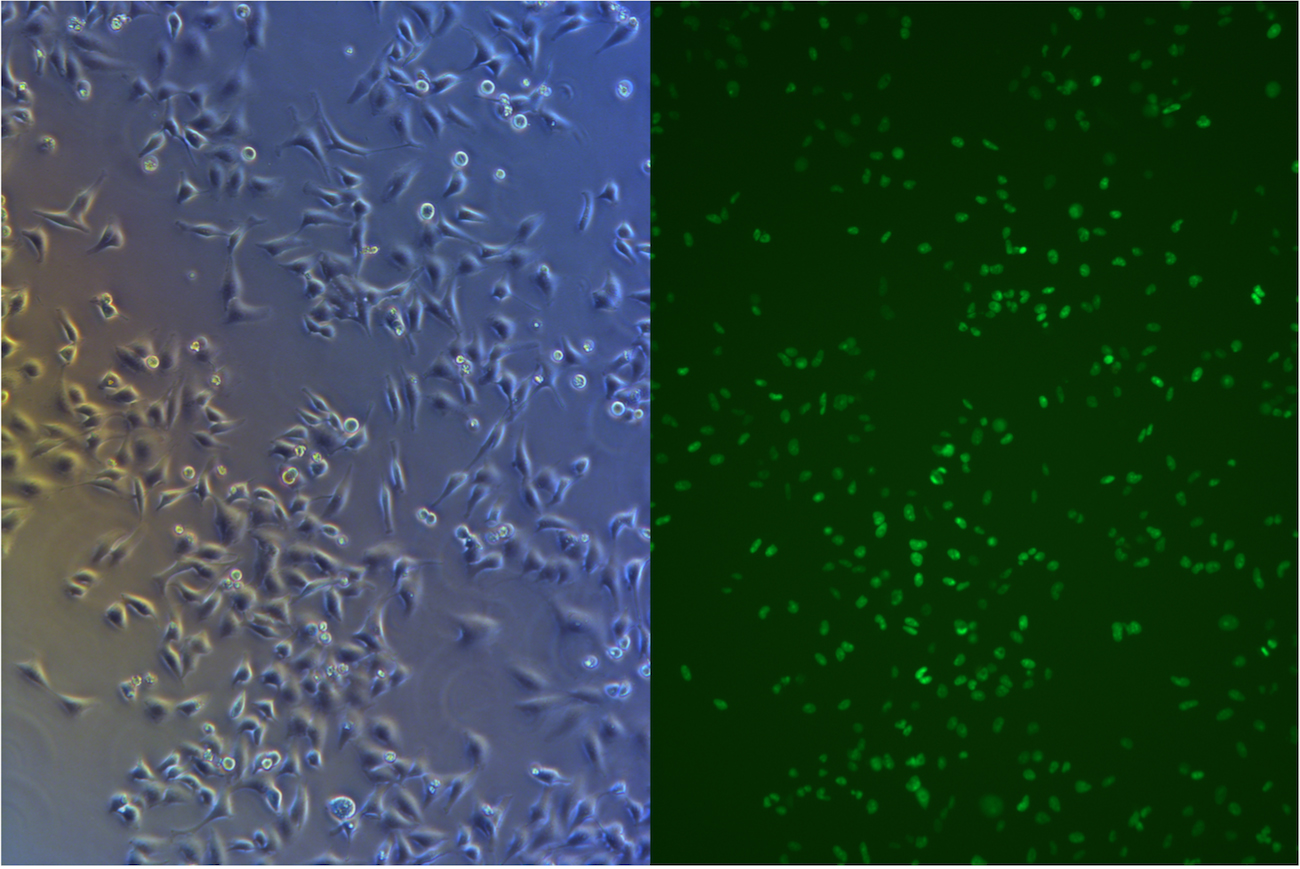
Figure 35. G3 pool before freezing. This picture taken under microscope indicate that almost every cell has expressed green fluorescence.
Materials
- 10cm petri plate seeden with 5 groups of stable new cell-line.
- DMSO
- FBS
- DMEM
- Cryovials
- Nalgene® Mr. Frosty® Freezing Container
Procedures
- Rinse the plate twice with PBS to remove any floating cells and wash out all medium.
- Trypsinize and pool all of the cells.
- Centrifuge the cells at 800 rpm for 5 min. Aspirate the supernatant.
- Resuspend the pellet in freezing medium with pipette. Use 20% FBS, 70% DMEM, and 10% DMSO.
- Dispense 1 ml aliquots into sterile cryovials and place vials in Nalgene frezing containers, and freeze at –80°C overnight.
- The next day, remove the vials from the container, and place in liquid nitrogen storage for storage.
Result
After we place vials into container we forget to put container into -80°C, instead we place it at -20°C overnight. Experiment failed.
We have left a little fraction of cells seeding in T-25 flask. So we passage them to 10cm petri dish for expand and next freezing.
Pick monoclones
Clones on the plate for pick monoclones have grown into a big monoclone. So we pick up those clones and passage to 24-well-plate. Culture those monoclones and do experiment. Because monoclones have better stability.
Materials
- Complete medium
- 200μl pipette tip
- 24-well-plate
- PBS
- Trypsin
- PYREX™ Cloning Cylinders
Procedures
Procedure
- Examine the culture dish containing well-isolated clones with a microscope. Locate those with a good condition considerable population.
- Once satisfactory colonies have been located, draw a circle around them on the bottom of the dish with a marking pen. Select colonies that are of bigger size (bigger represent quicker growth rate) and well isolated from other colonies.
- Remove and discard the growth medium. Rinse the plate twice with PBS to remove any floating cells and wash out all medium.
- Using sterile tweezer pick up a cloning cylinder. Gently press the flat bottom of the cylinder into the sterile vaseline and remove with a sudden vertical motion. If done properly, this will give even distribution of grease on the bottom of the cylinder. Set the cylinder over a colony. Gently press the cylinder down evenly with the tweezer. Uneven pressure will cause the grease seal to leak. Be very careful not to slide the cylinder across the colony. This will smear the silicone grease over the cells and prevent the trypsin from contacting them.
- Verify positioning of the cylinder over the colony with the microscope. Make sure there are no other colonies within the sealed area in the cylinder.
- Add about 20μL of the 0.25% trypsin to the cloning cylinder.
- Incubate the dish at 37°C for 3 minutes. Then examine cells under the microscope make sure that cells have been round up and come off the dish bottom. Add a few drops of growth medium to the cylinder and gently aspirate the cells with a pipette.
- Transfer the cells to a suitable culture vessel and add the appropriate volume of medium. Colonies are seeded in well from a 24well plate. It may be necessary to rinse the cylinder with additional medium to remove cells left after the initial transfer.
- Incubate cells as usual.
Source: (Freshney, R. I. (1994). Culture of Animal Cells: A Manual of Basic Technique. Third edition, Wiley-Liss, Inc. New York, pages 166 – 171.)
Result
We pick up about 6 clones each group. And seed in 24wells.
Sept 4th
Flow cytometer mearsure
Because of failed cells' freezing, there are not enough T1 cells to have a flow cytometer test, we measured T2 cells.
Sept 6th
[2014 Spet 6th]
Microscope Observation
Monoclones
Some of the monoclones grows very fast, sufficient to passage to bigger well and do further experiment.
Sept 8th
[2014 Spet 8th 2:40]
Microscope Observation
Original HeLa cells
Untransfected HeLa cells find medium infected with bacteria.
So we discard all those cells.

Figure 36. Picture we take under microscope, small spot are bacterias.
T2 cells
- T2-GA is 50-60% confluent, well status and shape.
- T2-GB is 30–50% confluent, well status and shape.
- T2-GC-group cells' density is very high.
Sept 9th
The 25th day after transfection
Freeze cells
- We freeze half of our T1 cells.
1 vial each group.
So 5 vials at total.
Spet 10th
Passage monoclones
Some of monoclones grows in 24 well plate is a little bit dense, so we decided to passage those monoclones to 6 6-well-plate.
Result
Passaged:
- G1 6 clones
- G2 6 clones
- G3 6 clones
- G4 4 clones
Sept 14th
Microscope Observation
- G1
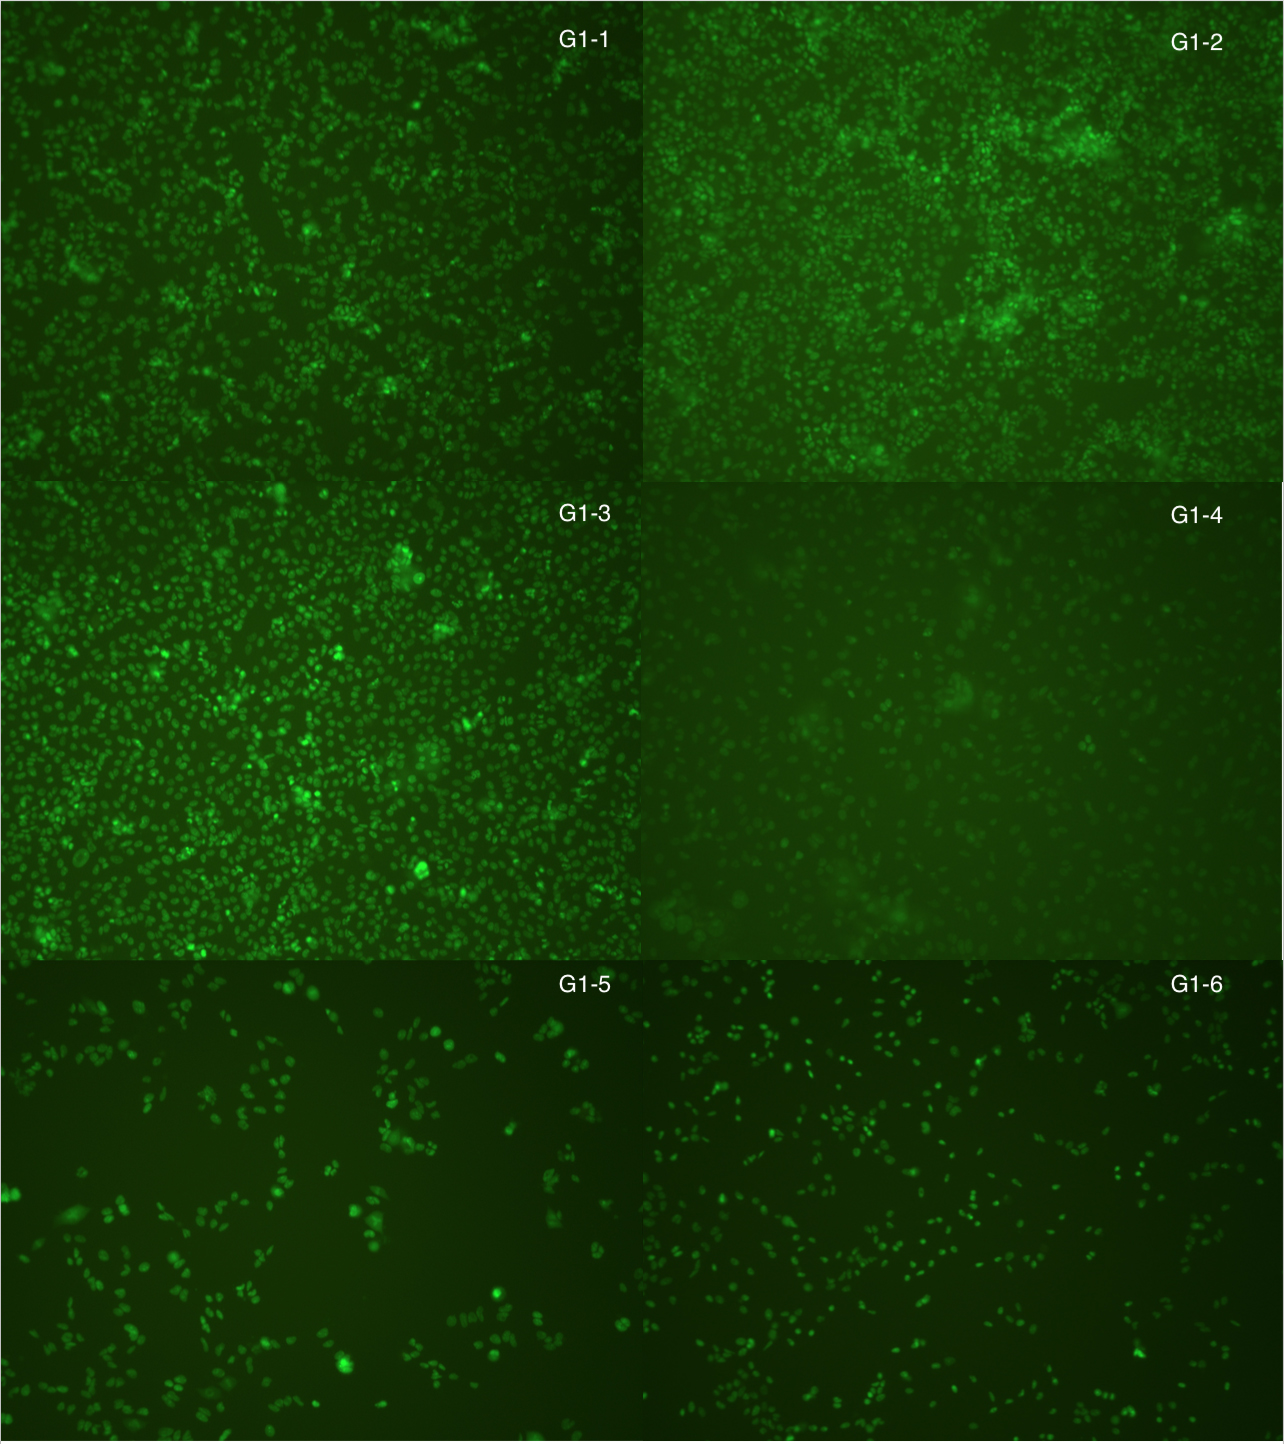
Figure 37. Picture of monoclones G1 under microscope
- G2

Figure 38. Picture of monoclones G2 under microscope
- G3
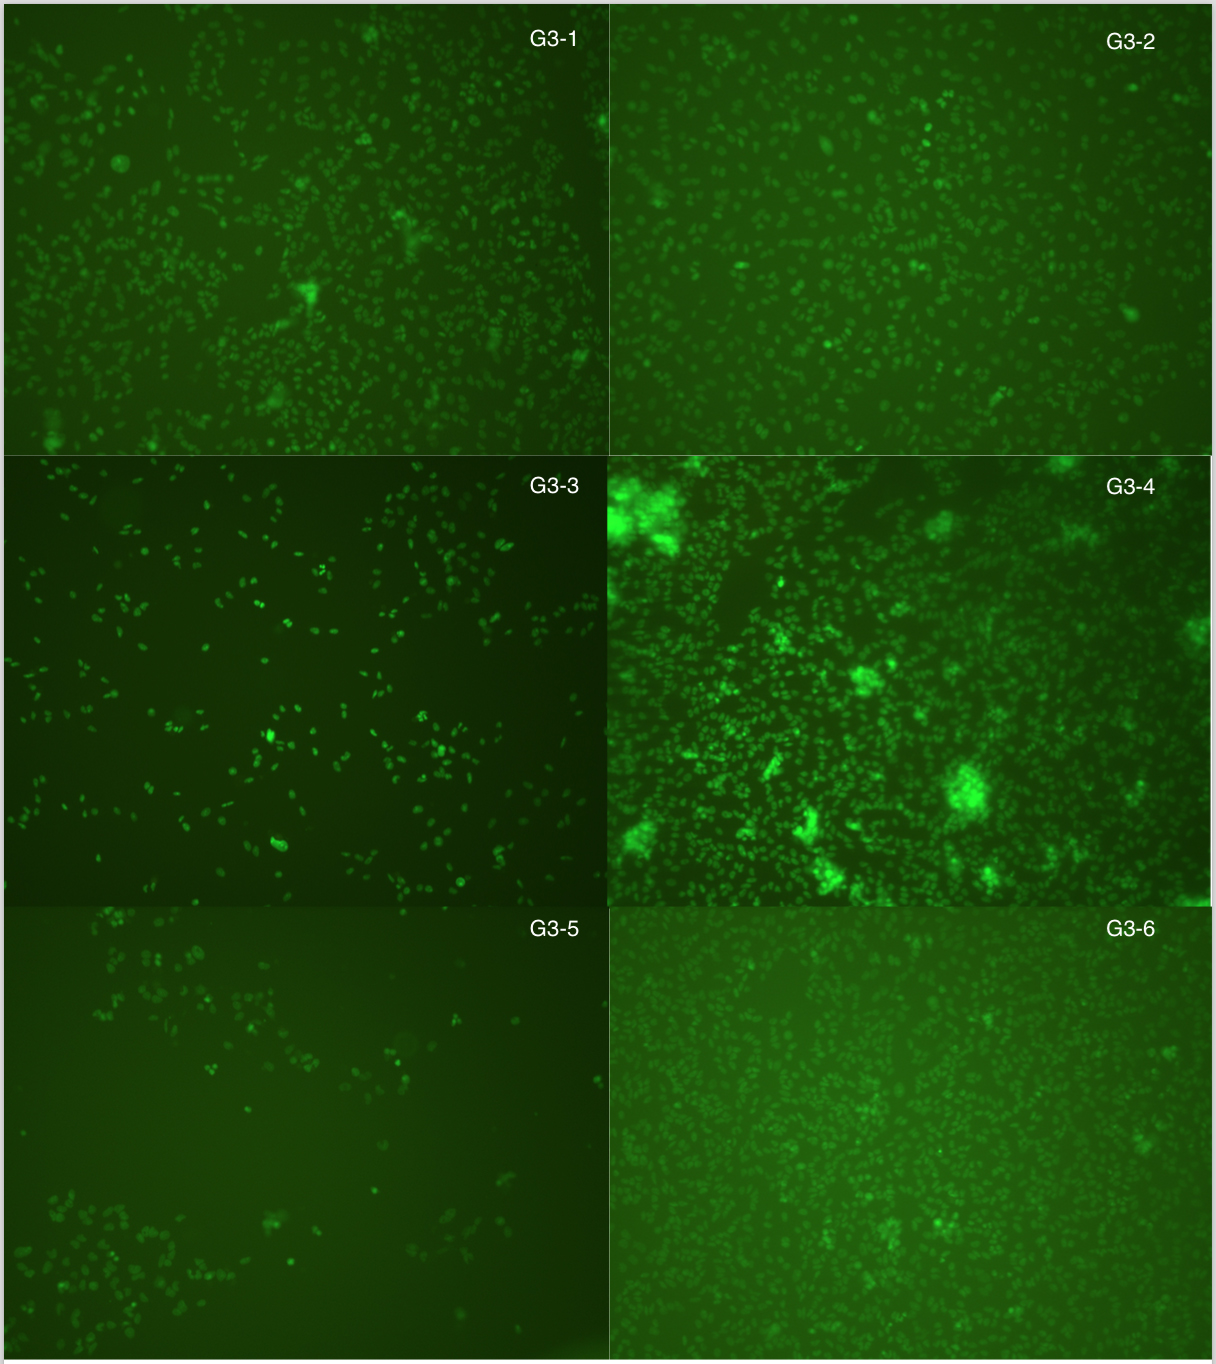
Figure 39. Picture of monoclones G3 under microscope
- G4
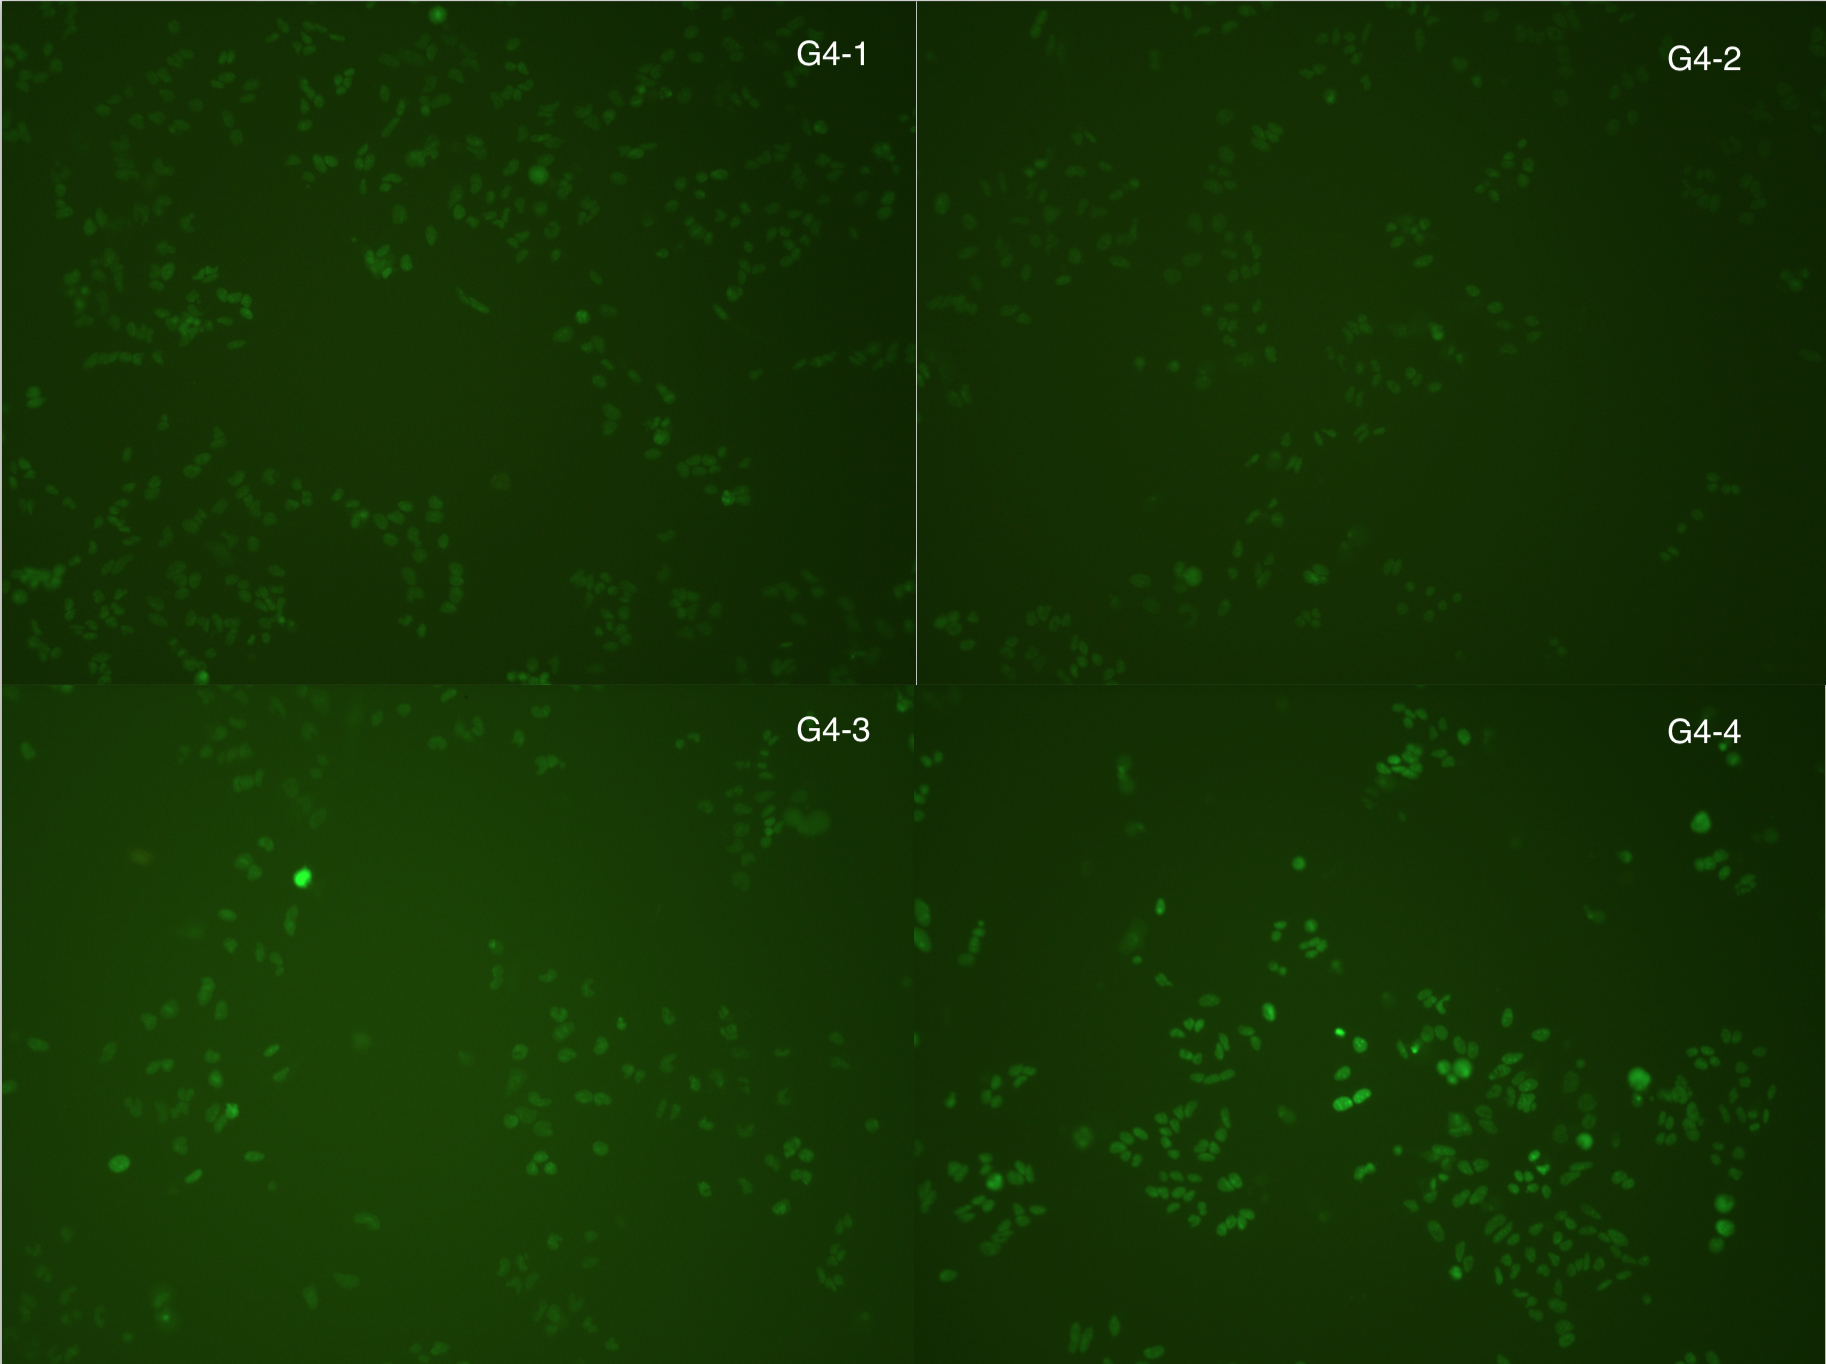
Figure 40. Picture of monoclones G4 under microscope
Sept 19th
Microscope Observation
Monoclones
- G1
- Too dense
- Too dense
- Too dense
- Too dense
- Grow slowly
- Grow slowly
- G2
- Too dense
- Kind of dense
- Grow slowly
- Good
- Many dead cells
- Grow slowly
- G3
- Dense
- Dense but normal
- good
- Too high density with many dead cells
- Normal but uneven
- Very dense
- G4
- Grow slowly, some dead cells
- Gorw slowly, some dead cells
- Gorw slowly, some dead cells
- Gorw slowly, some dead cells
Flow Cytometry
We mearsured G1 G3 and wild-type HeLa cells, flow cytometer protocol is set based on wild-type
Materials
- PBS
- Trypsin
- 300 mesh filter
- Complete medium
- Flow Cytometry tubes 10*80
- Backman Coulter Gallios
Protocol
- Remove and discard the growth medium. Rinse the plate twice with 200μL PBS to remove any floating cells and wash out all medium.
- Add about 100μL of the 0.25% trypsin to well in 24-well-plate, or 1ml to 10cm petri dish and aspirate after 30s.
- Trypsinize 1-2min at 37°C
- Add 400μL complete medium per well or 4ml per petri dish to neutrualize trypsin stop trypsinize.
- Gently suspend with Pasteur tube or pepitte.
- Pepite 500μL into EP tubes.
- Centrifuge for 5min at 800rpm.
- Aspirate supernatant and add 500μL PBS to suspend pellet filt with 300mesh filter.and pepite to Flow cytometry tubes. Mark well and carefully.
Result
We set protocol of flow cytometer was set by wild-type HeLa cells as blank.

Figure 41. The voltage of scensers is set according to ordinaty HeLa cells. The image shows the result.

Figure 42. This shows the green fluorescence of G1 cells, the sharp peak on the right side of picture represent 'almost every cells has fluorescence. In second chart Y axis represent the cell count, X axis represent green fluorescent intensity.

Figure 43. Same as G1, almost every G3 pool cell expresses green fluorescent protein.
Conclution
We can conclude from all those data above, that our new cell line, expressing green fluorescence is successfully construct. Both the pool cells and monoclones cells are stably transfected with EGFP gene.
It is perfect to use this cell line to have further expriement !