 "
"
Team:SUSTC-Shenzhen/Notebook/CRISPR/Verifications-for-struggles-for-our-second-time-Fill-in
From 2014.igem.org
Notebook
Elements of the endeavor.
Verifications for 'struggles for our second- time Fill-in'
2014/8/13~2014/8/18
Verifications for 'struggles for our second- time Fill-in'
Verification with EcoRI, MfeI
After analyzing, we extrapolated that G 5,6 might be a successful one, since this plasmid only digested with EcoRI hadn’t been cut into two fragments and seemed similar to the original plasmid. Other situations (double digestion, digestion with MfeI ) were too complicated to infer any valid information.
Verifications for 'struggles for our second- time Fill-in' with EcoRI, MfeI
Materials
Enzymes: EcoRI & MfeI Buffer: Buffer 2.1
Methods
Digestion system:(ul)
| MfeI & EcoRI | Total volume | DNA | Buffer 2.1 | MfeI | EcoRI | ddH2O |
|---|---|---|---|---|---|---|
| G (1) 689ng/ul | 10 | 2.2 | 1 | 1.5 | 1.5 | 3.8 |
| G (2) 754ng/ul | 10 | 1.9 | 1 | 1.5 | 1.5 | 4.1 |
| MfeI / EcoRI | Total volume | DNA | Buffer 2.1 | MfeI / EcoRI | ddH2O |
|---|---|---|---|---|---|
| G (1) 689ng/ul | 10 | 2.2 | 1 | 1.5 | 5.3 |
| G (2) 754ng/ul | 10 | 1.9 | 1 | 1.5 | 5.6 |
Incubate at 37°C for 4hours
Results of electrophoresis
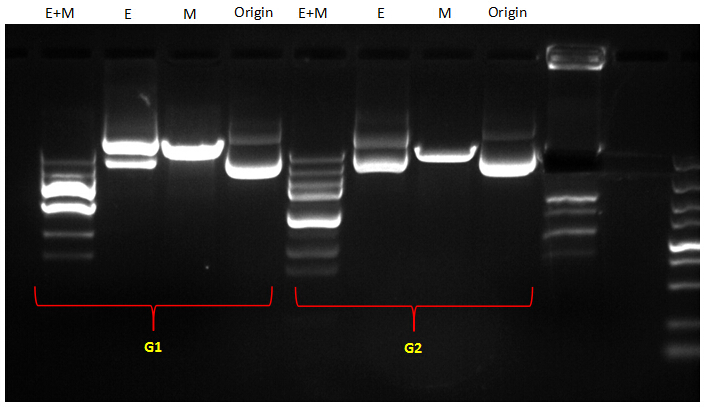
The bands of G1 were to compliated to analyze. For G2, according to our assumption, If the EcoRI site had been filled out, the profile of its bands should be congruent to that of the original plasmid; if not, it should be aligned to that of the M digestion. From the picture, we can see that except for the abnormal bands of double digestion (EcoRI and MfeI), the other DNA bands along single digestion tracks could roughly imply that the EcoRI site had been removed from the plasmid by Fill-in. Because the bands of EcoRI digestion were similar to those of the original plasmid which hadn’t been digested by any restriction enzymes. While the very band of MfeI digestion was obviously behind those of E digestion and original plasmid, indicating that digestion with MfeI had linearized the plasmid.
Verifications for 'struggles for our second- time Fill-in' with EcoRI, AgeI, PstI
Materials
Enzymes:EcoRI & MfeI
Buffer:2.1 cutsmart
Methods
Digestion system:[unit: ul]
| PstI & EcoRI | Total volume | DNA | Buffer 2.1 | PstI | EcoRI | ddH2O |
|---|---|---|---|---|---|---|
| G (1) 689ng/ul | 10 | 2.2 | 1 | 1.5 | 1.5 | 3.8 |
| G (2) 754ng/ul | 10 | 1.9 | 1 | 1.5 | 1.5 | 4.1 |
| AgeI & EcoRI | Total volume | DNA | Buffer cutsmart | AgeI | EcoRI | ddH2O |
|---|---|---|---|---|---|---|
| G (1) 689ng/ul | 10 | 2.2 | 1 | 1.5 | 1.5 | 3.8 |
| G (2) 754ng/ul | 10 | 1.9 | 1 | 1.5 | 1.5 | 4.1 |
| AgeI/ EcoRI/PstI | Total volume | DNA | Buffer | AgeI/ EcoRI/PstI | ddH2O |
|---|---|---|---|---|---|
| G (1) 689ng/ul | 10 | 2.2 | 1 | 1.5 | 5.3 |
| G (2) 754ng/ul | 10 | 1.9 | 1 | 1.5 | 5.6 |
Results of electrophoresis
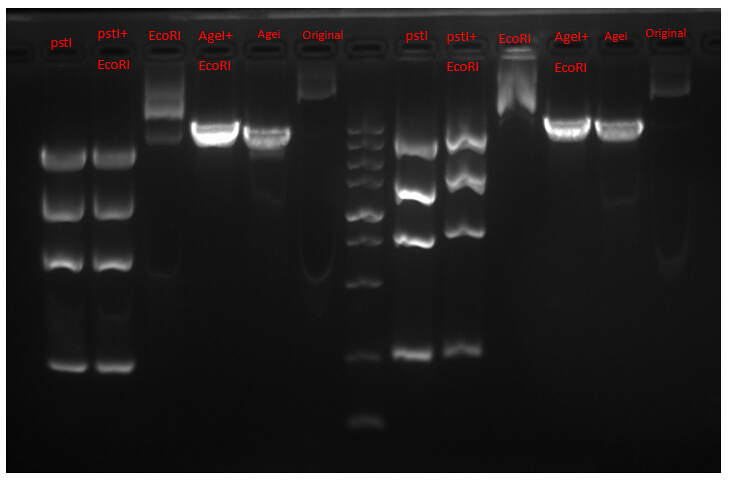
Since we did this verification before we got the plasmid profile of G. We designed this scheme according to the profile of plasmid Poly A. As a result, the final graph showed a constitution entirely different from our prediction. Thus, we did the next vertification.
Verifications for 'struggles for our second- time Fill-in'with EcoRI, NotI, MfeI, EcoRV
Materials
Enzymes:EcoRI, MfeI, NotI, EcoRV
Buffer: Cutsmart , Buffer2.1
Methods
Digestion system:[unit: ul]
| NotI & EcoRI | Total volume | DNA | Buffer 2.1 | NotI | EcoRI | ddH2O |
|---|---|---|---|---|---|---|
| G (1) 689ng/ul | 10 | 2.2 | 1 | 1.5 | 1.5 | 3.8 |
| G (2) 754ng/ul | 10 | 1.9 | 1 | 1.5 | 1.5 | 4.1 |
| MfeI & EcoRI | Total volume | DNA | Buffer Cutsmart | MfeI | EcoRI | ddH2O |
|---|---|---|---|---|---|---|
| G (1) 689ng/ul | 10 | 2.2 | 1 | 1.5 | 1.5 | 3.8 |
| G (2) 754ng/ul | 10 | 1.9 | 1 | 1.5 | 1.5 | 4.1 |
| NotI/ EcoRI/MfeI | Total volume | DNA | Buffer 2.1 | NotI/ EcoRI/MfeI | ddH2O |
|---|---|---|---|---|---|
| G (1) 689ng/ul | 10 | 2.2 | 1 | 1.5 | 5.3 |
| G (2) 754ng/ul | 10 | 1.9 | 1 | 1.5 | 5.6 |
Results of electrophoresis
Total plasmid: 7000bp
Position of sites:
EcoRI: 1960bp
MfeI: 3819bp
NotI(1): 1695bp
NotI(2): 3825bp
Supposed situation:
E+M digestion:
Success: a linearized 7000bp fragment
Fail: 7000bp*, 5000bp, 2000bp (flag of failure)
E+N digestion:
Success: 7000*, 4900, 2100
Fail: 7000*, 5000*,2000, 260 (flag of failure)
Note: ‘ * ‘ labeled the bands that may appear due to deficient digestion.
Actual results
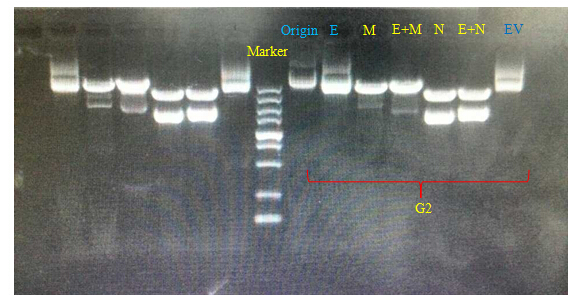
Bands of E were almost aligned with those of original plasmids and plasmids digested with EcoRV.
Bands of E+M were exactly the same with those of M single digestion system.
Bands of E+N were exactly the same with those of N single digestion system.
The lack of 2000bp band along E+M track
The lack of 260bp band along E+N track
The profile of E+M matches the successful anticipated map. (a linearized 7000bp fragment)
The profile of E+N matches the successful anticipated map. (490bp, 2100bp)
All of the above items indicated the successful removal of EcoRI site on our G1,G2 plasmids.