 "
"
Team:ETH Zurich/expresults/qs
From 2014.igem.org
Quorum Sensing
For our Mosiacoli project, we were looking for molecular systems that allow orthogonal cell-to-cell communication in order to implement connected XOR logic gates. We decided to exploit the quorum sensing systems LuxI/LuxR, LasI/LasR, and RhlI/RhlR in order to achieve the required orthogonal cell-to-cell communication. We developed a model for these cellular information processing. Even though the corresponding inducer molecules are commercially available and the systems often used, in particular in iGEM projects (e.g. pLux (BBa_R0062), 'Top 10 Most used promoters' with 246 uses), potential crosstalk activity between the different systems may be a severe problem (e. g. Tokyo_Tech 2013, Peking University 2011).
In order to address this challenge, we measured a) a given promoter with its corresponding regulator and a different inducer molecule, b) a given promoter with an unspecific regulator and a particular inducer, c) a given promoter with both regulator and inducer being unspecific, and always included the correct combination of inducer molecule, regulator and promoter as a positive control. This gives in total 27 possible combinations. The output was assessed via sfGFP and measured in terms of fluorescence on microtiter-plate scale.

Summary of experimental results regarding quorum sensing
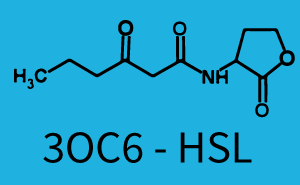
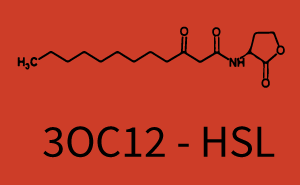
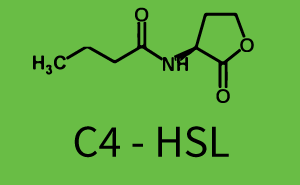
The following matrices serve as an overview summarizing the most significant results of our experiments to characterize crosstalk on different levels. On the horizontal top row we see the three different inducer molecules (3OC12-HSL, 3OC6-HSL, C4-HSL). In the top left corner we see the quorum sensing promoter used for all the experiments summarized in this matrix. On the vertical axis we see the three regulators ( LuxR, LasR, RhlR). These matrices are giving an overview of the experimental results conducted in relation with quorum sensing and crosstalk. The graph shown in each matrix on the very top left describes the situation where the correct autoinducer molecule has bound the corresponding regulator and this complex has then induced the correct promoter. The solid lines in the graphs show the model data, whereas the data points indicated with standard deviation show experimental data in triplicates (mean values of triplicate micro titerplate measurements).
|
In all the measurements conducted to create this matrix the promoter pLux was the basis and was induced in six different variations shown. The dark blue points in the graph top left show the activation of gene expression when pLux is induced by 3OC6-HSL (Lux-AHL) binding to the corresponding LuxR regulator. The observed transition occurs at a concentration of approximately 1 nM of 3OC6-HSL. The light-blue curve plotted shows modeling data of pLux induced by 3OC6-HSL (Lux-AHL) binding to the corresponding LuxR regulator. This curve from the model and the dark blue data points obtained from experiments were plotted as a reference in all the other graphs describing pLux. Crosstalk can be observed for the cases where the 3OC12-HSL (Las-AHL) binds the LuxR regulator. Additionally for 3OC12-HSL binding to its corresponding regulator LasR and then binding to the pLux as seen in the middle of the top row and center of the matrix. For the case of Las-AHL binding the regulator LasR and subsequently the promoter pLux, the transition occurs at 1 nM and reaches 0.5 fold the fluorescence as pLux induced by 3OC6-HSL binding LuxR. In the case of 3OC12-HSL binding LuxR and inducing the promoter pLux, the transition is observed at approximately 100 nM and severe crosstalk is observed, meaning that the ON-OFF-ratio is not significantly different from the reference curve. Observation of C4-HSL has shown, that there is no significant crosstalk with the LuxR regulator and LasR regulator binding C4-HSL and subsequently to pLux. This is indicated on top right and middle right graphs. However, RhlR induced with its corresponding inducer (C4-HSL) binds to pLux and activates expression of GFP at about 100 nM. | |||
| 
| 
| 
|

| 
| 
| 
|

| 
| 
| 
|

| 
| 
| 
|
|
The promoter of interest in this matrix is pLas. The graph on top left corner shows the induction of pLas by its corresponding inducer (3OC12-HSL) binding the corresponding LasR. The red line shows the model whereas the datapoints shown in red represent the experimental results. The transition can be observed at a concentration of Las-AHL of about 2 nM. 3OC6-HSL binding RhlR does not induce the pLas. For the binding of 3OC12-HSL to RhlR a minor increase of fluorescence can be observed. The same can be observed for 3OC12-HSL binding to the LuxR as this combination is to a small degree inducing pLas. The most significant case of crosstalk when observing pLas is shown in the graph in the center of the matrix. It is clearly shown that 3OC6-HSL (Lux-AHL) binding to the corresponding LuxR regulator is able to induce pLas, resulting in fluorescence values of about 250 a.u.. This is the most severe case of crosstalk observed as the induction of pLas by the corresponding inducer and regulator molecule is not significantly different measured by fluorescence as induction by Lux-AHL binding the LuxR and subsequently pLas. For C4-HSL binding the three regulators LasR, LuxR and RhlR and then the pLas no crosstalk can be observed. | |||
|
|
|
|
|
| 
| 
| 
|
|
| 
| 
| 
|
|
| 
| 
| 
|
|
In this set of experiments the promoter pRhl was tested for potential crosstalk. In the top left position we observe the induction of pRhl by C4-HSL bound to the regulator RhlR. The switching behaviour was observed at a C4-HSL concentration of 1 μM. In the case of 3OC12-HSL binding the RhlR regulator and subsequently the promoter pRhlinsignificant crosstalk has been observed. Severe crosstalk was observed in the case of 3OC6-HSL binding the RhlR regulator followed by induction of pRhl. The transition occurred at a concentration of the inducer molecule of 1 μM but compared to the reference curve a lower value of fluorescence per OD was observed (1000 a.u.). Another case of crosstalk with the pRhl was detected with 3OC12-HSL binding to the corresponding LasR regulator followed by inducing the promoter pRhl. Here switching occurred at a concentration 1 nM of 3OC12-HSL and reached fluorescence per OD of 750 a.u.. This is approximately 0.5 fold the value of the fluorescence per OD shown by the reference curve indicated in green. | |||
|
|
|
|
|
| 
| 
| 
|
|
| 
| 
| 
|
|
| 
| 
| 
|
Conclusion of crosstalk experiments
As shown in the graphs in the matrices above, we found and quantitatively characterized all three levels of crosstalk. The three levels were the following:
- A given promoter with its corresponding regulator and a different inducer molecule
- A given promoter with an unspecific regulator and a particular inducer
- A given promoter with both regulator and inducer being unspecific
Unspecific inducers binding to the regulators as well as unspecific binding of the regulator to another promoter species was observed in almost all possible combinations. To conclude, we were not able to find an orthogonal quorum sensing pair out of the three systems investigated (LuxI/LuxR, LasI/LasR, or RhlI/RhlR). While we see a significant effect when implementing the influence of these crosstalks (on an inducer-, regulator- and promoter-level) in our whole cell model, the logic gate still continues to function for a range of inputs at physiological concentrations.