"
"
Team:Oxford/how much can we degrade
From 2014.igem.org
(Difference between revisions)
Olivervince (Talk | contribs) |
Olivervince (Talk | contribs) |
||
| Line 798: | Line 798: | ||
<br><br> | <br><br> | ||
| + | <img src="https://static.igem.org/mediawiki/2014/6/6c/Oxford_DCMdeg18.png" style="float:left;position:relative; width:60%; margin-left:20%; margin-right:20%;margin-bottom:2%;" /> | ||
| + | |||
The graph here is for non specific inputs and is for demonstration purposes only. It shows well how the model responds to changing the input values. | The graph here is for non specific inputs and is for demonstration purposes only. It shows well how the model responds to changing the input values. | ||
<br><br> | <br><br> | ||
Revision as of 22:23, 21 September 2014
#list li { list-style-image: url("https://static.igem.org/mediawiki/2014/6/6f/OxigemTick.png"); } }

How much can we degrade?
Introduction
Before we began using synthetic biology to develop methods for chlorinated waste disposal through bioremediation, we thought that it was important to work towards an answer to the above question. To do this, we used information from the literature (WHAT LITERATURE?) about the native bacteria (Methylobacterium extorquens DM4).We then worked on a large model to calculate both the pH change of the system and the volume of DCM degraded over time. This was achieved by using a combination of Michaelis-Menten kinetics, ordinary differential equations and stoichiometric relations.

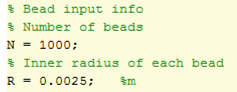
1) Obtaining theoretical growth curve
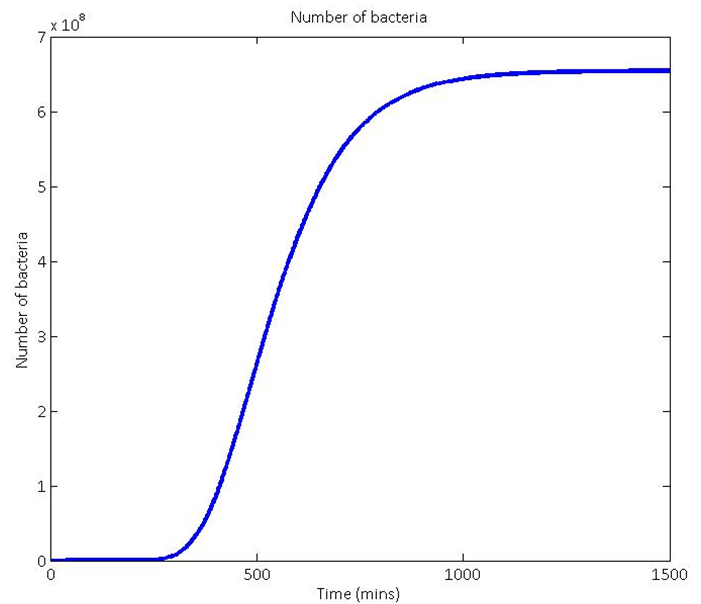
To start this calculation, we needed to know how many bacteria we could reasonably expect to have in our system. To do this, we used reasonable bead dimensions and reasonable bead numbers to calculate the volume of bacteria infused agarose that we were likely to have in the system. We then used the assumption that the bacteria would grow to an optimum density of 10^7 bacteria per ml of agarose (REFERENCE) and combined these to give us an approximation of how to scale the growth curve:
Our theoretical growth curves were based on Gompertz functions for the reasons explained when you follow this link: (what are Gompertz functions?). An example output growth curve of the model is shown here.
The scaling of the growth rate of the Gompertz function comes directly from growth curves of the DM4 bacteria that we obtained in the lab. See more about our work with growth curves here.
2) Calculating the volume of DCM that these bacteria could degrade
Our next task was to model the rate of DCM degradation by the average bacteria. Using Michaelis-Menten kinetics[1], this was predicted to be:
Through the use of diffusion-limiting beads, [DCM] is kept constant at 0.02M. This is significantly larger than our Michaelis constant so this equation can be simplified by using the following assumptions:
 Multiplying this by our population function, the total rate of DCM molecule degradation is given as:
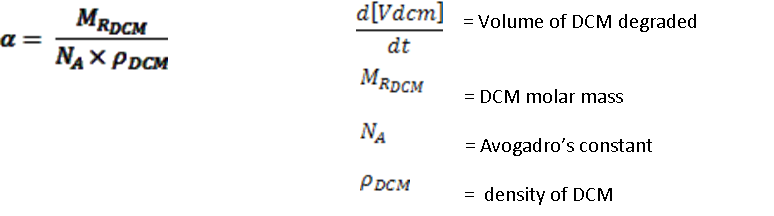
 Turning this into a more recognisable value (a volume) gives the total rate of DCM degradation as:
 Where:
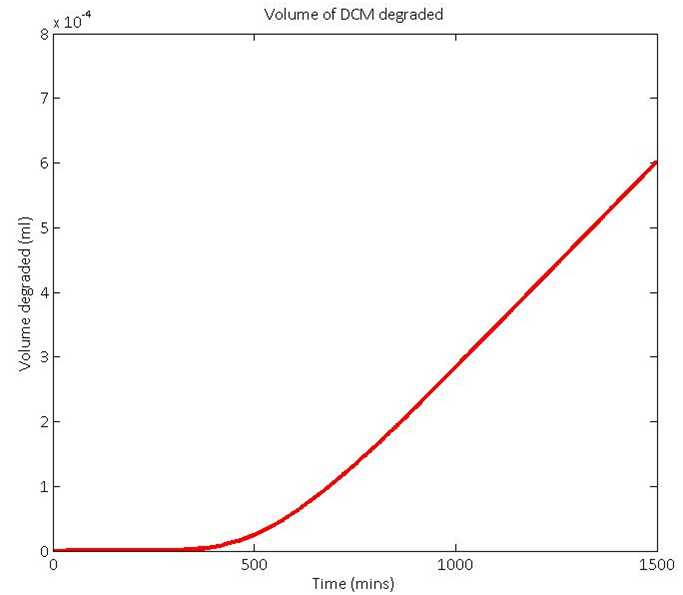
 When all of these calculations were modelled in Matlab with the input conditions shown above, the total volume of DCM that we would predict the native bacteria DM4 to degrade in 24 hours is shown by the red line below. This is before you account for the possible toxicity of the pH drop. This is taken into account in the sections below.
Reference:
1. Michaelis L. and Menten M.L. Kinetik der Invertinwirkung Biochem. Z. 1913; 49:333–369 English translation Accessed 6 April 2007
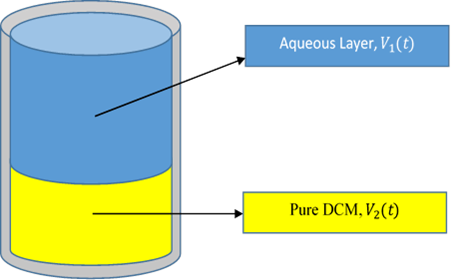
The degradation of DCM by DcmA produces hydrochloric acid (HCl) according to the reaction below: 
 There is a resulting pH change as a result of this. Because we are dealing with an organic system which cannot tolerate excessive acidity (pH<6), we must track the anticipated HCl production and resulting pH change.
The following relationships were used:
There is a resulting pH change as a result of this. Because we are dealing with an organic system which cannot tolerate excessive acidity (pH<6), we must track the anticipated HCl production and resulting pH change.
The following relationships were used:
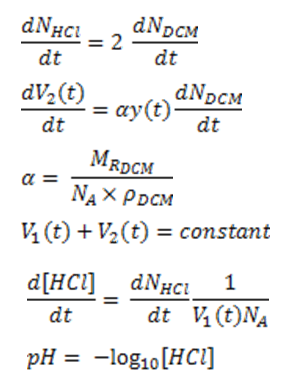
These equations were then simulated using a series of linked functions on MatLab and the results are displayed below:
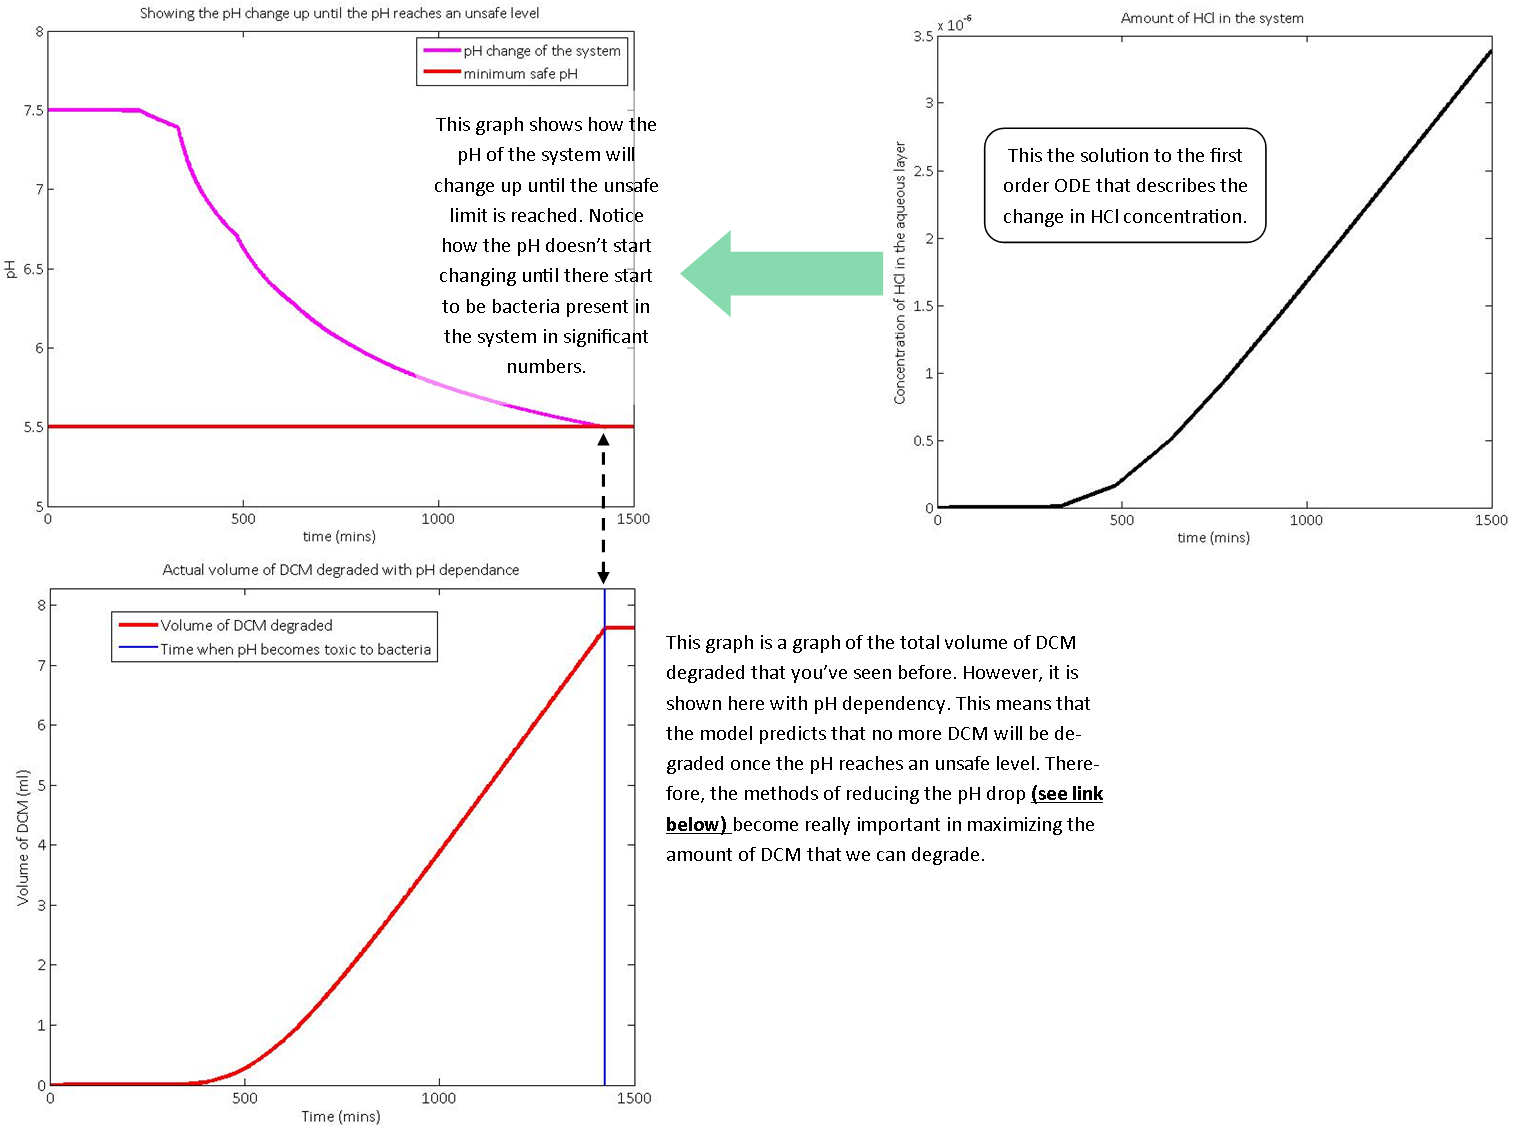
Summary:
As you can see from the above graph, the native bacteria (Methylobacterium extorquens DM4) will not be able to degrade a large volume of DCM. This bacteria will not be suitable for our purposes as the solution to chlorinated waste disposal. There are several reasons for this, these include:However, using synthetic biology, we can dramatically increase the amount of chlorinated solvents that certain bacteria can degrade. This is because:
This model proves the power of computer modelling and shows the importance of using synthetic biology to solve global problems.
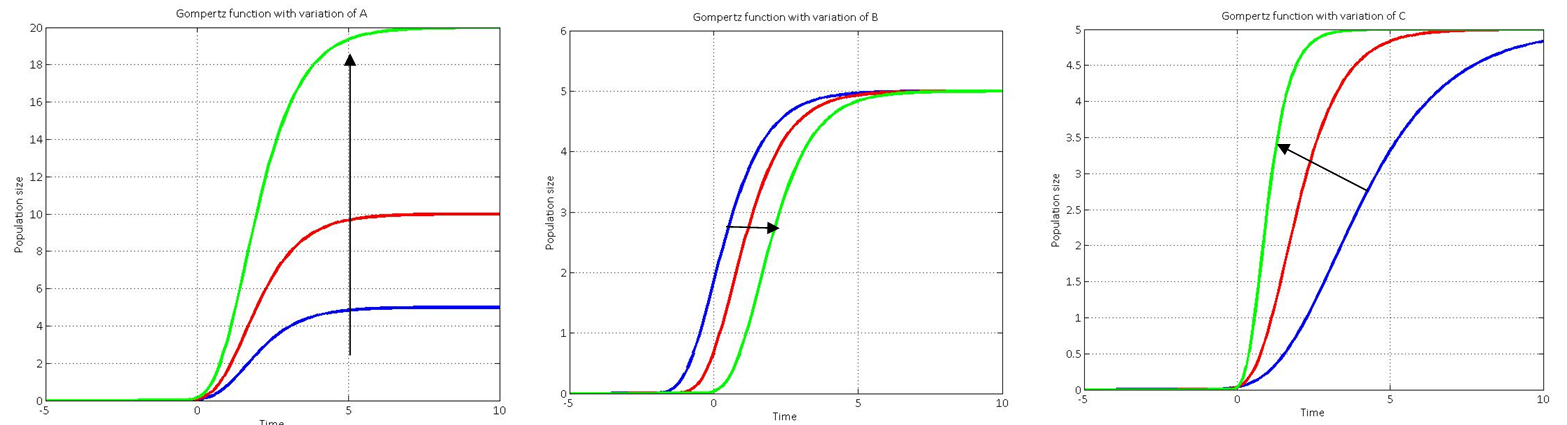
We used a variation of a sigmoid function called a Gompertz function to model the theoretical growth of our bead-encapsulated bacterial population. These functions are well established[1] as a method of predicting population growth in a confined space, as birth rates first increase and then slow as resource limits are reached. As this is how our bacteria will be growing (when confined in the beads), we took this information and assumed that the bacteria’s population over time will follow one of these functions (when scaled correctly).
Gompertz functions are of the form:
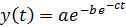
Using this theoretical form, we could then calibrate the values of our variables through comparison with actual growth curve data from wet lab experiments. This was an important step because it would then allow us to calculate the total theoretical degradation rate of DCM that our kit could support.
Varying each of the three constants allows us to fit our Gompertz function to the actual growth data. The effect of varying each constant is shown below:
Reference:
Zwietering, M. H.; Jongenburger, I.; Rombout, F. M.; van 't Riet, K. (1990), "Modeling of the Bacterial Growth Curve", Applied and Environmental Microbiology 56 (6): 1875–1881
As one of the products of our reaction is hydrochloric acid, we have been able to calculate the pH change of the system. However, as pH change is bad for the bacteria, we have investigated the effect of using pH buffers in the aqueous part of our system.
The pH change of our system in the presence of the buffer HEPES is described by:
 Upon solving the equation in Matlab, it was clear that only a relatively low concentration (0.05 M) of buffer was needed to significantly reduce the pH change of the solution:
 The other method of reducing the overall pH change is adding much more water to the system at the start. This is the easiest and cheapest method, indeed it could be used for single use DCM disposal kits. However it is impractical in large scale applications due to the huge advantages of using buffer. On the other hand, because the buffer itself is toxic in high enough concentrations, a compromise between the amount of water added and buffer concentration had to be reached.
We then used our model to predict the effect on the system if you simply increased the amount of water in the aqueous layer. It does show how much water is necessary to prevent the pH change being too large and helps show how useful adding a pH buffer to the aqueous solution would be.
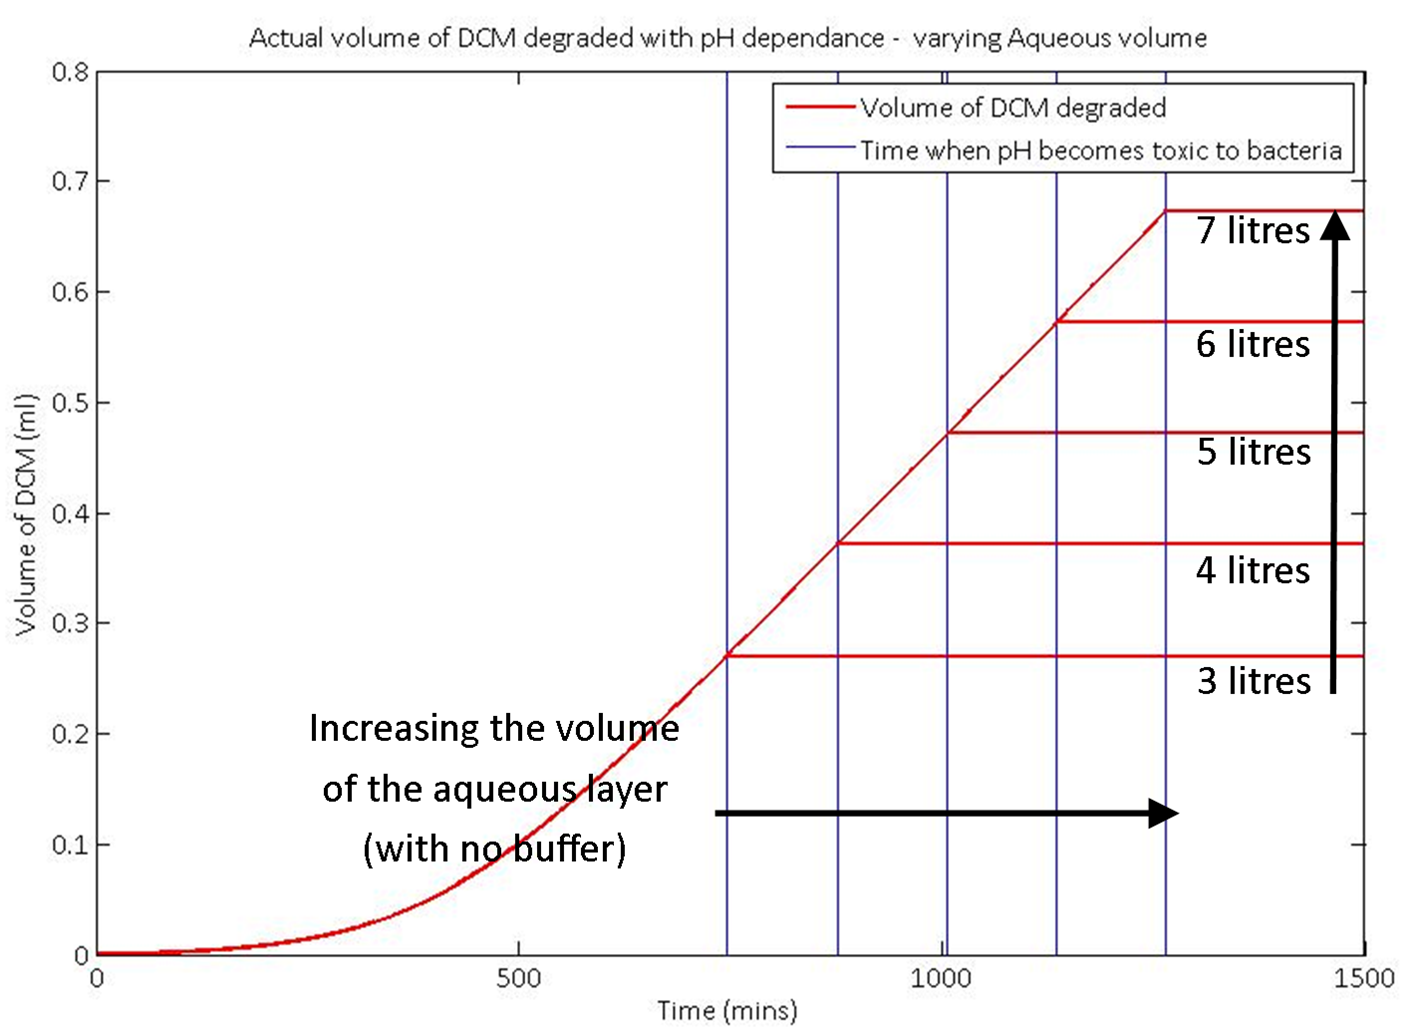 The graph here is for non specific inputs and is for demonstration purposes only. It shows well how the model responds to changing the input values.
Buffers?