"
"
Team:Oxford/biosensor characterisation
From 2014.igem.org
(Difference between revisions)
Olivervince (Talk | contribs) |
|||
| Line 497: | Line 497: | ||
<img src="https://static.igem.org/mediawiki/2014/c/c9/Oxford_data4.png" style="float:right;position:relative; width:50%;margin-left:0%;margin-right:0%;" /> | <img src="https://static.igem.org/mediawiki/2014/c/c9/Oxford_data4.png" style="float:right;position:relative; width:50%;margin-left:0%;margin-right:0%;" /> | ||
<br><br> | <br><br> | ||
| - | The parameters that we need to calculate are the constants in the | + | The parameters that we need to calculate are the constants in the differential equation that governs the behaviour of the first half of the genetic circuit. This half of the system is shown again here to remind the reader which part we are considering. |
<br><br> | <br><br> | ||
These parameters are: | These parameters are: | ||
| Line 506: | Line 506: | ||
<li>β1 = Basal transcription rate of <font style="font-style: italic;">dcmR</font></li> | <li>β1 = Basal transcription rate of <font style="font-style: italic;">dcmR</font></li> | ||
<br><br> | <br><br> | ||
| - | Remember that because the mCherry gene is tagged onto the end of the <font style="font-style: italic;">dcmR</font> gene, | + | Remember that because the mCherry gene is tagged onto the end of the <font style="font-style: italic;">dcmR</font> gene, therefore <font style="font-style: oblique;"> the mCherry fluorescence will be the same as the DcmR production</font> from the <font style="font-style: italic;">dcmR</font> gene. Due to the transcriptional fusion of the mCherry gene onto the <font style="font-style: italic;">dcmR</font> gene, we can assume that the mCherry protein (and therefore the fluorescence) will degrade with the same rate as the DcmR protein. However, there is not very comprehensive data in the literature about the values that we can expect from the behaviour of the <font style="font-style: italic;">dcmR</font> gene. |
| + | |||
<br><br> | <br><br> | ||
| - | To calculate the degradation rate of the mCherry protein, we turned to the literature as this is a well documented area of synthetic biology. The graph on the above right shows how the fluorescence of the protein decays with time and data in the source document identifies the half-life as 96 seconds. | + | <h1>Degradation constant and the basal transcription rate</h1> |
| + | The initial steady state of the system (before ATC has been added) is determined by two constants in the model. These constants are the degradation constant of DcmR and the basal transcription rate of the system. | ||
| + | |||
| + | To calculate the degradation rate constant of the mCherry protein, we turned to the literature as this is a well documented area of synthetic biology. The graph on the above right shows how the fluorescence of the protein decays with time and data in the source document identifies the half-life as 96 seconds. | ||
<br><br> | <br><br> | ||
This graph was sourced from <a href="http://www.tsienlab.ucsd.edu/Publications/Shaner%202005%20Nature%20Methods%20-%20Choosing%20fluorescent%20proteins.pdf">here</a>. | This graph was sourced from <a href="http://www.tsienlab.ucsd.edu/Publications/Shaner%202005%20Nature%20Methods%20-%20Choosing%20fluorescent%20proteins.pdf">here</a>. | ||
Revision as of 08:25, 14 October 2014


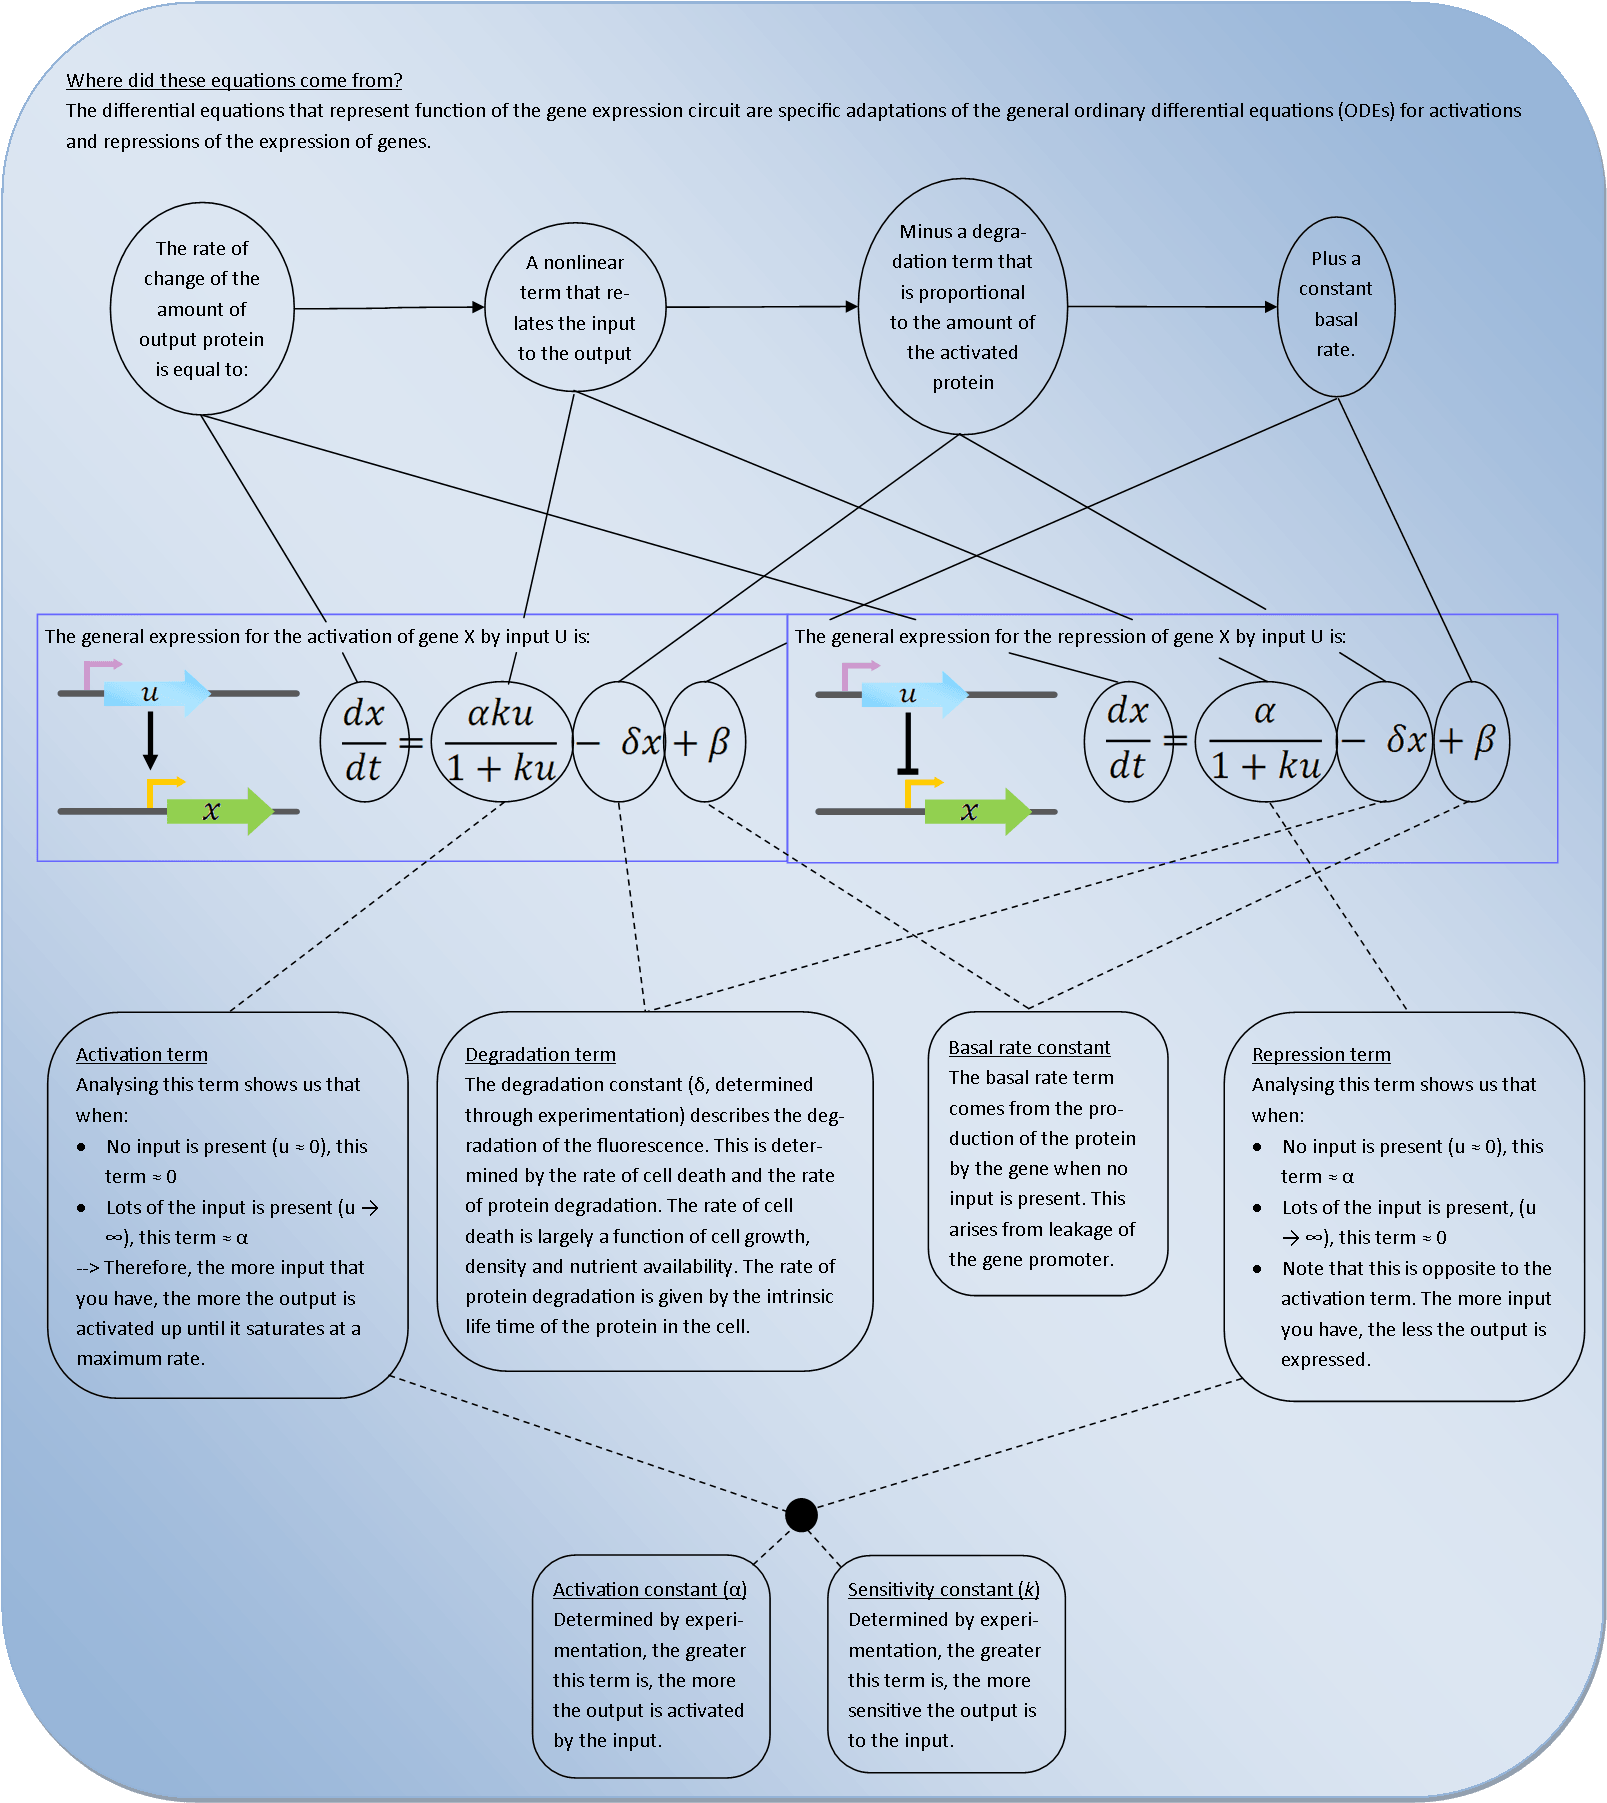
 Deterministic models are very powerful tools for synthetic biology. They describe the behaviour of the bacteria at the population level and use Ordinary Differential Equations (ODEs) to relate each activation and repression. By constructing a cascade of differential equations one can build a realistic model of the average behaviour of the system.


 Oxford iGEM 2014