 "
"
Team:Imperial/Induction Model
From 2014.igem.org
| (23 intermediate revisions not shown) | |||
| Line 11: | Line 11: | ||
<div id="subNav"> | <div id="subNav"> | ||
<ul> | <ul> | ||
| - | <li><a href="#introduction | + | <li><a data-scroll href="#introduction" >Introduction</a> |
</li> | </li> | ||
| - | + | ||
| - | <li><a href="#maths | + | <li><a data-scroll href="#maths">Mathematical Background</a> |
</li> | </li> | ||
| - | <li><a href="# | + | <li><a data-scroll href="#results">Results & Conclusions</a> |
</li> | </li> | ||
| - | <li><a href="# | + | <li><a data-scroll href="#references">References</a> |
</li> | </li> | ||
| - | + | <li><a data-scroll href="#code">Appendix: Code</a> | |
| - | + | ||
| - | + | ||
</li> | </li> | ||
| + | |||
</ul> | </ul> | ||
<br class="clearLeft" /> | <br class="clearLeft" /> | ||
| Line 31: | Line 30: | ||
<section id="introduction"> | <section id="introduction"> | ||
<h2>Introduction</h2> | <h2>Introduction</h2> | ||
| - | <p>The ATCC53582 can be induced by IPTG to | + | <p>This model was designed to investigate the effect of induction on overall bacterial cellulose (BC) yield and it was used to assist the wetlab by proposing means for improving BC yield within an experiment time frame. The ATCC53582 <em>Gluconacetobacter</em> can be induced by isopropyl β-D-1-thiogalactopyranoside (IPTG) to alter its enzymatic activities, increasing the proportion of nutrients diverted to BC production. After being induced, the ratio of nutrients directed to BC production to that to cell growth will increase and a variation in induction time will inevitably result in a change in overall BC yield. With a set of ordinary differential equations (ODEs), the model predicts the maximum BC yield and cell population profiles for different induction time points. As a result, the model provides an effective approach to approximate the optimal induction time under specific experimental conditions, which significantly enhances the efficiency of BC production (please refer to <a href="https://2014.igem.org/Team:Imperial/EColi"><em>E. coli</em></a>, induction experiments for further information).</p> |
| - | <p>The model | + | <p>The model consists of two parts: the first part approximately predicts the profiles for BC production, substrate (glucose) consumption, BC-producing cell population and mutant (dormant) cell population at each induction time. The model simulation is experiment-specific as optimal induction time varies with both initial substrate concentration and the time frame allowed for the experiment. As an output, part one of the model will generate 1) a plot of maximum BC yield achievable within the experiment time frame against induction time, and 2) a plot for the time necessary to achieve maximum BC yield against induction time.</p> |
| + | <p>Based on the estimation provided by part one of the model, the second part takes advantage of the integrated form of the ODEs and generates a series of more precisely calibrated profiles at a given induction time (i.e. the optimal induction time approximated by model part one). The profiles of substrate consumption, cell population and BC production can be easily interpreted and inform the wetlab experiments with a refined estimation so that the efficiency of BC production process can be better understood.</p> | ||
| + | |||
</section> | </section> | ||
<section id="maths"> | <section id="maths"> | ||
<h2>Mathematical Background</h2> | <h2>Mathematical Background</h2> | ||
| - | <h3>Model | + | <h3>Model part one (ODE simulation):</h3> |
<ul> | <ul> | ||
| - | <li>Variables: | + | <li>Dependent Variables: |
<ul> | <ul> | ||
| - | <li>P<sub>plus</sub>(t): population of | + | <li>P<sub>plus</sub>(t): population of BC producing cells at time t</li> |
| - | <li>P<sub>minus</sub>(t): population of mutant cells (dormant cells producing no bacterial cellulose)</li> | + | <li>P<sub>minus</sub>(t): population of mutant cells (dormant cells producing no bacterial cellulose) at time t</li> |
| - | <li>BC(t): | + | <li>BC(t): BC yield at time t</li> |
| - | <li>S(t): substrate (glucose) concentration</li> | + | <li>S(t): substrate (glucose) concentration at time t</li> |
| - | <li>O(t): oxygen level | + | <li>O(t): oxygen level at time t</li> |
</ul> | </ul> | ||
</li> | </li> | ||
<li>Parameters: | <li>Parameters: | ||
| - | + | <ul> | |
| - | + | <li>Kd: mutation rate from BC producing cells to mutant (dormant) cells</li> | |
| - | <li>Vp: maximum rate of cell population change achieved by the system, parameter in Michaelis-Menten kinetics</li> | + | <li>Vp: maximum rate of cell population change achieved by the system, parameter in Michaelis-Menten kinetics</li> |
| - | <li>Kp: Michaelis constant in rate equation for cell population change, parameter in Michaelis-Menten kinetics</li> | + | <li>Kp: Michaelis constant in rate equation for cell population change, parameter in Michaelis-Menten kinetics describing the enzymatic activities involved in substrate consumption</li> |
| - | <li>K<sub>O<sub>2</sub></sub>: Michaelis constant in rate equation for cell population change, parameter in Michaelis-Menten kinetics</li> | + | <li>K<sub>O<sub>2</sub></sub>: Michaelis constant in rate equation for cell population change, parameter in Michaelis-Menten kinetics describing the enzymatic activities involved in oxygen consumption</li> |
| - | <li>Kd<sub>plus</sub>: death rate of | + | <li>Kd<sub>plus</sub>: death rate of BC producing cells</li> |
| - | <li>Vc: maximum rate of | + | <li>Vc: maximum rate of BC yield achieved by the system, parameter in Michaelis-Menten kinetics</li> |
| - | + | <li>Kc: Michaelis constant in rate equation for BC production, parameter in Michaelis-Menten kinetics describing the enzymatic activities involved in substrate consumption</li> | |
| - | + | <li>K<sub>up</sub>: together with O(t), the term (K<sub>up</sub>+O(t))/K<sub>up</sub> captures the upregulating effect of oxygen on bacterial cellulose yield</li> | |
| - | <li>Kd<sub>minus</sub>: death rate of mutant (dormant) cells</li> | + | <li>Kd<sub>minus</sub>: death rate of mutant (dormant) cells</li> |
| - | <li>K<sub>growth</sub>: substrate consumption rate of cell population</li> | + | <li>K<sub>growth</sub>: substrate consumption rate of cell population</li> |
| - | <li>K<sub>BC</sub>: substrate consumption rate of | + | <li>K<sub>BC</sub>: substrate consumption rate of BC production</li> |
| + | |||
| - | |||
</ul> | </ul> | ||
</li> | </li> | ||
| - | <li> | + | <li>ODEs: |
| - | + | <ul> | |
| - | <li>Rate of change of | + | |
| - | <li>Rate of change of mutant (dormant) cells production:<img class="content-image" src="https://static.igem.org/mediawiki/2014/3/37/IC14-modelling-induction-rate2.png" height= | + | <li>Rate of change of BC producing cells population:<img class="content-image" src="https://static.igem.org/mediawiki/2014/a/a7/IC14-modelling-induction-rate1.png" height=70></li> |
| - | <li>Rate of | + | <li>Rate of change of mutant (dormant) cells production:<img class="content-image" src="https://static.igem.org/mediawiki/2014/3/37/IC14-modelling-induction-rate2.png" height=70></li> |
| + | <li>Rate of BC production:<img class="content-image image-equation" src="https://static.igem.org/mediawiki/2014/f/f4/IC14-modelling-induction-rate3.png" height=100></li> | ||
<li>Rate of substrate (glucose) consumption:<img class="content-image image-full" src="https://static.igem.org/mediawiki/2014/3/3b/IC14-modelling-induction-rate4.png"></li> | <li>Rate of substrate (glucose) consumption:<img class="content-image image-full" src="https://static.igem.org/mediawiki/2014/3/3b/IC14-modelling-induction-rate4.png"></li> | ||
| - | + | ||
| - | </ul></li> | + | </ul> |
| + | </li> | ||
</ul> | </ul> | ||
| + | <h3>Model part two (integrated form):</h3> | ||
| + | <p>The simulation of part one of the induction model provides an approximation of the optimal induction time for which overall BC yield is maximised. This induction time will then serve as an input to the second part of the model, where an integrated form of the rate equations are used to predict more detailed profiles for BC production, substrate consumption and cell population.</p> | ||
| + | <ul> | ||
| + | <li>Solutions: | ||
| + | <ul> | ||
| + | <li> | ||
| + | <img class="content-image " src="https://static.igem.org/mediawiki/2014/d/da/IC14-modelling-induction-interact1.png" height="70px"> | ||
| + | </li> | ||
| + | <li> | ||
| + | <img class="content-image " src="https://static.igem.org/mediawiki/2014/0/02/IC14-modelling-induction-interact2.png" height="70px"> | ||
| + | </li> | ||
| + | <li> | ||
| + | <img class="content-image " src="https://static.igem.org/mediawiki/2014/6/62/IC14-modelling-induction-interact3.png" height="70px"> | ||
| + | </li> | ||
| + | <li> | ||
| + | <img class="content-image " src="https://static.igem.org/mediawiki/2014/8/88/IC14-modelling-induction-interact4.png" height="70px"> | ||
| + | </li> | ||
| + | </ul> | ||
| + | </li> | ||
| + | <li>Dependent Variables: | ||
| + | <ul> | ||
| + | <li>P(t): total cell population, all cells produced since starting time</li> | ||
| + | <li>P<sub>plus</sub>(t) : BC producing cell population.</li> | ||
| + | |||
| + | |||
| + | </ul> | ||
| + | |||
| + | |||
| + | </li> | ||
| + | <li>Parameters | ||
| + | <ul> | ||
| + | <li>K<sub>maintain</sub>: maintenance coefficient, a measurement of the substrate consumption rate to maintain the BC producing cell population (viable cells). This is an added feature in model part two.</li> | ||
| + | |||
| + | <li>Experiments were set up to determine P<sub>0</sub>, P<sub>max</sub>, µ<sub>BC</sub>, µ<sub>P</sub>, P<sub>plus,0</sub>, P<sub>plus,max</sub>, µ<sub>plus</sub>, K<sub>growth</sub>, K<sub>BC</sub>, and K<sub>maintain</sub> where these parameters obtained from experiments characterise the strain ATCC53582 specifically. The measurements taken to characterise the parameters include: the dry mass of bacterial cellulose being produced, glucose (substrate) level just below the pellicle and cell concentration.</li> | ||
| + | |||
| + | |||
| + | </ul> | ||
| + | |||
| + | |||
| + | </li> | ||
| + | |||
| + | |||
| + | |||
| + | |||
| + | |||
| + | |||
| + | |||
| + | |||
| + | |||
| + | |||
| + | </ul> | ||
| - | |||
| - | |||
| - | |||
| - | |||
| - | |||
| - | |||
| - | |||
| - | |||
| - | |||
| - | |||
| - | |||
| - | |||
| - | |||
| - | |||
| - | |||
</section> | </section> | ||
<section id="results"> | <section id="results"> | ||
<h2>Results and Conclusions</h2> | <h2>Results and Conclusions</h2> | ||
| - | <h3>Model | + | <h3>Model part one (ODE simulation):</h3> |
<figure class="content-image image-half"> | <figure class="content-image image-half"> | ||
<img class="image-full" src="https://static.igem.org/mediawiki/2014/3/3a/IC14-modelling-induction-model1-1.gif"> | <img class="image-full" src="https://static.igem.org/mediawiki/2014/3/3a/IC14-modelling-induction-model1-1.gif"> | ||
| - | <figcaption>Figure 1:</figcaption> | + | <figcaption>Figure 1: Effect of induction time on profiles for four dependent variables</figcaption> |
</figure> | </figure> | ||
| + | <p>*Key: +cell population = BC producing cell population; -cell population = dormant (mutant) cell population (not producing BC)</p> | ||
| + | <p>Figure 1 demonstrates the change in four dependent variable profiles as per induction time, simulated for 50 time points starting after 60 minutes with one hour as the time interval. The time frame simulated in the model is 50 hours long, with the y axis labelled with arbitrary units since the model is intended to provide relative values, rather than absolute values, which will be calculated in second part of the model. This part of the model (part one) provides an approximation of the optimal induction time by comparing maximum BC yield (within experiment time frame) at each induction time, and the corresponding time needed to achieve maximum yield.</p> | ||
| + | |||
| + | |||
<figure class="content-image image-half"> | <figure class="content-image image-half"> | ||
| - | <img class="image-full" src=" https://static.igem.org/mediawiki/2014/ | + | <img class="image-full" src="https://static.igem.org/mediawiki/2014/2/2e/IC14-modelling-induction-figure2.png"> |
| - | <figcaption>Figure 2:</figcaption> | + | <figcaption>Figure 2: Effect of induction time on maximum BC yield</figcaption> |
</figure> | </figure> | ||
| - | <p> | + | <p>As shown in figure 2, a maximum BC yield is exhibited when induced after around four hours of growth, during the growth (log) phase of cell cycle. If induced earlier than this time point, as illustrated in the movie above, cell growth will be delayed during lag phase and therefore a competent cell population will not be established to yield satisfactory amount of BC within the experiment time frame, which in this simulation is 50 hours. The maximum BC yield stays at a constant level when induction occurred after 10 hours and it is probably due to the fact that nutrient (substrate) is being depleted after around 10 hours.</p> |
| - | </p> | + | |
<figure class="content-image image-half"> | <figure class="content-image image-half"> | ||
| - | <img class="image-full" src="https://static.igem.org/mediawiki/2014/ | + | <img class="image-full" src="https://static.igem.org/mediawiki/2014/5/5b/IC14-modelling-induction-figure3.png"> |
| - | <figcaption>Figure 3:</figcaption> | + | <figcaption>Figure 3: Effect of induction time on time taken to reach maximum BC yield</figcaption> |
</figure> | </figure> | ||
| - | + | <p>Figure 3 illustrates the variation in time needed to achieve maximum BC production within the experiment time frame as per induction time. Similarly, the fact that time needed to achieve maximum BC yield stabilises after 10 hours of growth is also resulted from the depletion of nutrient (substrate).</p> | |
| - | + | <figure class="content-image image-half"> | |
| - | <img class="image-full" src="https://static.igem.org/mediawiki/2014/ | + | <img class="image-full" src="https://static.igem.org/mediawiki/2014/f/f1/IC14-modelling-induction-figure4.png"> |
| - | <figcaption>Figure 4:</figcaption> | + | <figcaption>Figure 4: Efficiency of BC production as a trade-off between maximum BC yield and corresponding time needed to achieve maximum yield as per induction time</figcaption> |
</figure> | </figure> | ||
| + | <p>Figure 4 illustrates the efficiency of BC production as a trade-off between maximum BC yield and corresponding time needed to achieve such yield at each induction time. It is observed that an induction occurred after seven hours will not only result in a relatively high yield but also save time in achieving this high yield. Again, due to depletion of nutrient, any induction occurred after 10 hours converges at the same point as the one induced at 10 hour time point.</p> | ||
| + | <h3>Model part two (integrated form):</h3> | ||
| + | <p>The above presented simulations are also adaptable to larger time scales (i.e. days). With appropriate boundary conditions, the provided model can be used to simulate the dependent variable profiles at a given induction time (e.g. the approximated optimal induction time point). This is explained further below:</p> | ||
<figure class="content-image image-half"> | <figure class="content-image image-half"> | ||
| - | <img class="image-full" src="https://static.igem.org/mediawiki/2014/ | + | <img class="image-full" src="https://static.igem.org/mediawiki/2014/4/42/IC14-modelling-induction-figure5.png"> |
| - | <figcaption>Figure 5:</figcaption> | + | <figcaption>Figure 5: BC yield over time</figcaption> |
</figure> | </figure> | ||
| - | |||
<figure class="content-image image-half"> | <figure class="content-image image-half"> | ||
| - | <img class="image-full" src="https://static.igem.org/mediawiki/2014/ | + | <img class="image-full" src="https://static.igem.org/mediawiki/2014/b/b6/IC14-modelling-induction-figure6.png"> |
| - | <figcaption>Figure 6:</figcaption> | + | <figcaption>Figure 6: Cell growth against time</figcaption> |
</figure> | </figure> | ||
| + | <p>For the cell concentration measurements, no difference has been made between BC producing cells and dormant (mutant) cells, as simulated in part one of the model. Total cell population thus considers an accumulation of all cells produced since starting point, and the viable cell population is an approximation of cell population in the oxygenated layer that are producing BC.</p> | ||
| + | <figure class="content-image image-half"> | ||
| + | <img class="image-full" src="https://static.igem.org/mediawiki/2014/3/32/IC14-modelling-induction-figure7.png"> | ||
| + | <figcaption>Figure 7: Nutrient consumption against time</figcaption> | ||
| + | </figure> | ||
| + | <p>As described in the mathematical background section, the nutrient profile presented here also takes cell maintenance consumption into consideration, which is a further refined feature specific for the second part of the model.</p> | ||
| + | |||
| + | |||
</section> | </section> | ||
| - | + | ||
<section id="references"> | <section id="references"> | ||
| - | < | + | <h2>References</h2> |
<ol> | <ol> | ||
<li>M. Hornung; M. Ludwig; A.M. Gerrard; H.-P. Schmauder Optimizing the Production of Bacterial Cellulose in Surface Culture: Evaluation of Substrate Mass Transfer Influences on the Bioreaction (Part 1) Eng. Life Sci. 2006, 6, No. 6, 537–545</li> | <li>M. Hornung; M. Ludwig; A.M. Gerrard; H.-P. Schmauder Optimizing the Production of Bacterial Cellulose in Surface Culture: Evaluation of Substrate Mass Transfer Influences on the Bioreaction (Part 1) Eng. Life Sci. 2006, 6, No. 6, 537–545</li> | ||
| - | + | ||
| Line 143: | Line 196: | ||
</ol> | </ol> | ||
</section> | </section> | ||
| - | + | <section id="code"> | |
| - | + | <h2>Appendix: Code</h2> | |
| - | + | ||
| - | + | <p>The code for this model can be found here: <a href="https://static.igem.org/mediawiki/2014/2/2f/Induction_model_imperial_igem_2014.m">Induction_model_imperial_igem_2014.m</a></p> | |
| - | + | </section> | |
| + | |||
</div> | </div> | ||
Latest revision as of 23:59, 17 October 2014
Induction Model
Introduction
This model was designed to investigate the effect of induction on overall bacterial cellulose (BC) yield and it was used to assist the wetlab by proposing means for improving BC yield within an experiment time frame. The ATCC53582 Gluconacetobacter can be induced by isopropyl β-D-1-thiogalactopyranoside (IPTG) to alter its enzymatic activities, increasing the proportion of nutrients diverted to BC production. After being induced, the ratio of nutrients directed to BC production to that to cell growth will increase and a variation in induction time will inevitably result in a change in overall BC yield. With a set of ordinary differential equations (ODEs), the model predicts the maximum BC yield and cell population profiles for different induction time points. As a result, the model provides an effective approach to approximate the optimal induction time under specific experimental conditions, which significantly enhances the efficiency of BC production (please refer to E. coli, induction experiments for further information).
The model consists of two parts: the first part approximately predicts the profiles for BC production, substrate (glucose) consumption, BC-producing cell population and mutant (dormant) cell population at each induction time. The model simulation is experiment-specific as optimal induction time varies with both initial substrate concentration and the time frame allowed for the experiment. As an output, part one of the model will generate 1) a plot of maximum BC yield achievable within the experiment time frame against induction time, and 2) a plot for the time necessary to achieve maximum BC yield against induction time.
Based on the estimation provided by part one of the model, the second part takes advantage of the integrated form of the ODEs and generates a series of more precisely calibrated profiles at a given induction time (i.e. the optimal induction time approximated by model part one). The profiles of substrate consumption, cell population and BC production can be easily interpreted and inform the wetlab experiments with a refined estimation so that the efficiency of BC production process can be better understood.
Mathematical Background
Model part one (ODE simulation):
- Dependent Variables:
- Pplus(t): population of BC producing cells at time t
- Pminus(t): population of mutant cells (dormant cells producing no bacterial cellulose) at time t
- BC(t): BC yield at time t
- S(t): substrate (glucose) concentration at time t
- O(t): oxygen level at time t
- Parameters:
- Kd: mutation rate from BC producing cells to mutant (dormant) cells
- Vp: maximum rate of cell population change achieved by the system, parameter in Michaelis-Menten kinetics
- Kp: Michaelis constant in rate equation for cell population change, parameter in Michaelis-Menten kinetics describing the enzymatic activities involved in substrate consumption
- KO2: Michaelis constant in rate equation for cell population change, parameter in Michaelis-Menten kinetics describing the enzymatic activities involved in oxygen consumption
- Kdplus: death rate of BC producing cells
- Vc: maximum rate of BC yield achieved by the system, parameter in Michaelis-Menten kinetics
- Kc: Michaelis constant in rate equation for BC production, parameter in Michaelis-Menten kinetics describing the enzymatic activities involved in substrate consumption
- Kup: together with O(t), the term (Kup+O(t))/Kup captures the upregulating effect of oxygen on bacterial cellulose yield
- Kdminus: death rate of mutant (dormant) cells
- Kgrowth: substrate consumption rate of cell population
- KBC: substrate consumption rate of BC production
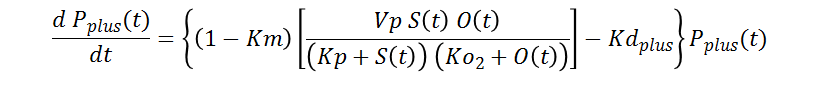
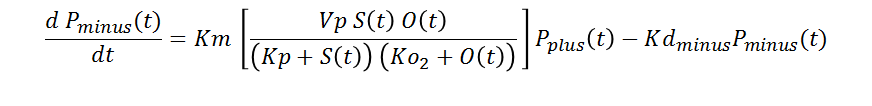
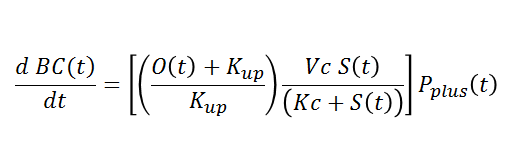
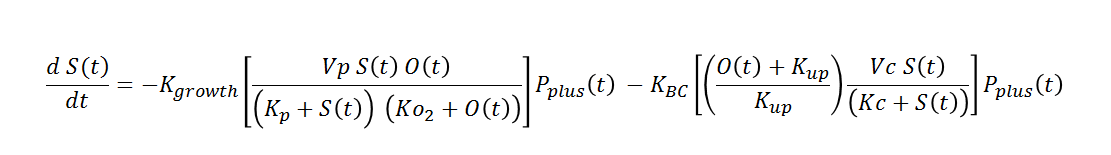
- ODEs:
- Rate of change of BC producing cells population:
- Rate of change of mutant (dormant) cells production:
- Rate of BC production:
- Rate of substrate (glucose) consumption:
- Rate of change of BC producing cells population:
Model part two (integrated form):
The simulation of part one of the induction model provides an approximation of the optimal induction time for which overall BC yield is maximised. This induction time will then serve as an input to the second part of the model, where an integrated form of the rate equations are used to predict more detailed profiles for BC production, substrate consumption and cell population.
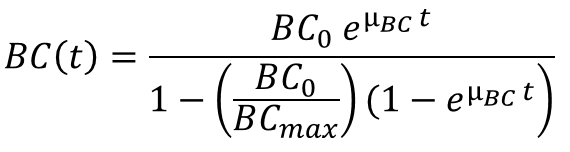
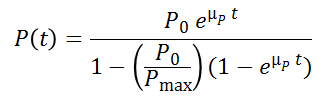
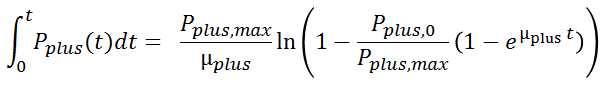
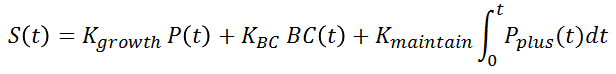
- Solutions:
-
- Dependent Variables:
- P(t): total cell population, all cells produced since starting time
- Pplus(t) : BC producing cell population.
- Parameters
- Kmaintain: maintenance coefficient, a measurement of the substrate consumption rate to maintain the BC producing cell population (viable cells). This is an added feature in model part two.
- Experiments were set up to determine P0, Pmax, µBC, µP, Pplus,0, Pplus,max, µplus, Kgrowth, KBC, and Kmaintain where these parameters obtained from experiments characterise the strain ATCC53582 specifically. The measurements taken to characterise the parameters include: the dry mass of bacterial cellulose being produced, glucose (substrate) level just below the pellicle and cell concentration.
Results and Conclusions
Model part one (ODE simulation):
*Key: +cell population = BC producing cell population; -cell population = dormant (mutant) cell population (not producing BC)
Figure 1 demonstrates the change in four dependent variable profiles as per induction time, simulated for 50 time points starting after 60 minutes with one hour as the time interval. The time frame simulated in the model is 50 hours long, with the y axis labelled with arbitrary units since the model is intended to provide relative values, rather than absolute values, which will be calculated in second part of the model. This part of the model (part one) provides an approximation of the optimal induction time by comparing maximum BC yield (within experiment time frame) at each induction time, and the corresponding time needed to achieve maximum yield.

As shown in figure 2, a maximum BC yield is exhibited when induced after around four hours of growth, during the growth (log) phase of cell cycle. If induced earlier than this time point, as illustrated in the movie above, cell growth will be delayed during lag phase and therefore a competent cell population will not be established to yield satisfactory amount of BC within the experiment time frame, which in this simulation is 50 hours. The maximum BC yield stays at a constant level when induction occurred after 10 hours and it is probably due to the fact that nutrient (substrate) is being depleted after around 10 hours.
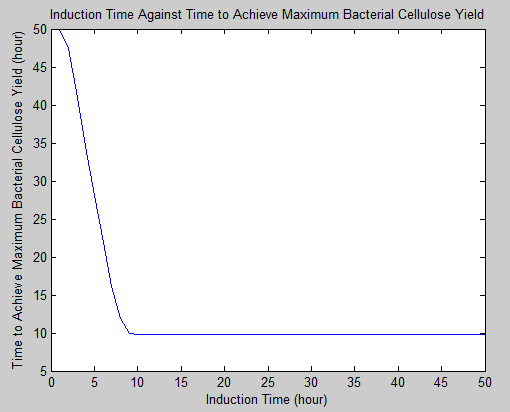
Figure 3 illustrates the variation in time needed to achieve maximum BC production within the experiment time frame as per induction time. Similarly, the fact that time needed to achieve maximum BC yield stabilises after 10 hours of growth is also resulted from the depletion of nutrient (substrate).
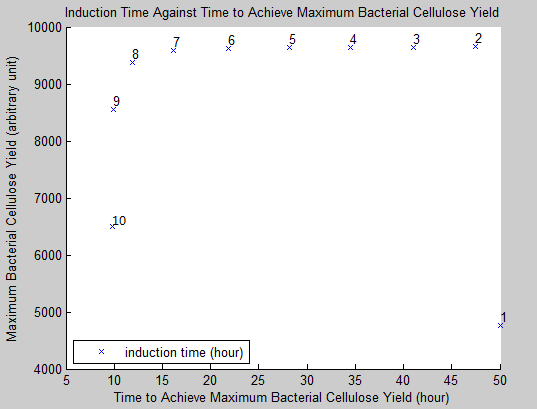
Figure 4 illustrates the efficiency of BC production as a trade-off between maximum BC yield and corresponding time needed to achieve such yield at each induction time. It is observed that an induction occurred after seven hours will not only result in a relatively high yield but also save time in achieving this high yield. Again, due to depletion of nutrient, any induction occurred after 10 hours converges at the same point as the one induced at 10 hour time point.
Model part two (integrated form):
The above presented simulations are also adaptable to larger time scales (i.e. days). With appropriate boundary conditions, the provided model can be used to simulate the dependent variable profiles at a given induction time (e.g. the approximated optimal induction time point). This is explained further below:


For the cell concentration measurements, no difference has been made between BC producing cells and dormant (mutant) cells, as simulated in part one of the model. Total cell population thus considers an accumulation of all cells produced since starting point, and the viable cell population is an approximation of cell population in the oxygenated layer that are producing BC.

As described in the mathematical background section, the nutrient profile presented here also takes cell maintenance consumption into consideration, which is a further refined feature specific for the second part of the model.
References
- M. Hornung; M. Ludwig; A.M. Gerrard; H.-P. Schmauder Optimizing the Production of Bacterial Cellulose in Surface Culture: Evaluation of Substrate Mass Transfer Influences on the Bioreaction (Part 1) Eng. Life Sci. 2006, 6, No. 6, 537–545
Appendix: Code
The code for this model can be found here: Induction_model_imperial_igem_2014.m