 "
"
Team:Imperial/Induction Model
From 2014.igem.org
| Line 68: | Line 68: | ||
<li>Rate Equations: | <li>Rate Equations: | ||
<ul> | <ul> | ||
| - | <li>Rate of change of cellulose producing cells population:<img class="content-image" src=" | + | <li>Rate of change of cellulose producing cells population:<img class="content-image" src="https://static.igem.org/mediawiki/2014/a/a7/IC14-modelling-induction-rate1.png" height="70px"></li> |
| - | <li>Rate of change of mutant (dormant) cells production:<img class="content-image" src=" | + | <li>Rate of change of mutant (dormant) cells production:<img class="content-image" src="https://static.igem.org/mediawiki/2014/3/37/IC14-modelling-induction-rate2.png" height="70px"></li> |
| - | <li>Rate of bacterial cellulose production:<img class="content-image image-equation" src=" | + | <li>Rate of bacterial cellulose production:<img class="content-image image-equation" src="https://static.igem.org/mediawiki/2014/f/f4/IC14-modelling-induction-rate3.png" height="70px"></li> |
| - | <li>Rate of substrate (glucose) consumption:<img class="content-image image-full" src=" | + | <li>Rate of substrate (glucose) consumption:<img class="content-image image-full" src="https://static.igem.org/mediawiki/2014/3/3b/IC14-modelling-induction-rate4.png"></li> |
</ul></li> | </ul></li> | ||
| Line 87: | Line 87: | ||
</p> | </p> | ||
| - | <img class="content-image " src=" | + | <img class="content-image " src="https://static.igem.org/mediawiki/2014/d/da/IC14-modelling-induction-interact1.png" height="70px"> |
| - | <img class="content-image " src=" | + | <img class="content-image " src="https://static.igem.org/mediawiki/2014/0/02/IC14-modelling-induction-interact2.png" height="70px"> |
| - | <img class="content-image " src=" | + | <img class="content-image " src="https://static.igem.org/mediawiki/2014/6/62/IC14-modelling-induction-interact3.png" height="70px"> |
| - | <img class="content-image " src=" | + | <img class="content-image " src="https://static.igem.org/mediawiki/2014/8/88/IC14-modelling-induction-interact4.png" height="70px"> |
<p>Where P(t) represents the total cell population, P<sub>plus</sub>(t) is the cellulose producing cells population and K<sub>maintain</sub> is maintenance rate In model II, glucose consumption of maintaining the viable cells are taken into consideration.</p> | <p>Where P(t) represents the total cell population, P<sub>plus</sub>(t) is the cellulose producing cells population and K<sub>maintain</sub> is maintenance rate In model II, glucose consumption of maintaining the viable cells are taken into consideration.</p> | ||
| Line 101: | Line 101: | ||
<h3>Model I</h3> | <h3>Model I</h3> | ||
<figure class="content-image image-half"> | <figure class="content-image image-half"> | ||
| - | <img class="image-full" src=" | + | <img class="image-full" src="https://static.igem.org/mediawiki/2014/3/3a/IC14-modelling-induction-model1-1.gif"> |
<figcaption>Figure 1:</figcaption> | <figcaption>Figure 1:</figcaption> | ||
</figure> | </figure> | ||
<figure class="content-image image-half"> | <figure class="content-image image-half"> | ||
| - | <img class="image-full" src=" | + | <img class="image-full" src=" https://static.igem.org/mediawiki/2014/6/6b/IC14-modelling-induction-model1-2.png"> |
<figcaption>Figure 2:</figcaption> | <figcaption>Figure 2:</figcaption> | ||
</figure> | </figure> | ||
| Line 111: | Line 111: | ||
</p> | </p> | ||
<figure class="content-image image-half"> | <figure class="content-image image-half"> | ||
| - | <img class="image-full" src=" | + | <img class="image-full" src="https://static.igem.org/mediawiki/2014/e/e1/IC14-modelling-induction-model1-3.png"> |
<figcaption>Figure 3:</figcaption> | <figcaption>Figure 3:</figcaption> | ||
</figure> | </figure> | ||
<h3>Model II</h3> | <h3>Model II</h3> | ||
<figure class="content-image image-half"> | <figure class="content-image image-half"> | ||
| - | <img class="image-full" src=" | + | <img class="image-full" src="https://static.igem.org/mediawiki/2014/7/74/IC14-modelling-induction-model2-1.png"> |
<figcaption>Figure 4:</figcaption> | <figcaption>Figure 4:</figcaption> | ||
</figure> | </figure> | ||
<figure class="content-image image-half"> | <figure class="content-image image-half"> | ||
| - | <img class="image-full" src=" | + | <img class="image-full" src="https://static.igem.org/mediawiki/2014/1/14/IC14-modelling-induction-model2-2.png"> |
<figcaption>Figure 5:</figcaption> | <figcaption>Figure 5:</figcaption> | ||
</figure> | </figure> | ||
<figure class="content-image image-half"> | <figure class="content-image image-half"> | ||
| - | <img class="image-full" src=" | + | <img class="image-full" src="https://static.igem.org/mediawiki/2014/2/23/IC14-modelling-induction-model2-3.png"> |
<figcaption>Figure 6:</figcaption> | <figcaption>Figure 6:</figcaption> | ||
</figure> | </figure> | ||
Revision as of 10:36, 8 October 2014
Induction Model
Introduction
The ATCC53582 can be induced by IPTG to produce high yield of bacterial cellulose and the model is designed to evaluate specific cell performance with correspondence to each particular induction time.
The model has two parts: the first part roughly predicts the profiles for bacterial cellulose production, substrate (glucose) consumption, cellulose-producing cells population and mutant cell population at each induction time input. The model will then be able to generate a plot illustrating the induction time against cellulose yield. Based on the estimation from part one of the model, the second part of the model is able to generate a series of more detailed profiles with respect to substrate consumption, cell population and cellulose production, described in more realistic units that can be easily applied to wetlab.
Mathematical Background
Model I
- Variables:
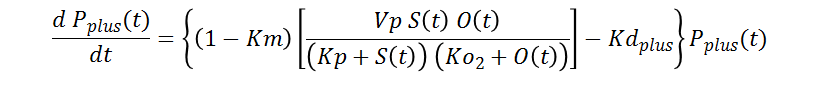
- Pplus(t): population of cellulose producing cells
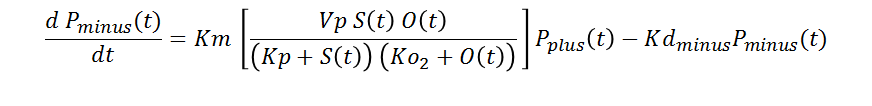
- Pminus(t): population of mutant cells (dormant cells producing no bacterial cellulose)
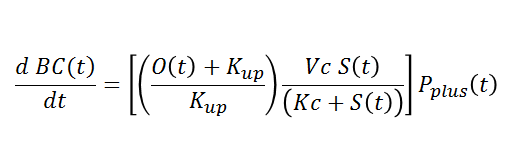
- BC(t): cellulose yield
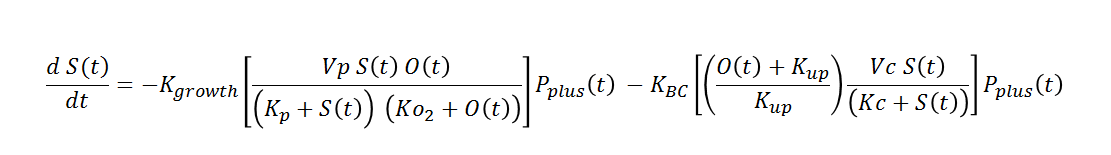
- S(t): substrate (glucose) concentration
- O(t): oxygen level (input from pellicle model?? From oxygen diffusion profile)
- Parameters:
- Km: mutation rate constant from cellulose producing cells to mutant (dormant) cells
- Vp: maximum rate of cell population change achieved by the system, parameter in Michaelis-Menten kinetics
- Kp: Michaelis constant in rate equation for cell population change, parameter in Michaelis-Menten kinetics
- KO2: Michaelis constant in rate equation for cell population change, parameter in Michaelis-Menten kinetics
- Kdplus: death rate of cellulose producing cells
- Vc: maximum rate of bacterial cellulose yield achieved by the system, parameter in Michaelis-Menten kinetics
- Kc: Michaelis constant in rate equation for bacterial cellulose production, parameter in Michaelis-Menten kinetics
- KO2’: together with O(t), oxygen level, this coefficient simulates the upregulating effect of oxygen on bacterial cellulose yield.
- Kdminus: death rate of mutant (dormant) cells
- Kgrowth: substrate consumption rate of cell population
- KBC: substrate consumption rate of bacterial cellulose production
- Rate Equations:
- Rate of change of cellulose producing cells population:
- Rate of change of mutant (dormant) cells production:
- Rate of bacterial cellulose production:
- Rate of substrate (glucose) consumption:
- Rate of change of cellulose producing cells population:
Lab Interaction
Model I is dedicated to provide a rough prediction of the bacterial cellulose production where the result will indicate the induction time leading to maximum bacterial cellulose yield. The induction time resulted will serve as an input for the second model.
Model II is built based on the rate equations in Model I where the equations are integrated with boundary conditions obtained from the wetlab so that a more precise solution to bacterial cellulose production, substrate consumption and cell population can be presented in a realistic scale easily interpreted by the wetlab for predictions (1):
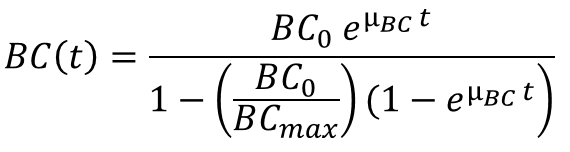
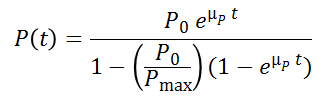
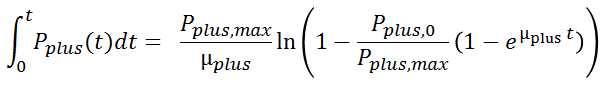
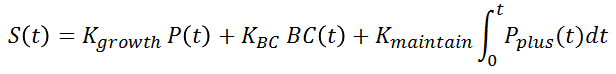
Where P(t) represents the total cell population, Pplus(t) is the cellulose producing cells population and Kmaintain is maintenance rate In model II, glucose consumption of maintaining the viable cells are taken into consideration.
Experiments are set up to determine P0, Pmax, µBC, µP, Pplus,0, Pplus,max, µplus, Kgrowth, KBC, and Kmaintain where the parameters obtained from experimental data characterizes the strain ATCC53582 specifically. The experiments are run in parallel where measurements are taken twice daily. The measurements taken to characterize the parameters include: the dry mass of bacterial cellulose being produced, glucose (substrate) level just below the pellicle and cell concentration. The experimental data is then plotted and curve-fitting parameters are obtained to interpret the parameters specified above. The fully characterized equations are then able to inform the wetlab on bacterial cellulose production within a time period and the most efficient approach for substrate addition.
Results and Conclusions
Model I

It can be indicated from the model that an early induction will maximize the bacterial cellulose yield. At time point 1800, the substrate (glucose) is depleted in the media.

Model II


References
- M. Hornung; M. Ludwig; A.M. Gerrard; H.-P. Schmauder Optimizing the Production of Bacterial Cellulose in Surface Culture: Evaluation of Substrate Mass Transfer Influences on the Bioreaction (Part 1) Eng. Life Sci. 2006, 6, No. 6, 537–545