 "
"
Team:Freiburg/Content/Results/Vector
From 2014.igem.org
Mirja Harms (Talk | contribs) |
Mirja Harms (Talk | contribs) |
||
| Line 1: | Line 1: | ||
<!-- hier ändern https://2014.igem.org/Team:Freiburg/Content/Results/Vector | <!-- hier ändern https://2014.igem.org/Team:Freiburg/Content/Results/Vector | ||
| - | class="img-no-border" class="img-no-pad" --> | + | class="img-no-border" class="img-no-pad" class="fig-full-width"--> |
<html lang="en"> | <html lang="en"> | ||
<head> | <head> | ||
| Line 14: | Line 14: | ||
<div class="row category-row"> | <div class="row category-row"> | ||
<div class="col-sm-6"> | <div class="col-sm-6"> | ||
| - | <p>One important part in our system is the viral vector we use for transferring genes into target cells. We | + | <p>One important part in our system is the viral vector we use for transferring genes into target cells. We succeeded to stably integrate our gene of interest into the genome of mammalian target cells by using a vector derived from the murine leukemia virus. The advantages of this vector are: its specificity for murine cells, making the viral work safe and easy; a very high efficiency for infection; and the ability of stable gene transfer into target genomes. Here we present results on these three qualities of our viral vector and how we optimized virus production and cell infection.</p> |
</div> | </div> | ||
<div class="col-sm-6"> | <div class="col-sm-6"> | ||
| Line 22: | Line 22: | ||
</a> | </a> | ||
<figcaption> | <figcaption> | ||
| - | <p class="header"> | + | <p class="header"></p> |
</figcaption> | </figcaption> | ||
</figure> | </figure> | ||
| Line 32: | Line 32: | ||
<h2 id="Vector-Stable-Integration">Stable integration of target genes into the genome</h2> | <h2 id="Vector-Stable-Integration">Stable integration of target genes into the genome</h2> | ||
<p> | <p> | ||
| - | Our viral vector derives from the murine leukemia virus and since this virus is a retrovirus, it stably integrates our gene of interest into the target genomes. | + | Our viral vector derives from the murine leukemia virus and since this virus is a retrovirus, it stably integrates our gene of interest into the target genomes. Any gene of interest can be delivered. We transferred genes for different fluorescent proteins into murine cell lines (Fig.). |
</p> | </p> | ||
<figure> | <figure> | ||
<a href="https://static.igem.org/mediawiki/2014/1/10/Freiburg2014-10-06_stable_integration_different_colours.png"> <!-- ORGINAL --> | <a href="https://static.igem.org/mediawiki/2014/1/10/Freiburg2014-10-06_stable_integration_different_colours.png"> <!-- ORGINAL --> | ||
| - | <img class=" | + | <img class="fig-full-width" src="https://static.igem.org/mediawiki/2014/c/c0/Freiburg2014-10-06_stable_integration_different_colours_Thumbnail.jpg"> <!-- Thumbnail --> |
</a> | </a> | ||
<figcaption> | <figcaption> | ||
| - | <p class="header"> | + | <p class="header">Figure 1:</p> |
| - | + | <p class="desc">Murine cells infected with our viral vector containing different fluorescent markers; (A) EGFP; (B) mKO; (C) mKate.</p> | |
</figcaption> | </figcaption> | ||
</figure> | </figure> | ||
<p> | <p> | ||
| - | In addition, we demonstrated the capability of stable gene integration by creating an EGFP cell line | + | In addition, we demonstrated the capability of stable gene integration by creating an EGFP cell line and assessing the fraction of fluorescent cells over several passages. Two days after virus infection, we selected for cells displaying green fluorescence by a cell sorter. Afterwards, we analyzed the EGFP cell line for several weeks by flow cytometry. Sustained expression of EGFP indicates stable integration into the genome of the original cell line (Fig.2). |
</p> | </p> | ||
| - | |||
| - | |||
| - | |||
| - | |||
| - | |||
| - | |||
| - | |||
| - | |||
| - | |||
| - | |||
<figure> | <figure> | ||
<a href="https://static.igem.org/mediawiki/2014/c/c9/Freiburg2014-09-06_stable_EGPF_integration_diagram_and_facs.png"> <!-- ORGINAL --> | <a href="https://static.igem.org/mediawiki/2014/c/c9/Freiburg2014-09-06_stable_EGPF_integration_diagram_and_facs.png"> <!-- ORGINAL --> | ||
| - | <img src="https://static.igem.org/mediawiki/2014/c/c9/Freiburg2014-09-06_stable_EGPF_integration_diagram_and_facs.png"> <!-- Thumbnail --> | + | <img class="fig-full-width" src="https://static.igem.org/mediawiki/2014/c/c9/Freiburg2014-09-06_stable_EGPF_integration_diagram_and_facs.png"> <!-- Thumbnail --> |
</a> | </a> | ||
<figcaption> | <figcaption> | ||
| - | <p class="header"></p> | + | <p class="header">Figure 2:</p> |
| - | <p class="desc"></p> | + | <p class="desc">Stable integration of EGFP into the genome of the target cells. (A) Histogram of fluorescence intensity at the first sorting step. (B) Histogram of fluorescence intensity at passage xx after sorting. (C) The fraction of fluorescent cells stays constant for many passages.</p> |
</figcaption> | </figcaption> | ||
</figure> | </figure> | ||
| Line 72: | Line 62: | ||
<div class="col-sm-6"> | <div class="col-sm-6"> | ||
<p> | <p> | ||
| - | For optimal integration of the target gene, | + | For optimal integration of the target gene, we tested how long the viral vector need for transducing murine cells. We incubated murine cells (NIH3T3) with the virus for different time intervals, washed the virus away, and counted fluorescent cells after 48 h. A high transduction rate was already reached after incubating the cells for five hours with the viral particles (Fig.3). |
</p> | </p> | ||
</div> | </div> | ||
| Line 82: | Line 72: | ||
</a> | </a> | ||
<figcaption> | <figcaption> | ||
| - | <p class="header"> | + | <p class="header">Figure 3:</p> |
| - | <p class="desc"></p> | + | <p class="desc">Integration time of our viral vector into murine cells.</p> |
</figcaption> | </figcaption> | ||
</figure> | </figure> | ||
| Line 90: | Line 80: | ||
<p> | <p> | ||
| - | + | To sort the cells that stably integrated the gene of interest into the genome, the viral vector contained a marker,e.g. the gene for a fluorescent protein. But for future experiments, an additional target gene would be placed into the virus cargo, separated by an internal ribosome entry site (IRES) from the marker for selection or sorting. We tested the expression strength of EGFP in pMIG constructs containing only the marker in comparison to constructs containing the target gene upstream of an IRES and EGFP as a marker (Fig.4). In the construct combining the target gene with the marker, EGFP expression is lower; a possible explanation is the lower rate of translation initiation by the IRES compared to the cap at the 5' end of the mRNA. If only the IRES but no additional target gene is present upstream of EGFP, expression of EGFP is high because the first ATG after the 5' end of the mRNA is the start codon of EGFP. | |
</p> | </p> | ||
<figure> | <figure> | ||
<a href="https://static.igem.org/mediawiki/2014/0/0e/Freiburg2014-10-02_plasmid_map_pMIG_constructs_skizze.png"> <!-- ORGINAL --> | <a href="https://static.igem.org/mediawiki/2014/0/0e/Freiburg2014-10-02_plasmid_map_pMIG_constructs_skizze.png"> <!-- ORGINAL --> | ||
| - | <img src="https://static.igem.org/mediawiki/2014/0/0e/Freiburg2014-10-02_plasmid_map_pMIG_constructs_skizze.png"> <!-- Thumbnail --> | + | <img class="fig-full-width" src="https://static.igem.org/mediawiki/2014/0/0e/Freiburg2014-10-02_plasmid_map_pMIG_constructs_skizze.png"> <!-- Thumbnail --> |
</a> | </a> | ||
| - | |||
| - | |||
| - | |||
| - | |||
</figure> | </figure> | ||
<figure> | <figure> | ||
<a href="https://static.igem.org/mediawiki/2014/2/20/Freiburg2014-10-02_pMIG_different_consctructs.JPG"> <!-- ORGINAL --> | <a href="https://static.igem.org/mediawiki/2014/2/20/Freiburg2014-10-02_pMIG_different_consctructs.JPG"> <!-- ORGINAL --> | ||
| - | <img | + | <img class="fig-full-width" src="https://static.igem.org/mediawiki/2014/2/20/Freiburg2014-10-02_pMIG_different_consctructs.JPG"> <!-- Thumbnail --> |
</a> | </a> | ||
<figcaption> | <figcaption> | ||
| - | <p class="header"> | + | <p class="header">Figure 4:</p> |
| - | <p class="desc"></p> | + | <p class="desc">Expression strength of EGFP sorting marker with and without an IRES. (A) Cargo contains only EGFP, (B) cargo contains EGFP downstream of an IRES, (C) cargo contains a gane of interest, an IRES, and the EGFP marker.</p> |
</figcaption> | </figcaption> | ||
</figure> | </figure> | ||
| - | <blockquote><strong>With our viral vector any gene of interest can be delivered | + | <blockquote><strong>With our viral vector any gene of interest can be delivered to generate new stable cell lines. The advantages of generating cell lines with our vector are its efficiency and its specificity making handling easy and safe! It also takes only one week!</strong></blockquote> |
</section> | </section> | ||
| Line 121: | Line 107: | ||
<div class="row category-row"> | <div class="row category-row"> | ||
<div class="col-sm-6"> | <div class="col-sm-6"> | ||
| - | <p> | + | <p>We increased the transduction efficiency of our virus to over 80% in murine cell lines and achieved high infection rates in other cell lines expressing the murine CAT-1 receptor. |
</p> | </p> | ||
<p> | <p> | ||
| - | Protocols for virus production and target cell transduction were optimized. As producer cell line for viral particles we | + | Protocols for virus production and target cell transduction were optimized. As producer cell line for viral particles we used Phoenix cells which stably express most of the viral genes. Before transfection with pMIG, the final plasmid to initiate virus production, we split the Phoenix cells several times to increase viability and push them into the exponential growth phase during production of the viral vector. In addition, supernatant containing the vector was harvested at distinct time points optimized for high viral titer. Target cells were infected by viral supernatant with polybrene which increases the probability for particles to reach their target cells. Since murine leukemia viruses only infect dividing cells, the phase of maximum division rate of the target cells was matched to the time point of infection. |
</p> | </p> | ||
<p> | <p> | ||
| - | Under these optimized conditions, the efficiency for | + | Under these optimized conditions, the efficiency for transducing murine cell lines with our viral vector was over 80% (Fig. 5, Fig. 6). Since we had only 16% transduction efficiency at the beginning of the project, we would consider this a significant advance. To our knowledge, an optimized infection protocol with murine leukemia virus has not been published to date. The exact procedure can be found here (link). |
</p> | </p> | ||
</div> | </div> | ||
| Line 137: | Line 123: | ||
</a> | </a> | ||
<figcaption> | <figcaption> | ||
| - | <p class="header"> | + | <p class="header">Figure 5:</p> |
| - | <p class="desc"></p> | + | <p class="desc">Nice pictures of nice cells (A) fluorescent dust particles from outer space, (B) NIH 3T3 cells before protocol optimization, (C) NIH 3T3 cells after protocol optimization, (D) cells from Mirja's left index finger that was exposed to the virus unintentionally (after protocol optimization).</p> |
</figcaption> | </figcaption> | ||
</figure> | </figure> | ||
| Line 147: | Line 133: | ||
</a> | </a> | ||
<figcaption> | <figcaption> | ||
| - | <p class="header"> | + | <p class="header">Figure 6:</p> |
| - | <p class="desc"></p> | + | <p class="desc">Optimization of the virus harvesting and infection prococol throughout the course of our project (NIH 3T3 cells).</p> |
</figcaption> | </figcaption> | ||
</figure> | </figure> | ||
| Line 161: | Line 147: | ||
</a> | </a> | ||
<figcaption> | <figcaption> | ||
| - | <p class="header"> | + | <p class="header">Figure 7: </p> |
| - | <p class="desc"></p> | + | <p class="desc">Impact of dilution and concentration of the virus on transduction efficiency. Concentration of the virus was obtained by incubation with … centrifugation and resuspension in reduced volume (see protocols (link)). </p> |
</figcaption> | </figcaption> | ||
</figure> | </figure> | ||
| Line 170: | Line 156: | ||
</a> | </a> | ||
<figcaption> | <figcaption> | ||
| - | <p class="header"></p> | + | <p class="header">Figure 8:</p> |
| - | <p class="desc"></p> | + | <p class="desc">Decay of viral particles. The virus was first incubated at 37°C and then added to the NIH 3T3 cell culture. Transduction efficiency was measured ofer xx h.</p> |
</figcaption> | </figcaption> | ||
</figure> | </figure> | ||
| Line 177: | Line 163: | ||
<div class="col-sm-6"> | <div class="col-sm-6"> | ||
| - | <p>Since | + | <p>Since the viral titer has direct impact on the infection rate of target cells, we assessed the transduction efficiency of the viral particles after dilution and concentration. Concentration was acheived by incubating the viral supernatant with hexadimethrine bromide (polybrene) as well as with chondroitin sulfate, leading to formation of complexes that were big enough for pelleting by centrifugation. Pellets contained the viral particles and were resuspended in a small volume of growth medium. Infecting murine cells with the concentrated vector lead to a higher transduction rate compared to the unconcentrated virus or the diluted virus (Fig. 7). |
</p> | </p> | ||
| - | <p>In addition, we determined the decay curve of the viral particles. Incubation at 37°C leads to | + | <p>In addition, we determined the decay curve of the viral particles. Incubation at 37°C leads to a strongdecrease of the infection rate with a half time of approximately 6.5 hours (Fig. 8). This short half life provides an enhanced safety regarding work and handling of our viral vector. |
</p> | </p> | ||
</div> | </div> | ||
</div> | </div> | ||
| - | <blockquote><strong> | + | <blockquote><strong>Transduction efficiency of our viral vector in murine cells was optimized to over 80%!</strong></blockquote> |
</section> | </section> | ||
| Line 192: | Line 178: | ||
<div class="row category-row"> | <div class="row category-row"> | ||
<div class="col-sm-6"> | <div class="col-sm-6"> | ||
| - | <p>An important aspect for the function of our system as well as for its safety is the specificity of the vector regarding infection of different kind of cells | + | <p>An important aspect for the function of our system as well as for its safety is the specificity of the vector regarding infection of different kind of cells. Cells that do not have this specific receptor are not targeted by the vector (Fig.). To test the specificity of the system, different kinds of cells were incubated with the vector containing EGFP. EGFP is stably integrated by the system. We tested human cell lines, human embryonic kidney cells as well as human lung epithel carcinoma cells and breast cancer cells, for their susceptibility of being infected by the vector. In none of them, green fluorescent cells were observed (Fig. 9A-C). Murine cells (NIH3T3) that express the mouse specific CAT-1 receptor were tested as a positive control (Fig.). Quantification by flow cytometry indeed showed that human cells were not transduced, whereas a large fraction of the mouse control cells were transduced with the same virus batch Fig.). 9E-G).</p> |
</div> | </div> | ||
| Line 201: | Line 187: | ||
</a> | </a> | ||
<figcaption> | <figcaption> | ||
| - | <p class="header"> | + | <p class="header">Figure 8:</p> |
| + | <p class="desc">Specificity of the virus. The virus uses the murine mCAT-1 receptor as an entry site into the cell. Therefore, it can specifically transduce mouse cells (e.g. NIH 3T3), but not cells lines from other species (e.g. the human HEK cells).</p> | ||
</figcaption> | </figcaption> | ||
</figure> | </figure> | ||
| Line 212: | Line 199: | ||
</a> | </a> | ||
<figcaption> | <figcaption> | ||
| - | <p class="header"></p> | + | <p class="header">Figure 9</p> |
| + | <p class="desc">Infection of different cell lines with the viral vector derived from the murine leukemia virus. (A-D) Fluorescence images of infected cell lines as indicated in the images, (E) FACS analysis of infected HEK293 cells, (F) FACS analysis of infected NIH3T3 cells, (G) Fractions of infected cells for different cells lines.</p> | ||
</figcaption> | </figcaption> | ||
</figure> | </figure> | ||
| Line 242: | Line 230: | ||
</div> | </div> | ||
| - | <blockquote><strong>The vector derived from the murine leukemia virus is specific for the murine CAT-1 receptor. Therefore it is not able to infect human cell lines | + | <blockquote><strong>The vector derived from the murine leukemia virus is specific for the murine CAT-1 receptor. Therefore it is not able to infect human cell lines making handling easy and safe!</strong></blockquote> |
</section> | </section> | ||
Revision as of 17:57, 15 October 2014
The Vector
Introduction
One important part in our system is the viral vector we use for transferring genes into target cells. We succeeded to stably integrate our gene of interest into the genome of mammalian target cells by using a vector derived from the murine leukemia virus. The advantages of this vector are: its specificity for murine cells, making the viral work safe and easy; a very high efficiency for infection; and the ability of stable gene transfer into target genomes. Here we present results on these three qualities of our viral vector and how we optimized virus production and cell infection.

Stable integration of target genes into the genome
Our viral vector derives from the murine leukemia virus and since this virus is a retrovirus, it stably integrates our gene of interest into the target genomes. Any gene of interest can be delivered. We transferred genes for different fluorescent proteins into murine cell lines (Fig.).
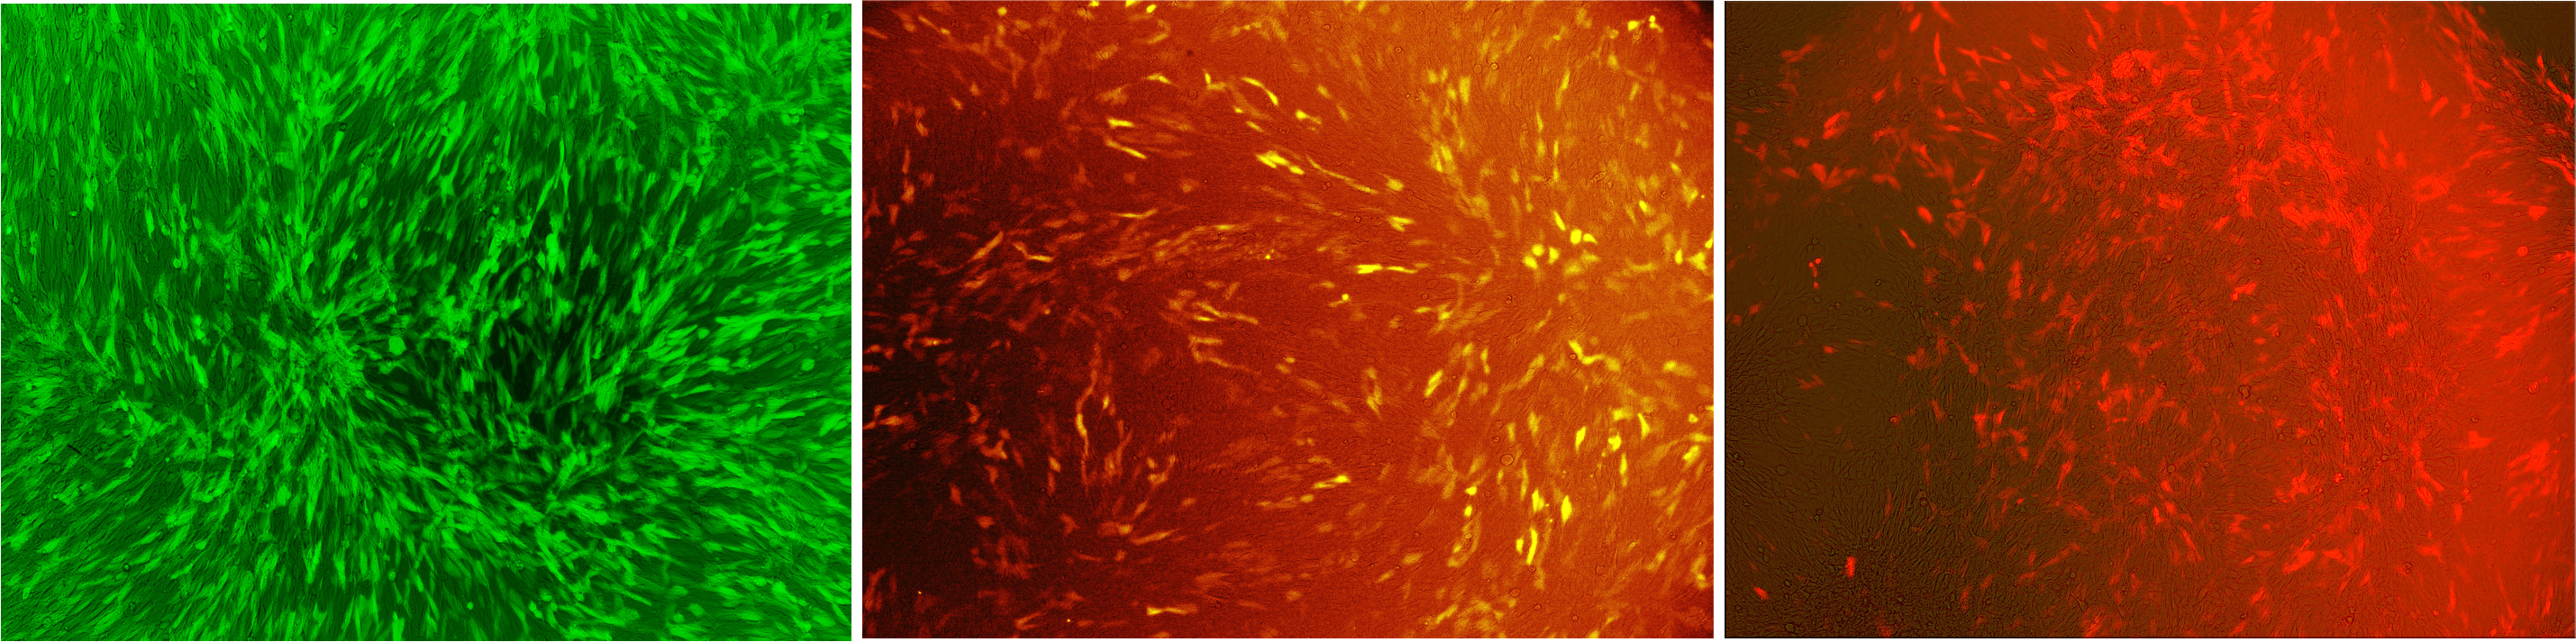
Figure 1:
Murine cells infected with our viral vector containing different fluorescent markers; (A) EGFP; (B) mKO; (C) mKate.
In addition, we demonstrated the capability of stable gene integration by creating an EGFP cell line and assessing the fraction of fluorescent cells over several passages. Two days after virus infection, we selected for cells displaying green fluorescence by a cell sorter. Afterwards, we analyzed the EGFP cell line for several weeks by flow cytometry. Sustained expression of EGFP indicates stable integration into the genome of the original cell line (Fig.2).

Figure 2:
Stable integration of EGFP into the genome of the target cells. (A) Histogram of fluorescence intensity at the first sorting step. (B) Histogram of fluorescence intensity at passage xx after sorting. (C) The fraction of fluorescent cells stays constant for many passages.
For optimal integration of the target gene, we tested how long the viral vector need for transducing murine cells. We incubated murine cells (NIH3T3) with the virus for different time intervals, washed the virus away, and counted fluorescent cells after 48 h. A high transduction rate was already reached after incubating the cells for five hours with the viral particles (Fig.3).

Figure 3:
Integration time of our viral vector into murine cells.
To sort the cells that stably integrated the gene of interest into the genome, the viral vector contained a marker,e.g. the gene for a fluorescent protein. But for future experiments, an additional target gene would be placed into the virus cargo, separated by an internal ribosome entry site (IRES) from the marker for selection or sorting. We tested the expression strength of EGFP in pMIG constructs containing only the marker in comparison to constructs containing the target gene upstream of an IRES and EGFP as a marker (Fig.4). In the construct combining the target gene with the marker, EGFP expression is lower; a possible explanation is the lower rate of translation initiation by the IRES compared to the cap at the 5' end of the mRNA. If only the IRES but no additional target gene is present upstream of EGFP, expression of EGFP is high because the first ATG after the 5' end of the mRNA is the start codon of EGFP.

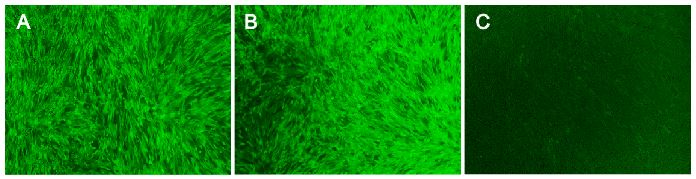
Figure 4:
Expression strength of EGFP sorting marker with and without an IRES. (A) Cargo contains only EGFP, (B) cargo contains EGFP downstream of an IRES, (C) cargo contains a gane of interest, an IRES, and the EGFP marker.
With our viral vector any gene of interest can be delivered to generate new stable cell lines. The advantages of generating cell lines with our vector are its efficiency and its specificity making handling easy and safe! It also takes only one week!
High efficiency
We increased the transduction efficiency of our virus to over 80% in murine cell lines and achieved high infection rates in other cell lines expressing the murine CAT-1 receptor.
Protocols for virus production and target cell transduction were optimized. As producer cell line for viral particles we used Phoenix cells which stably express most of the viral genes. Before transfection with pMIG, the final plasmid to initiate virus production, we split the Phoenix cells several times to increase viability and push them into the exponential growth phase during production of the viral vector. In addition, supernatant containing the vector was harvested at distinct time points optimized for high viral titer. Target cells were infected by viral supernatant with polybrene which increases the probability for particles to reach their target cells. Since murine leukemia viruses only infect dividing cells, the phase of maximum division rate of the target cells was matched to the time point of infection.
Under these optimized conditions, the efficiency for transducing murine cell lines with our viral vector was over 80% (Fig. 5, Fig. 6). Since we had only 16% transduction efficiency at the beginning of the project, we would consider this a significant advance. To our knowledge, an optimized infection protocol with murine leukemia virus has not been published to date. The exact procedure can be found here (link).
Figure 5:
Nice pictures of nice cells (A) fluorescent dust particles from outer space, (B) NIH 3T3 cells before protocol optimization, (C) NIH 3T3 cells after protocol optimization, (D) cells from Mirja's left index finger that was exposed to the virus unintentionally (after protocol optimization).
Figure 6:
Optimization of the virus harvesting and infection prococol throughout the course of our project (NIH 3T3 cells).

Figure 7:
Impact of dilution and concentration of the virus on transduction efficiency. Concentration of the virus was obtained by incubation with … centrifugation and resuspension in reduced volume (see protocols (link)).
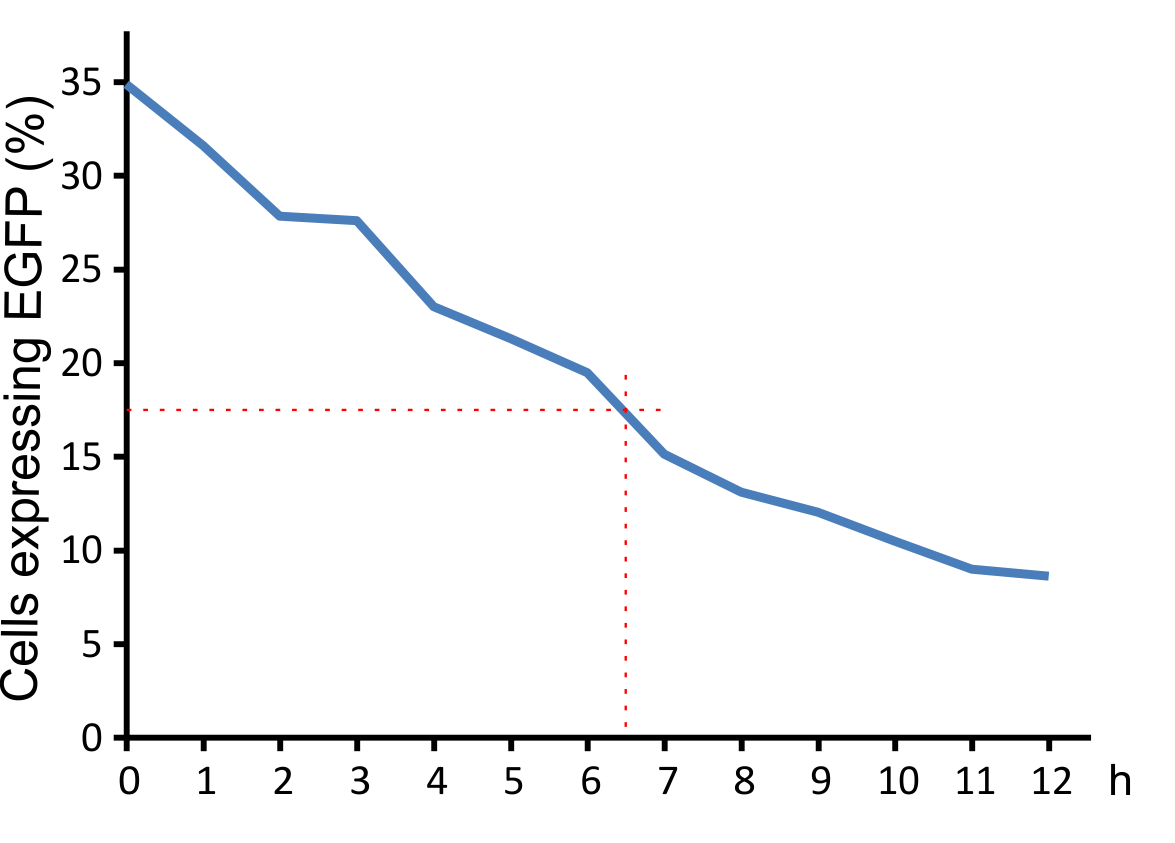
Figure 8:
Decay of viral particles. The virus was first incubated at 37°C and then added to the NIH 3T3 cell culture. Transduction efficiency was measured ofer xx h.
Since the viral titer has direct impact on the infection rate of target cells, we assessed the transduction efficiency of the viral particles after dilution and concentration. Concentration was acheived by incubating the viral supernatant with hexadimethrine bromide (polybrene) as well as with chondroitin sulfate, leading to formation of complexes that were big enough for pelleting by centrifugation. Pellets contained the viral particles and were resuspended in a small volume of growth medium. Infecting murine cells with the concentrated vector lead to a higher transduction rate compared to the unconcentrated virus or the diluted virus (Fig. 7).
In addition, we determined the decay curve of the viral particles. Incubation at 37°C leads to a strongdecrease of the infection rate with a half time of approximately 6.5 hours (Fig. 8). This short half life provides an enhanced safety regarding work and handling of our viral vector.
Transduction efficiency of our viral vector in murine cells was optimized to over 80%!
Specificity and safety of MuLV
An important aspect for the function of our system as well as for its safety is the specificity of the vector regarding infection of different kind of cells. Cells that do not have this specific receptor are not targeted by the vector (Fig.). To test the specificity of the system, different kinds of cells were incubated with the vector containing EGFP. EGFP is stably integrated by the system. We tested human cell lines, human embryonic kidney cells as well as human lung epithel carcinoma cells and breast cancer cells, for their susceptibility of being infected by the vector. In none of them, green fluorescent cells were observed (Fig. 9A-C). Murine cells (NIH3T3) that express the mouse specific CAT-1 receptor were tested as a positive control (Fig.). Quantification by flow cytometry indeed showed that human cells were not transduced, whereas a large fraction of the mouse control cells were transduced with the same virus batch Fig.). 9E-G).

Figure 8:
Specificity of the virus. The virus uses the murine mCAT-1 receptor as an entry site into the cell. Therefore, it can specifically transduce mouse cells (e.g. NIH 3T3), but not cells lines from other species (e.g. the human HEK cells).

Figure 9
Infection of different cell lines with the viral vector derived from the murine leukemia virus. (A-D) Fluorescence images of infected cell lines as indicated in the images, (E) FACS analysis of infected HEK293 cells, (F) FACS analysis of infected NIH3T3 cells, (G) Fractions of infected cells for different cells lines.

Fig.X: FACS analysis of different cell lines incubated with the CAT-1 specific viral vector
Left: Different cell lines not incubated with the vector as negative control, Middle: different cell lines infected with MuLV IRES EGFP (50% in completed growth medium), Right: cells transfected with the mouse specific receptor CAT-1 (rz006) were infected with the viral vector. The infection efficiency is directly correlated with transfection efficiency of the receptor into the different kind of cells.
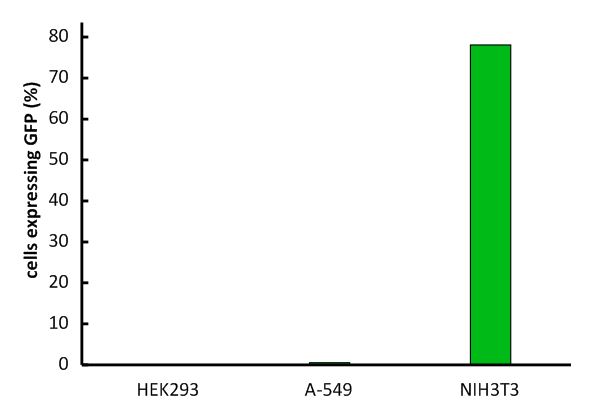
Fig.1: Infection of different cell lines with the viral vector derived from the murine leukemia virus.
In order to investigate the specificity of the viral vector, two human cell lines, human embryonic kidney cells as well as lung epithel carcinoma cells, were infected and the percentage of cells expressing EGFP was analyzed by flow cytometry.
The vector derived from the murine leukemia virus is specific for the murine CAT-1 receptor. Therefore it is not able to infect human cell lines making handling easy and safe!