Team:Oxford/notebook
From 2014.igem.org
Part A - Tolerance Maximisation
Week 1
Tasks completed:
testing the resistance of the plastic ware and the tolerance of E. coli, Pseudomonas fluorescens and Pseudomonas putida to DCM.
Methods:
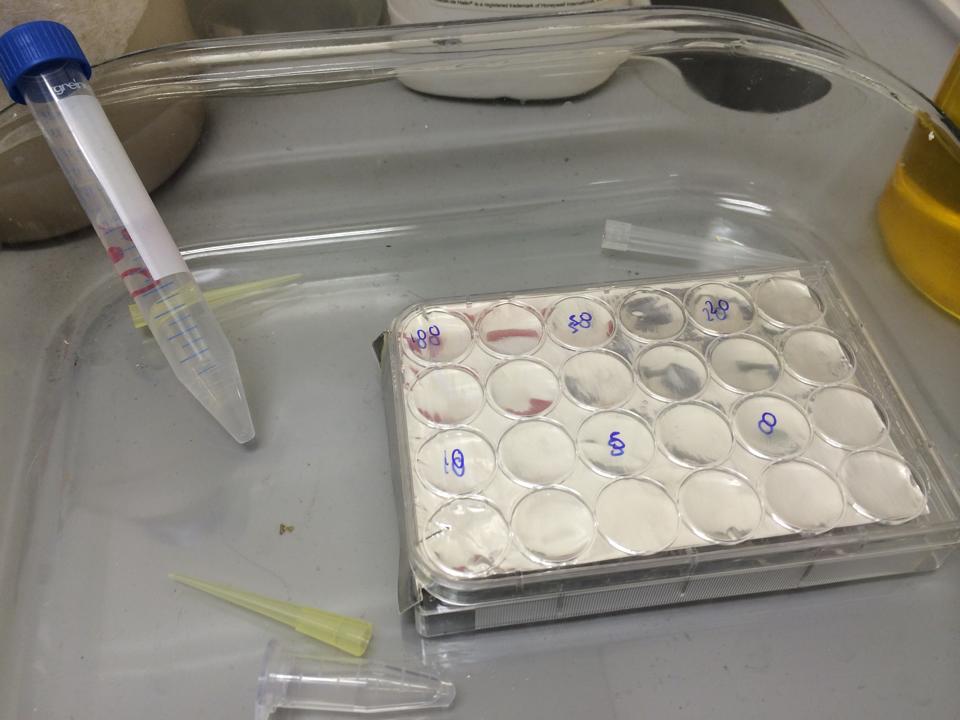
First, we tested the resilience of the plastic ware, specifically the 24 well plates, to find out what concentrations of DCM it could cope with.
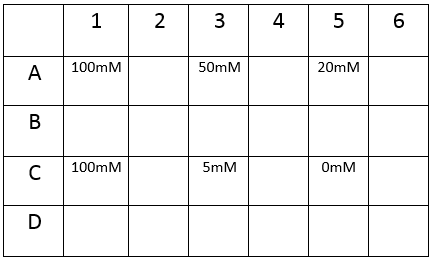
The plate was set up with the following concentrations of DCM in each well.
After leaving the plate overnight covered in foil and the lid to prevent the evaporation of DCM, all wells were intact. This means we can use the plates in our further experiments with DCM.
To test the tolerance of the bacteria we grew up liquid culture strains using the
Growing Liquid Cell Cultures protocol. The strains we used were KT2240 (P. putida), SBW25 (P. fluorescens) and MGG155 (E. coli). Initially we incubated 100µl of each liquid culture with 5ml LB broth and DCM to make concentrations of 0, 5, 10 and 20mM. Overnight incubations of each strain at an appropriate temperature (30°C for ''Pseudomonas'' and 37°C for'' E. coli'') whilst shaking showed that all three strains could tolerate these concentrations, indicating that it’s the metabolic intermediates and not the DCM itself that causes the toxicity.
Therefore we repeated the experiment using 0, 20, 50 and 100mM concentrations of DCM. Before doing this we streaked out fresh plates of our cultures using the Agar Plate Preparation and Streaking Plates protocols before growing liquid cultures from these. The results of P. putida, P. fluorescens and E. coli overnight incubation are below:
We ranked the growth in each tube by eye where 0 was no growth and 5 was unhindered growth.
P. putida could tolerate even 100mM, so this strain will be useful when it comes to characterising the dcmA regulatory system. As we now have an idea of what concentrations each strain can tolerate, we can design our experiments for next week where we will obtain growth curves for each strain at various concentrations of DCM.
Week 2
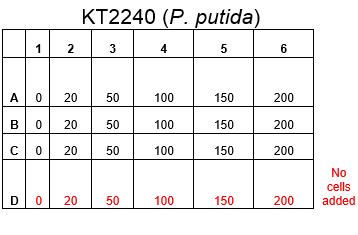
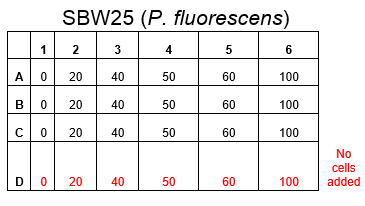
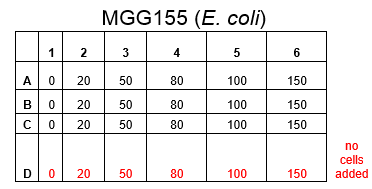
After looking at the qualitative results of the DCM tolerance of various bacterial strains, we decided that a quantitative experiment should follow. We designed an experiment to quantitatively assess the tolerance of bacterial strains (KT2240 (P. putida), SBW25 (P. fluorescens) and MGG155 (E. coli)) to DCM. The plate designs are shown below (where all concentrations are in mM). In the qualitative experiments, P. putida did not show any change in growth up to 100 mM (results shown in figure 1), we wanted to find the upper limit of [DCM] that it could stand (which could act as a positive control as well).
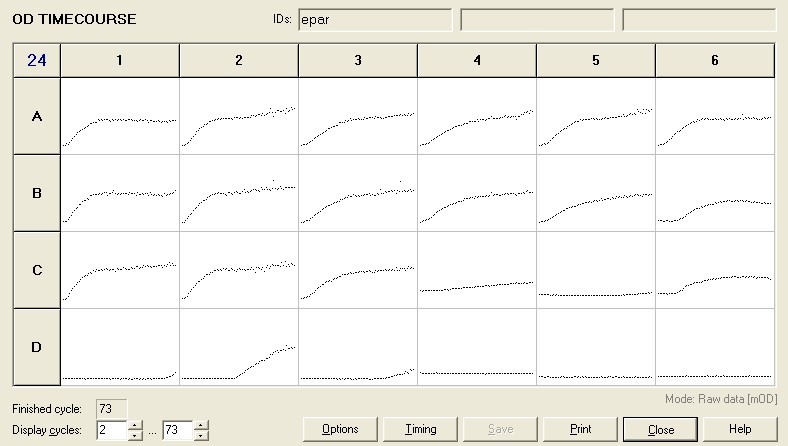
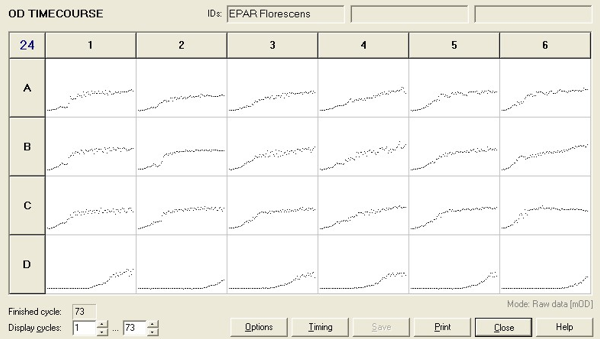
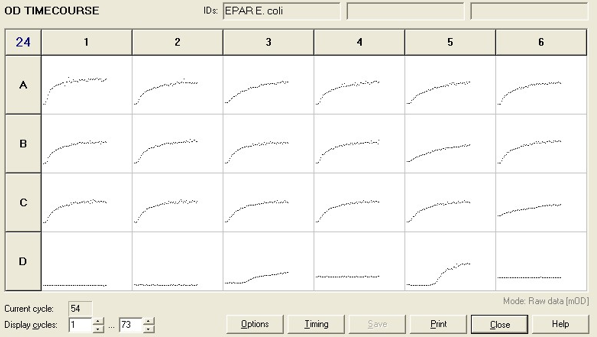
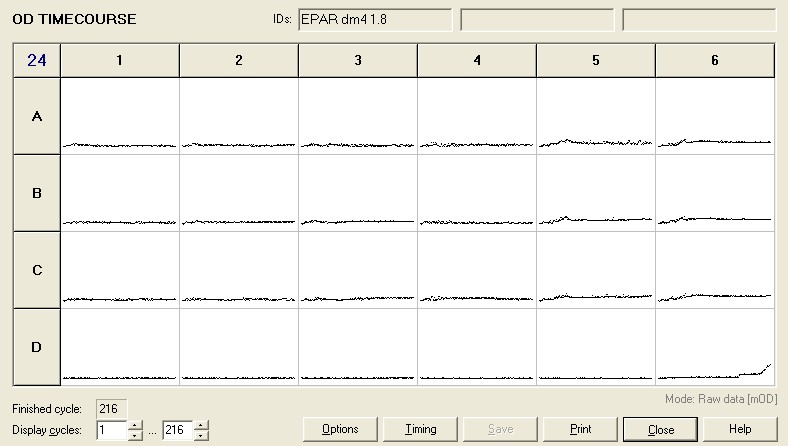
To measure the changing absorbance in these plates we used the Measuring Cell Density Over Time protocol. By the end of this week we had results for the Putida plate, which are shown below.
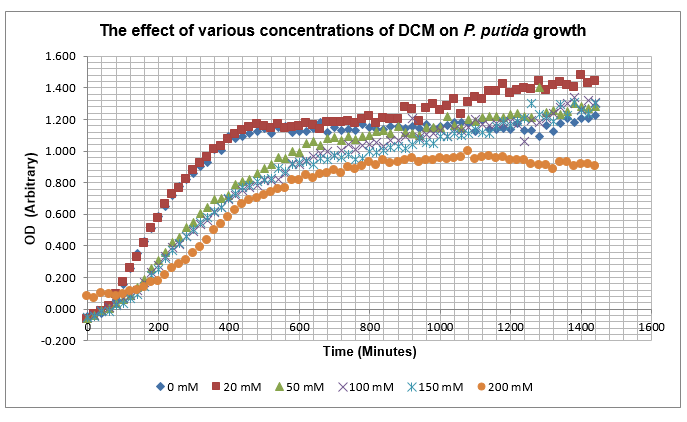
As it can be seen from the results, the control wells D1, D2 and D3 all show signs of contamination (perhaps a very small quantity were accidentally transferred during pipetting) since these wells only contain DCM and so should not change over time. Another possible source of error for these results is a white powder we found on the top of the plate when removing it. This could have scattered light and so affected the OD reading. These wells as a result were discarded during data analysis. It appears that wells C4 and C5 are outliers as well and this may due to fewer cells being transferred, since we did not mix the test tube thoroughly before transferring the bacterium to the plates and also due to the small volume in the test tube we had to tilt it to transfer the bacteria, this means since these were the last wells to be pipetted, this is a likely cause for these outliers. From these results, the following graph was plotted (all values are normalised to the control wells in row D):
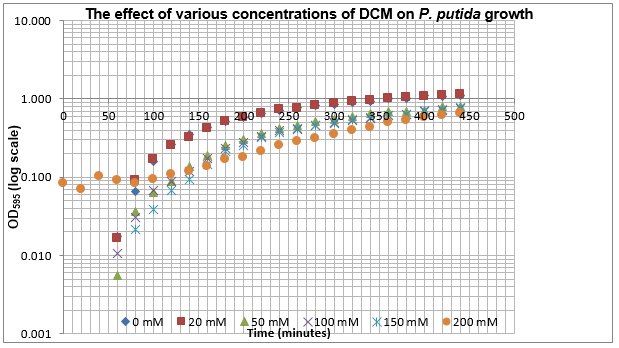
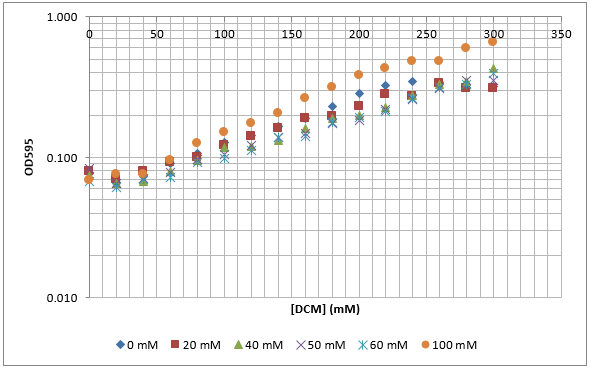
The data on P. putida above was replotted so that it was a semilog graph:
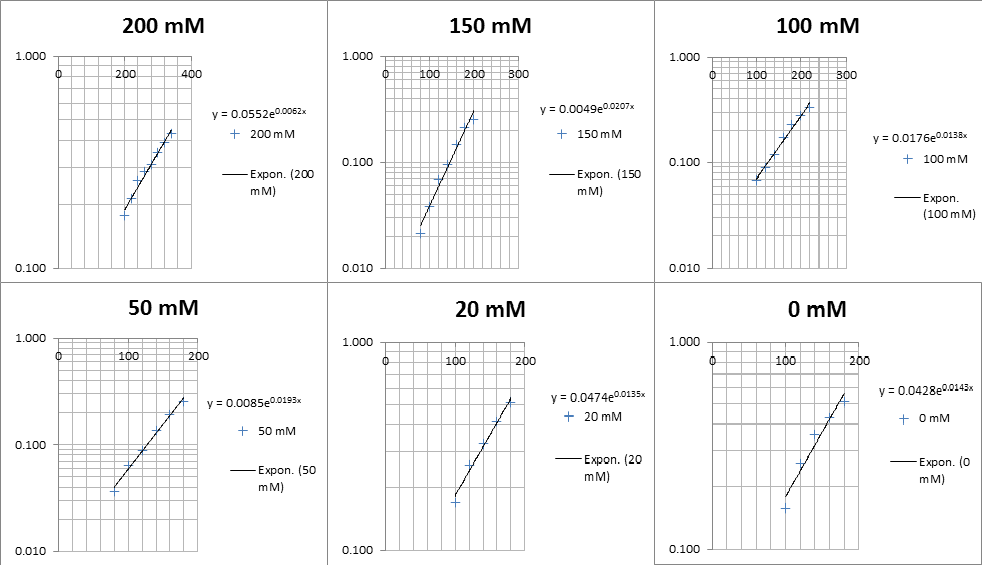
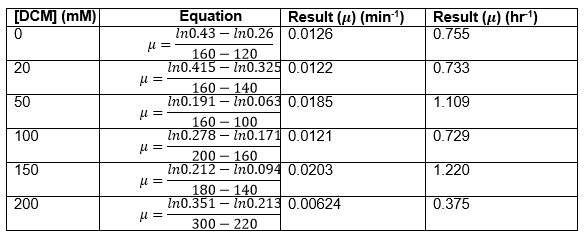
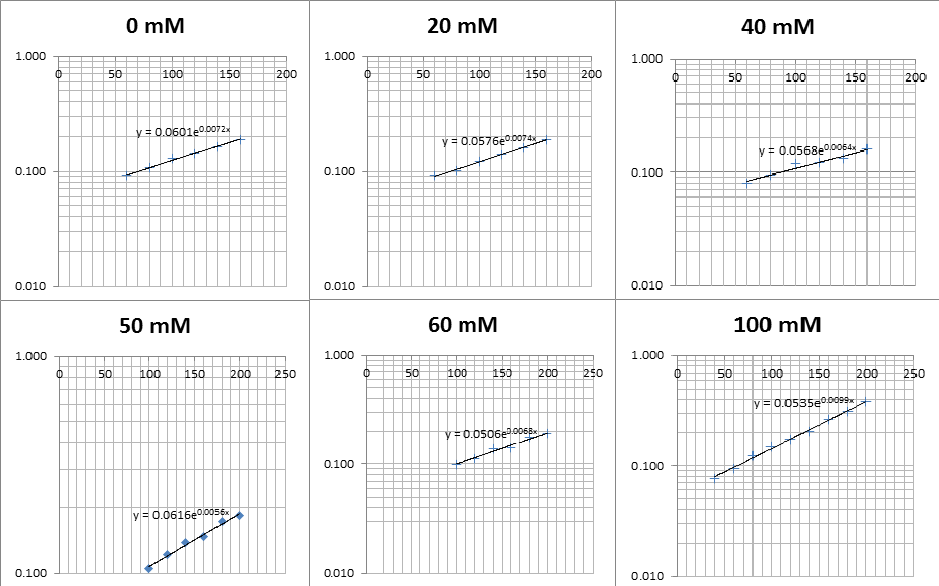
The linear part of these graphs needed to be taken as this represents the log phase of growth, which is the phase we are measuring. The time points in which each curve was linear was assessed by eye and the following graphs were obtained. The following equation was then used for points that were on the line of best fit of these graphs.
The graph gave two conclusions, depending on the type of line that was fitted to the data, we will repeat these measurements and determine the statistical significance in other to assign the correct one.
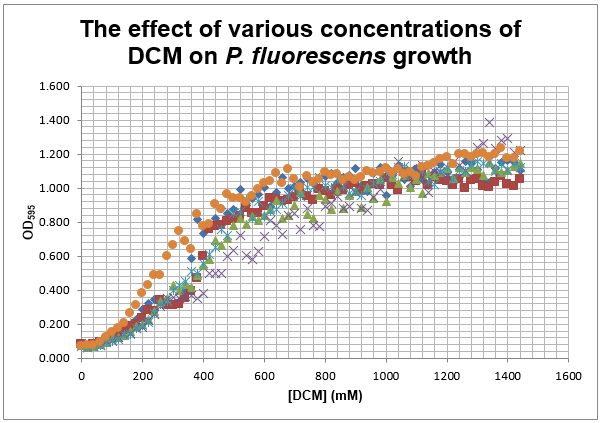
This experiment was repeated using P. fluorescens and the results are as follows:
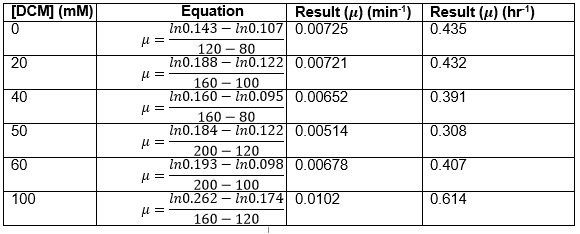
Straight lines from Graph C were then taken to calculate μ values as previously described. The results are shown below:
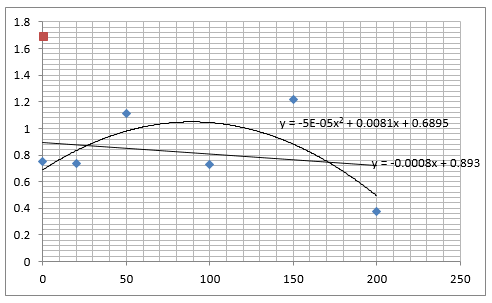
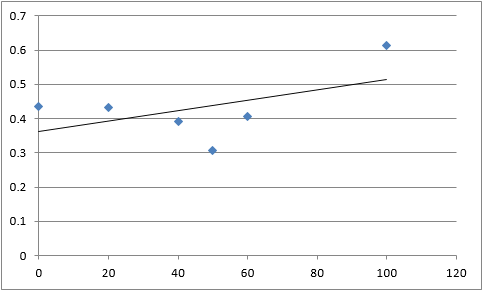
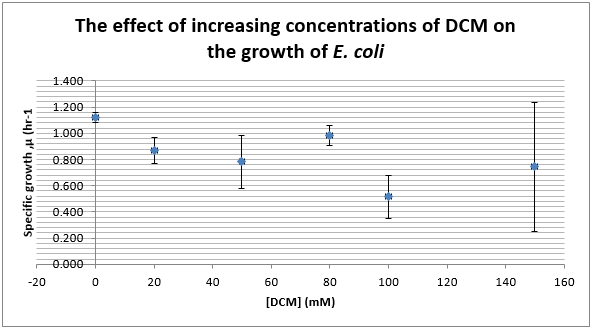
The graph below plots the data in the table for μ.
Again, two lines can be drawn, giving contrasting conclusions, we will perform repeats and determine the statistical significance of these data points. The experiments were then repeated with E. coli and the results are shown below.
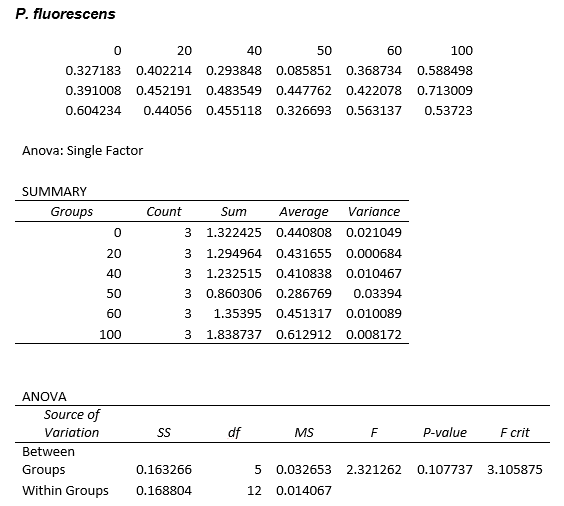
To test significance we will perform an ANOVA test on the data. It appears prima facie that the change is not significant, this is probably due to contamination and/or evaporation of the DCM from the wells.
In order to pinpoint the source of the contaminated control wells, I set up an experiment with Jack where we measured the UV-vis spectrum (initially between 800 nm and 200 nm) of 200 mM DCM (in media) with the baseline corrected to the media. We could not use pure DCM as it melted the cuvettes. The only peak from this broad scan was approximately located at 335 nm. This scan was performed at approximately 3:35. This peak was off of the absorbance chart, however we predict that if DCM can penetrate the plate seal, it will do so on the 24 hour time scale and will evaporate almost entirely and the peak will disappear. If this indeed happens after 24 hours then we can infer that the plate seals unsticking are the source of the contamination. There will be two conditions that we have not accurately repeated in this experiment compared to the plate reader experiments. These are the temperature (as the cuvette was left at room temperature rather than 30℃ and 37℃). The other control is the type of plastic of the plate reader, this may affect adhesion of the glue on the plate seal. There are also no cells in this, the interaction of DCM with the cells may produce something that might affect the seal of the plate.
Week 3
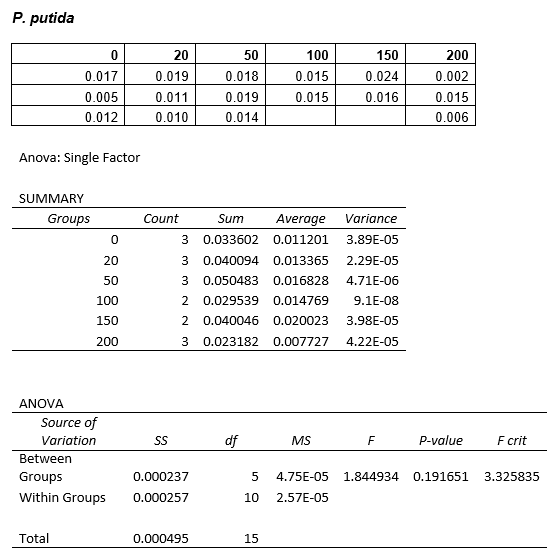
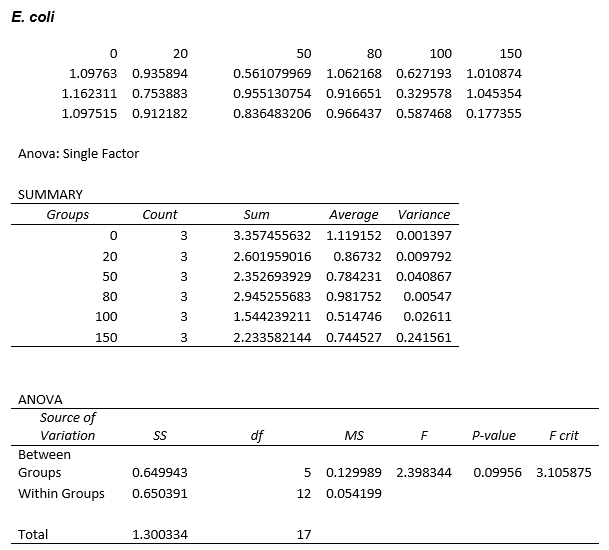
ANOVA tests were performed on all three of the data sets and this revealed that there is no statistical significance between the groups.
To allow for possible contamination we will repeat these experiment using air-tight glass conical flask to prevent spillage between wells, DCM reacting with the plastic or evaporation of the DCM.
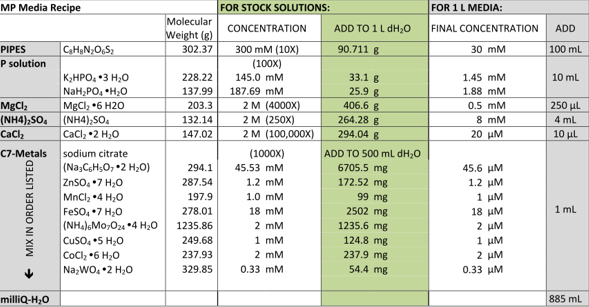
This week we have also finally managed to make media for the DM4 to grow in. Up until now all our media had been falling out of solution but we tried two different recipes with the ingredients sent to us from the media kitchen. The first recipe was as follows:
• 0.83 mL MgSO4
• 100 uL trace elements
• 99.17 mL minimal media
Where minimal medium used contained:
2 g/L KH2PO4
4 g/L Na2HPO4.2H2O
1 g/L (NH4)2SO4
1 g/L MgSO4.7H2O
To this 1ml of trace elements solution was added which contained:
1 g/L FeSO4.7H2O
1 g/L MnSO4¬H2O
0.25 g/L (NH4¬)6Mo7O24.4H2O
1 g/L H3BO3
0.25 g/L CuCl2.2H2O
0.25 g/L ZnCl2
0.1 g/L NH4VO3
0.25 g/L Co(NO3)2.6 H2O
25 g/L Ca(NO3)2
The second recipe was as follows, although we only made 100ml of solution and therefore divided all the amounts added by 10.
We decided to grow DM4 in 5 mL Duran flasks at 30℃, these flasks are airtight to prevent the DCM from evaporating. From our research in the literature we decided to use 120 mM methanol as the carbon source. The DM4 that we grew up in the different types of media appeared to grow. We decided to make a frozen stock of each of the 4 sub cultures.
We also made a 24-well plate containing DM4 bacteria with various concentrations of methanol and DCM.
Week 4
Unfortunately, none of the DM4 grew in the 24 well plate. The results of the plate are shown below.
In order to assess why this has happened we are growing up DM4 from frozen stock in the air-tight glass conical flasks at 20mM DCM and 120mM methanol.
This week our aim is to get started on assembling and sequencing biobrick plasmids, however this can't happen until the necessary constructs have been made. Primers have been designed and ordered for all the parts that we hope to synthesise so far. Also, we hope to improve on the microcompartment part in the registry, and so this week we have began to sequence this part ourselves.
Using theNanodrop protocol, I found the concentration of the DNA frozen stock of the pSB1C3 microcompartment, diluted it appropriately and sent it for sequencing.
Part B - Biosensor Development
Week 1
Tasks completed:
First attempt at swapping resistance gene for plasmid pME6010 from tetracycline to kanamycin.
Methods:
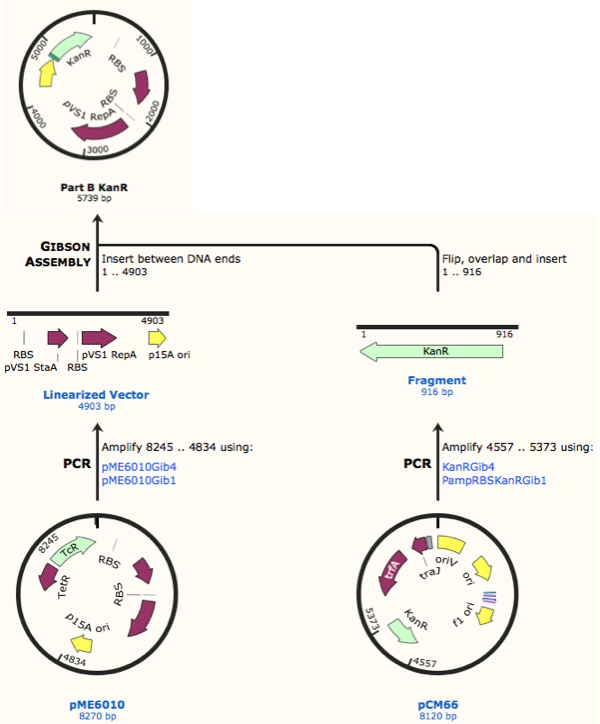
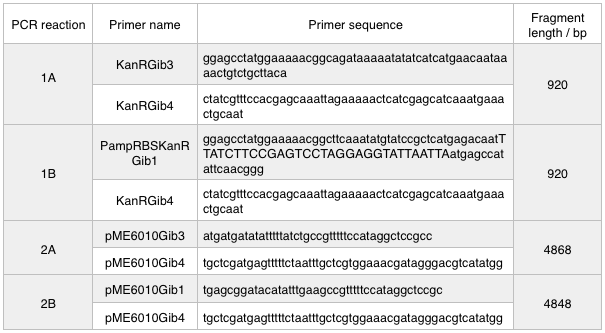
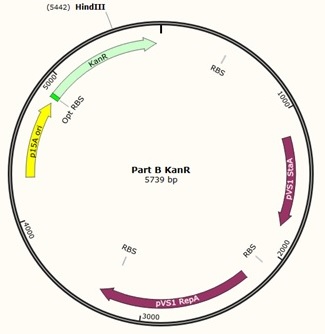
First, we designed forward and reverse primers for KanR (with native RSB and promoter) which we isolated from plasmid pCM66. The 5’ ends were complementary to the insert region of pME6010 (reaction 1).
We then designed forward and reverse primers to amplify the pME6010 backbone (reaction 2).
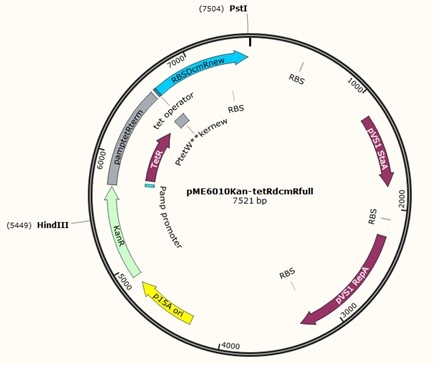
Further to this we redesigned each set of primers to incorporate an ampicillin promoter and optimised RBS (https://salis.psu.edu/software/) (B reactions) instead of the native promoter region (A reactions). This process is described in the following map:
The designed plasmids were as follows:
We ran these 4 PCR reactions as follows using the NEB Q5 PCR protocol:
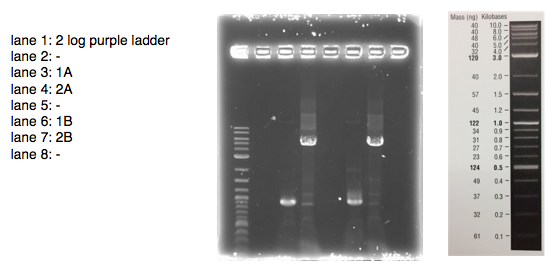
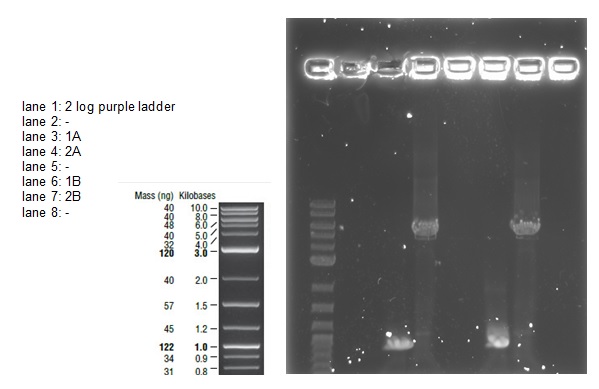
A 0.8% agarose gel was used for the extraction as this offered good separation around 1kb and 5kb. This gel was run and the bands extracted according to our QIAquick Gel Extraction Protocol using NEB purple loading dye and 2-log purple ladder and QIAquick extraction kit. Gel obtained:
As we later found out these NanoDrop readings are false since the QG buffer in the QIAGEN gel extraction kit interferes with the UV/Vis readings. Following extraction of our PCR products from the gel we used the NEB Gibson Assembly protocol to run an 8hr reaction over night. We ran an ‘A’ reaction which will insert the KanR gene into the pME6010 plasmid with the native promoter and a ‘B’ reaction that will insert the KanR gene with a pamp promoter and optimised RBS.
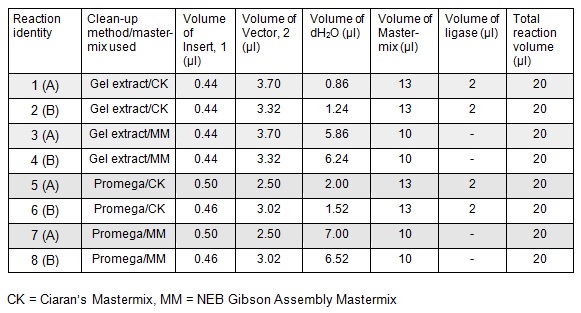
The volumes were chosen to satisfy 100ng vector with a 3-fold increase in the amount of insert. The insert amount must lie between 0.02 and 0.5 pmol and the total volume of total fragments cannot exceed 10µl. Following an overnight 8hr Gibson Assembly the reaction volumes were treated with Dpn1 restriction enzyme that cuts bacterial (methylated) DNA. We transformed the Gibson products into chemically competent DH5-alpha cells as well as into NEB alpha-5 cells. Unfortunately no colonies grew on a KanR plate! We know that the PCR products are correct so we think an issue may have arisen during the Gibson Assembly stage so we will re-do this part next week.
Week 2
Tasks completed:
Notebook:
To run equimolar amounts of insert to vector the following table was calculated:
These gibson assemblies were then transformed into E.coli cells using electroporation with the voltage at 1.8kV and the exposure time ranging from 4.8ms to 5.2ms. The cells were then recovered at 37ºC for 1.5 hrs before 100 µl was plated onto KanR plates. These were left overnight at 37ºC.
Unfortunately, there were no colonies grown and as we have no product from our gibson assemblies remaining we will have to repeat the process from Week 1 in order to trouble-shoot the method and get the desired plasmid. It is possible that we accidentally swapped the primers or PCR products around at some point and thus we had 1A with 2B and 1B with 2A in the Gibson assembly. These combinations are not complementary and thus the Gibson would fail meaning that none of our bacteria received intact Kanamycin resistance in the transformation. However there are many other reasons why the process may have failed therefore we went through the entire method trying to cover all instances where we may have made an error.
First we confirmed that the primer sequences on the delivery tubes matched what we had ordered. We ran the PCR as before; we re-calculated the annealing temperatures and extension times with the same result as last week.
In week one, we did the DpnI digest after the Gibson assembly and not directly after the PCR. This time we did the digest immediately after the PCR to ensure that all template DNA was destroyed before running on the gel, ensuring cleaner bands on our gel and less contamination from non-PCR products.
We loaded 20 μl of each PCR product onto a 0.8% agarose gel as before. The resulting bands were visualized after staining as shown below:
The bands are not as bright as in the first attempt probably due to less time spent in the ethidium bromide staining tank. The bands correspond with the correct sized fragments as before. This suggests there was no error in the PCR reaction with the exception of again mixing up the primers (the PCR would be successful with any combination of the primers for a 1 and 2 reaction). The bands are cleaner allowing us to try an alternative to the gel extraction in case that caused our assembly and transformation to fail.
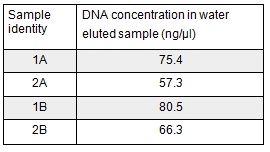
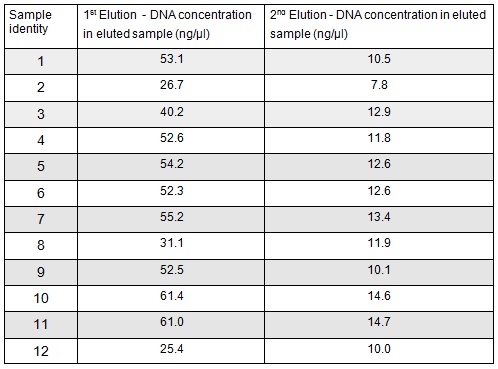
Next we excised and extracted our bands from the gel with the same QIAquick Gel Extraction Protocol protocol as before but with two changes. First we allowed additional drying time after the step involving ethanol supplemented buffer in case ethanol contamination inhibited the enzymes used in the Gibson assembly later in the process. We also replaced the 20 μl EB buffer with 20μl of MilliQ water. We did our second elution with the kit EB buffer. We then measured the concentration of DNA in each eluted sample using the nanodrop. This still gives us a reasonable idea (despite the interference from the remaining QG buffer residue) as to the amount of DNA in each sample from which to calculate our dilutions for the Gibson assembly reaction.
We used the remaining 10μl of our PCR products to do a Promega PCR clean-up and eluted using water. We gathered the following Nanodrop data:
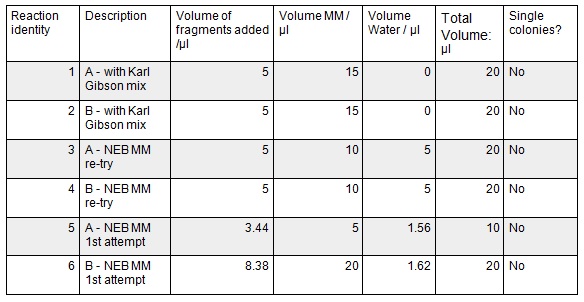
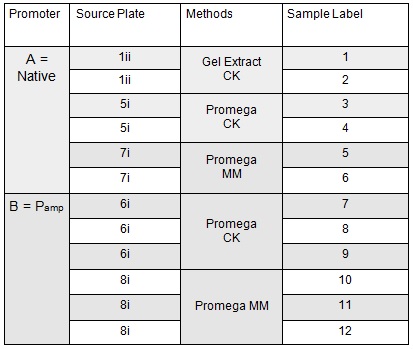
Next we ran the following Gibson assembly reactions:
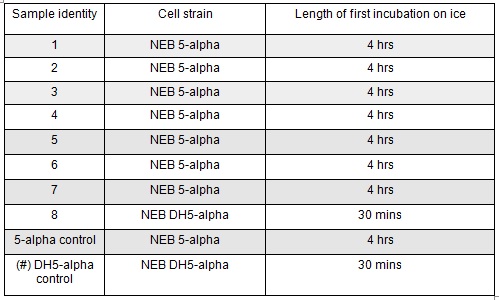
Next we transformed the Gibson assembly products into chemically competent E.coli cells. We decided to run a positive control for each kind of cell used using the pUC19 plasmid provided with the cells. Unfortunately we were limited with the amount of cells available and had to use two different cell strains; this resulted in some variation in the length of the first incubation with the DNA on ice as we began the transformation in the morning but then decided to pause the process so that the cells would be plated out later in the day in order to not have too much growth overnight. The NEB 5-alpha cells were also on ice slightly longer before the DNA was added.
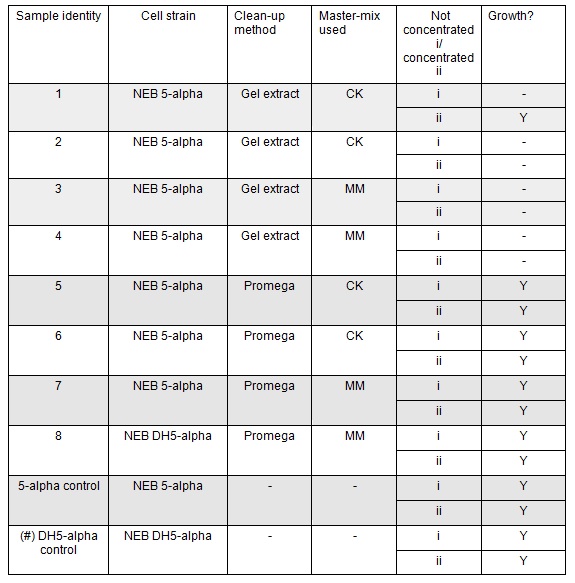
The cells were plated out after 1.5 hour incubation. It was noted that one of the sample appeared to have leaked from the Eppendorf into the petri dish containing all the samples in the incubator. We think it was the 5-alpha control as this was the only sample that appeared to have lost volume. Samples 1-8 were plated on Kanamycin plates (i) that we made up during the final incubation period. The remaining sample was re-suspended in ~100μl of SOC to create a concentrated solution of cells that were also plated out on kanamycin plates (ii). The two controls were spread on Ampicillin plates made up by Nick. All plates were placed in the 37⁰c incubator overnight. The results in the morning were as follows:
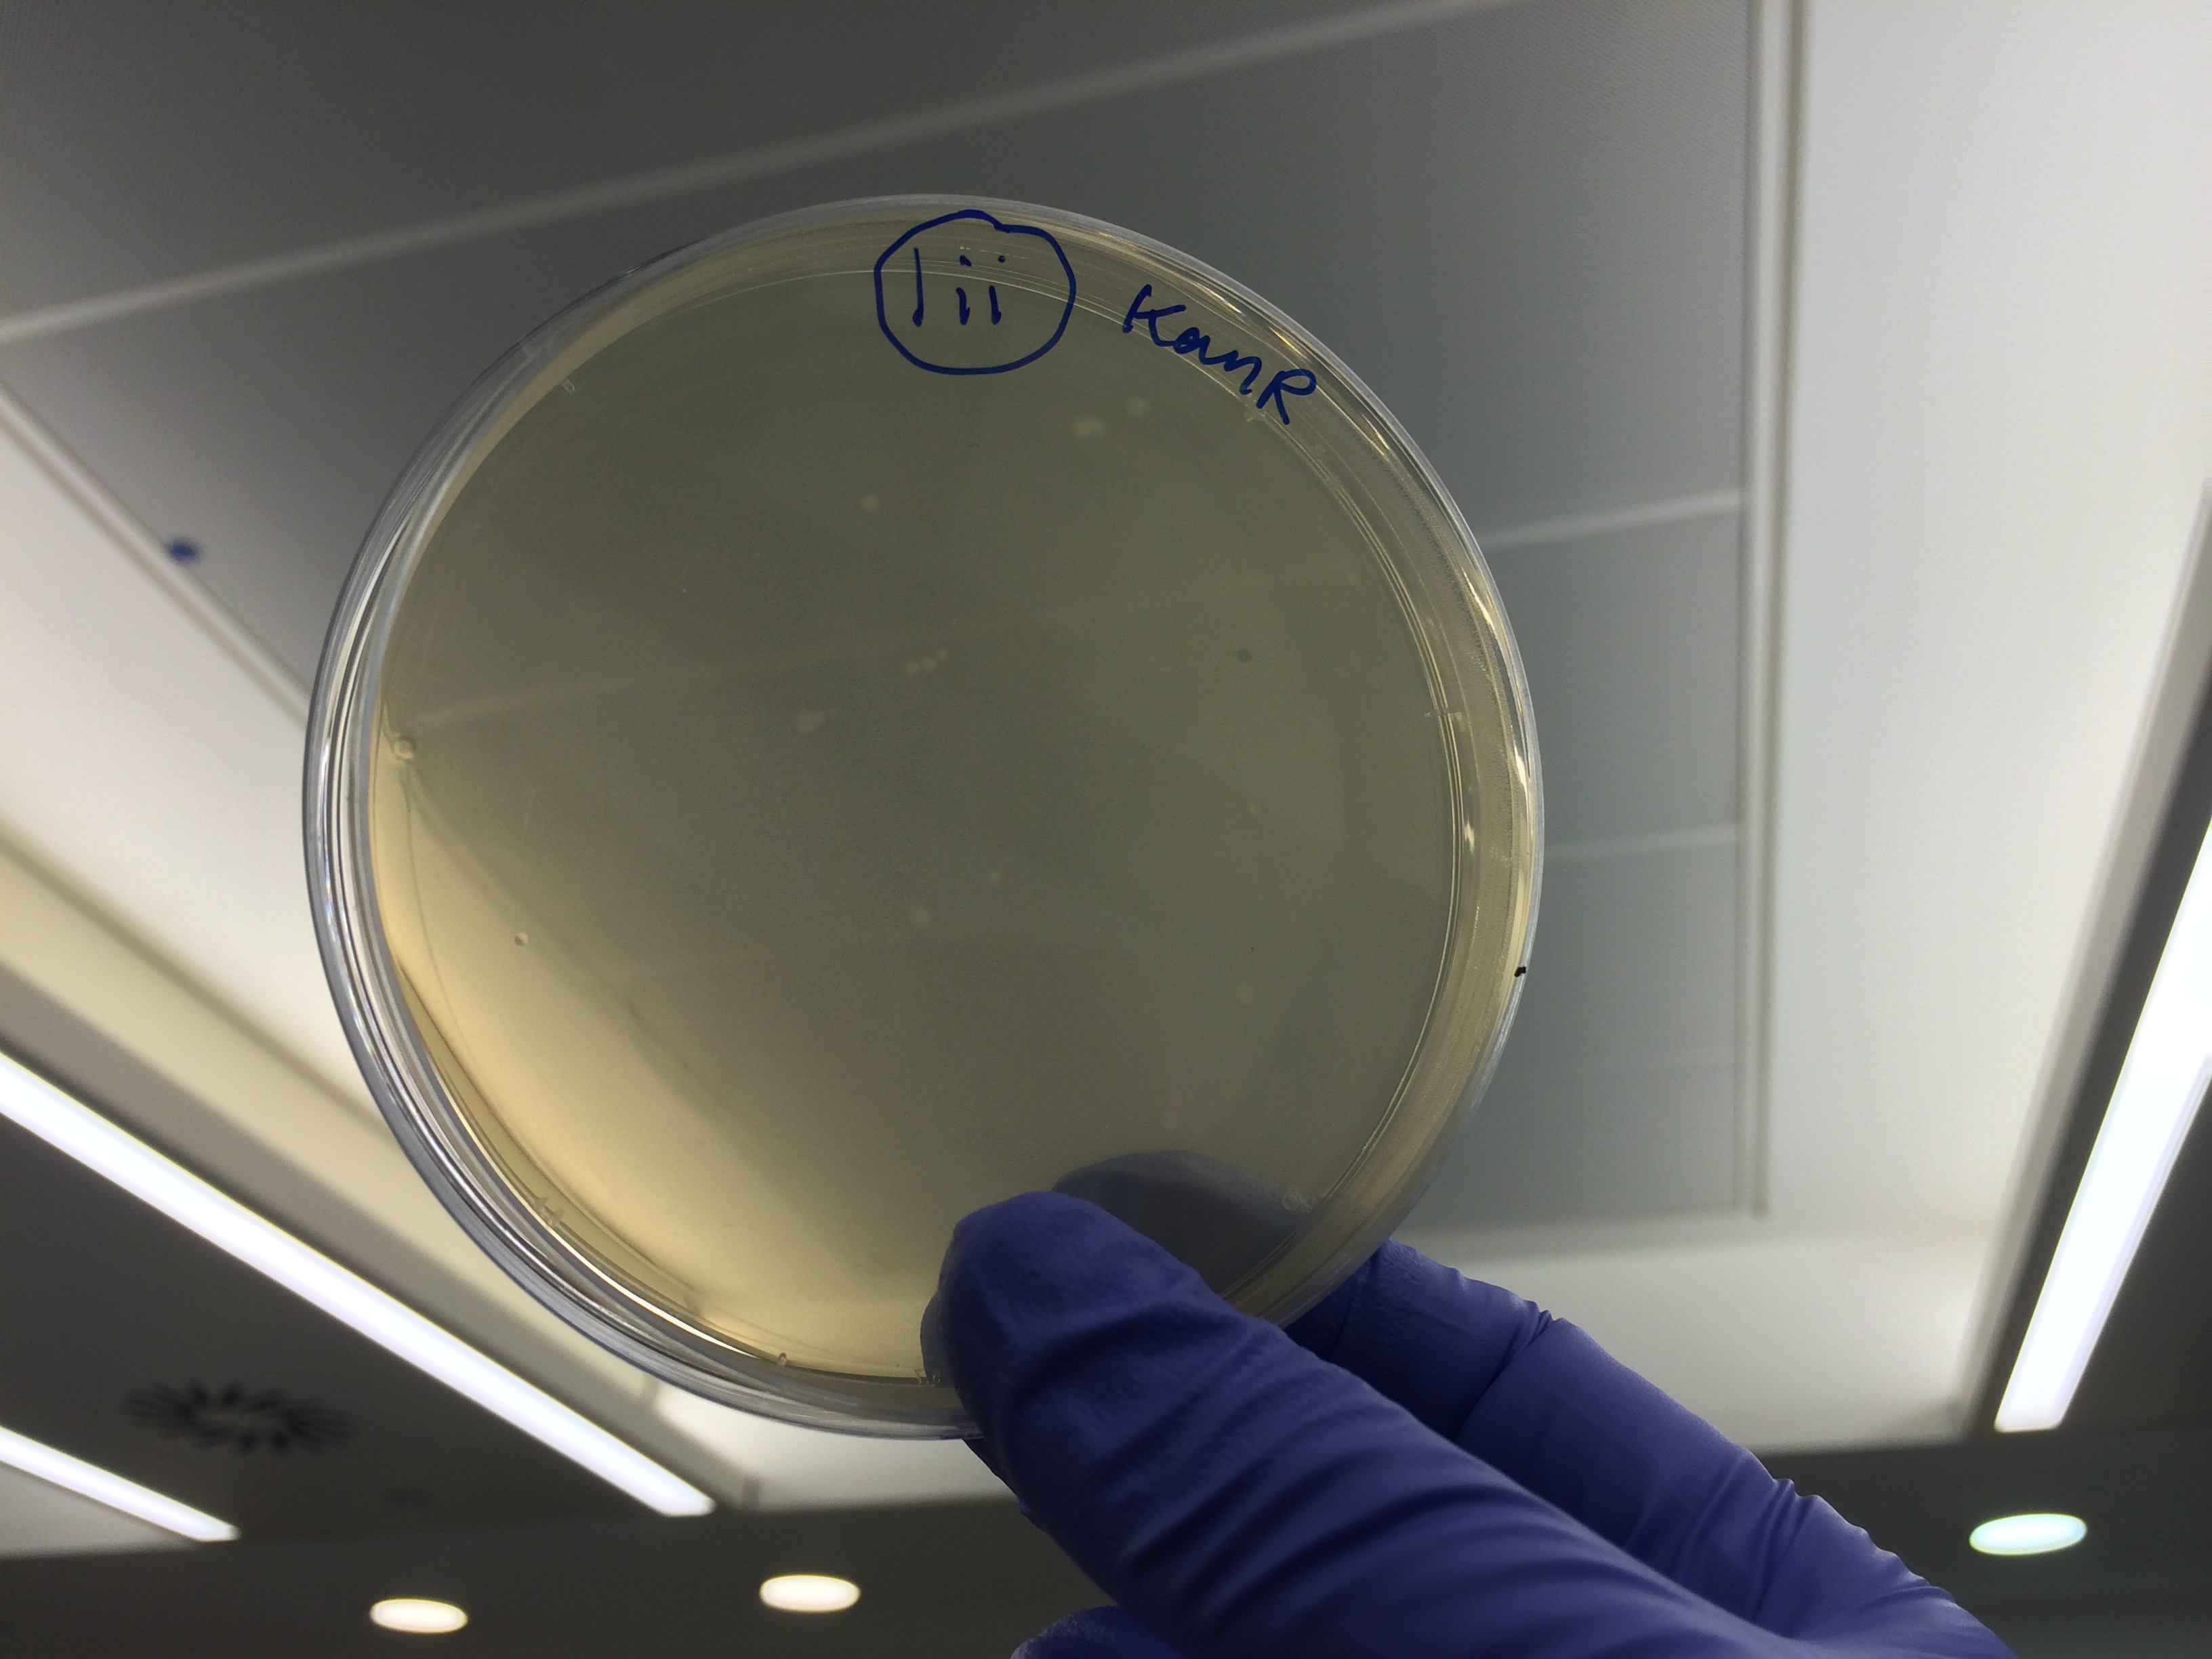
Apart from the concentrated sample 1ii, none of the samples prepared using the gel extraction protocol grew. Sample 1ii also had limited growth compared to the other plates with colonies:
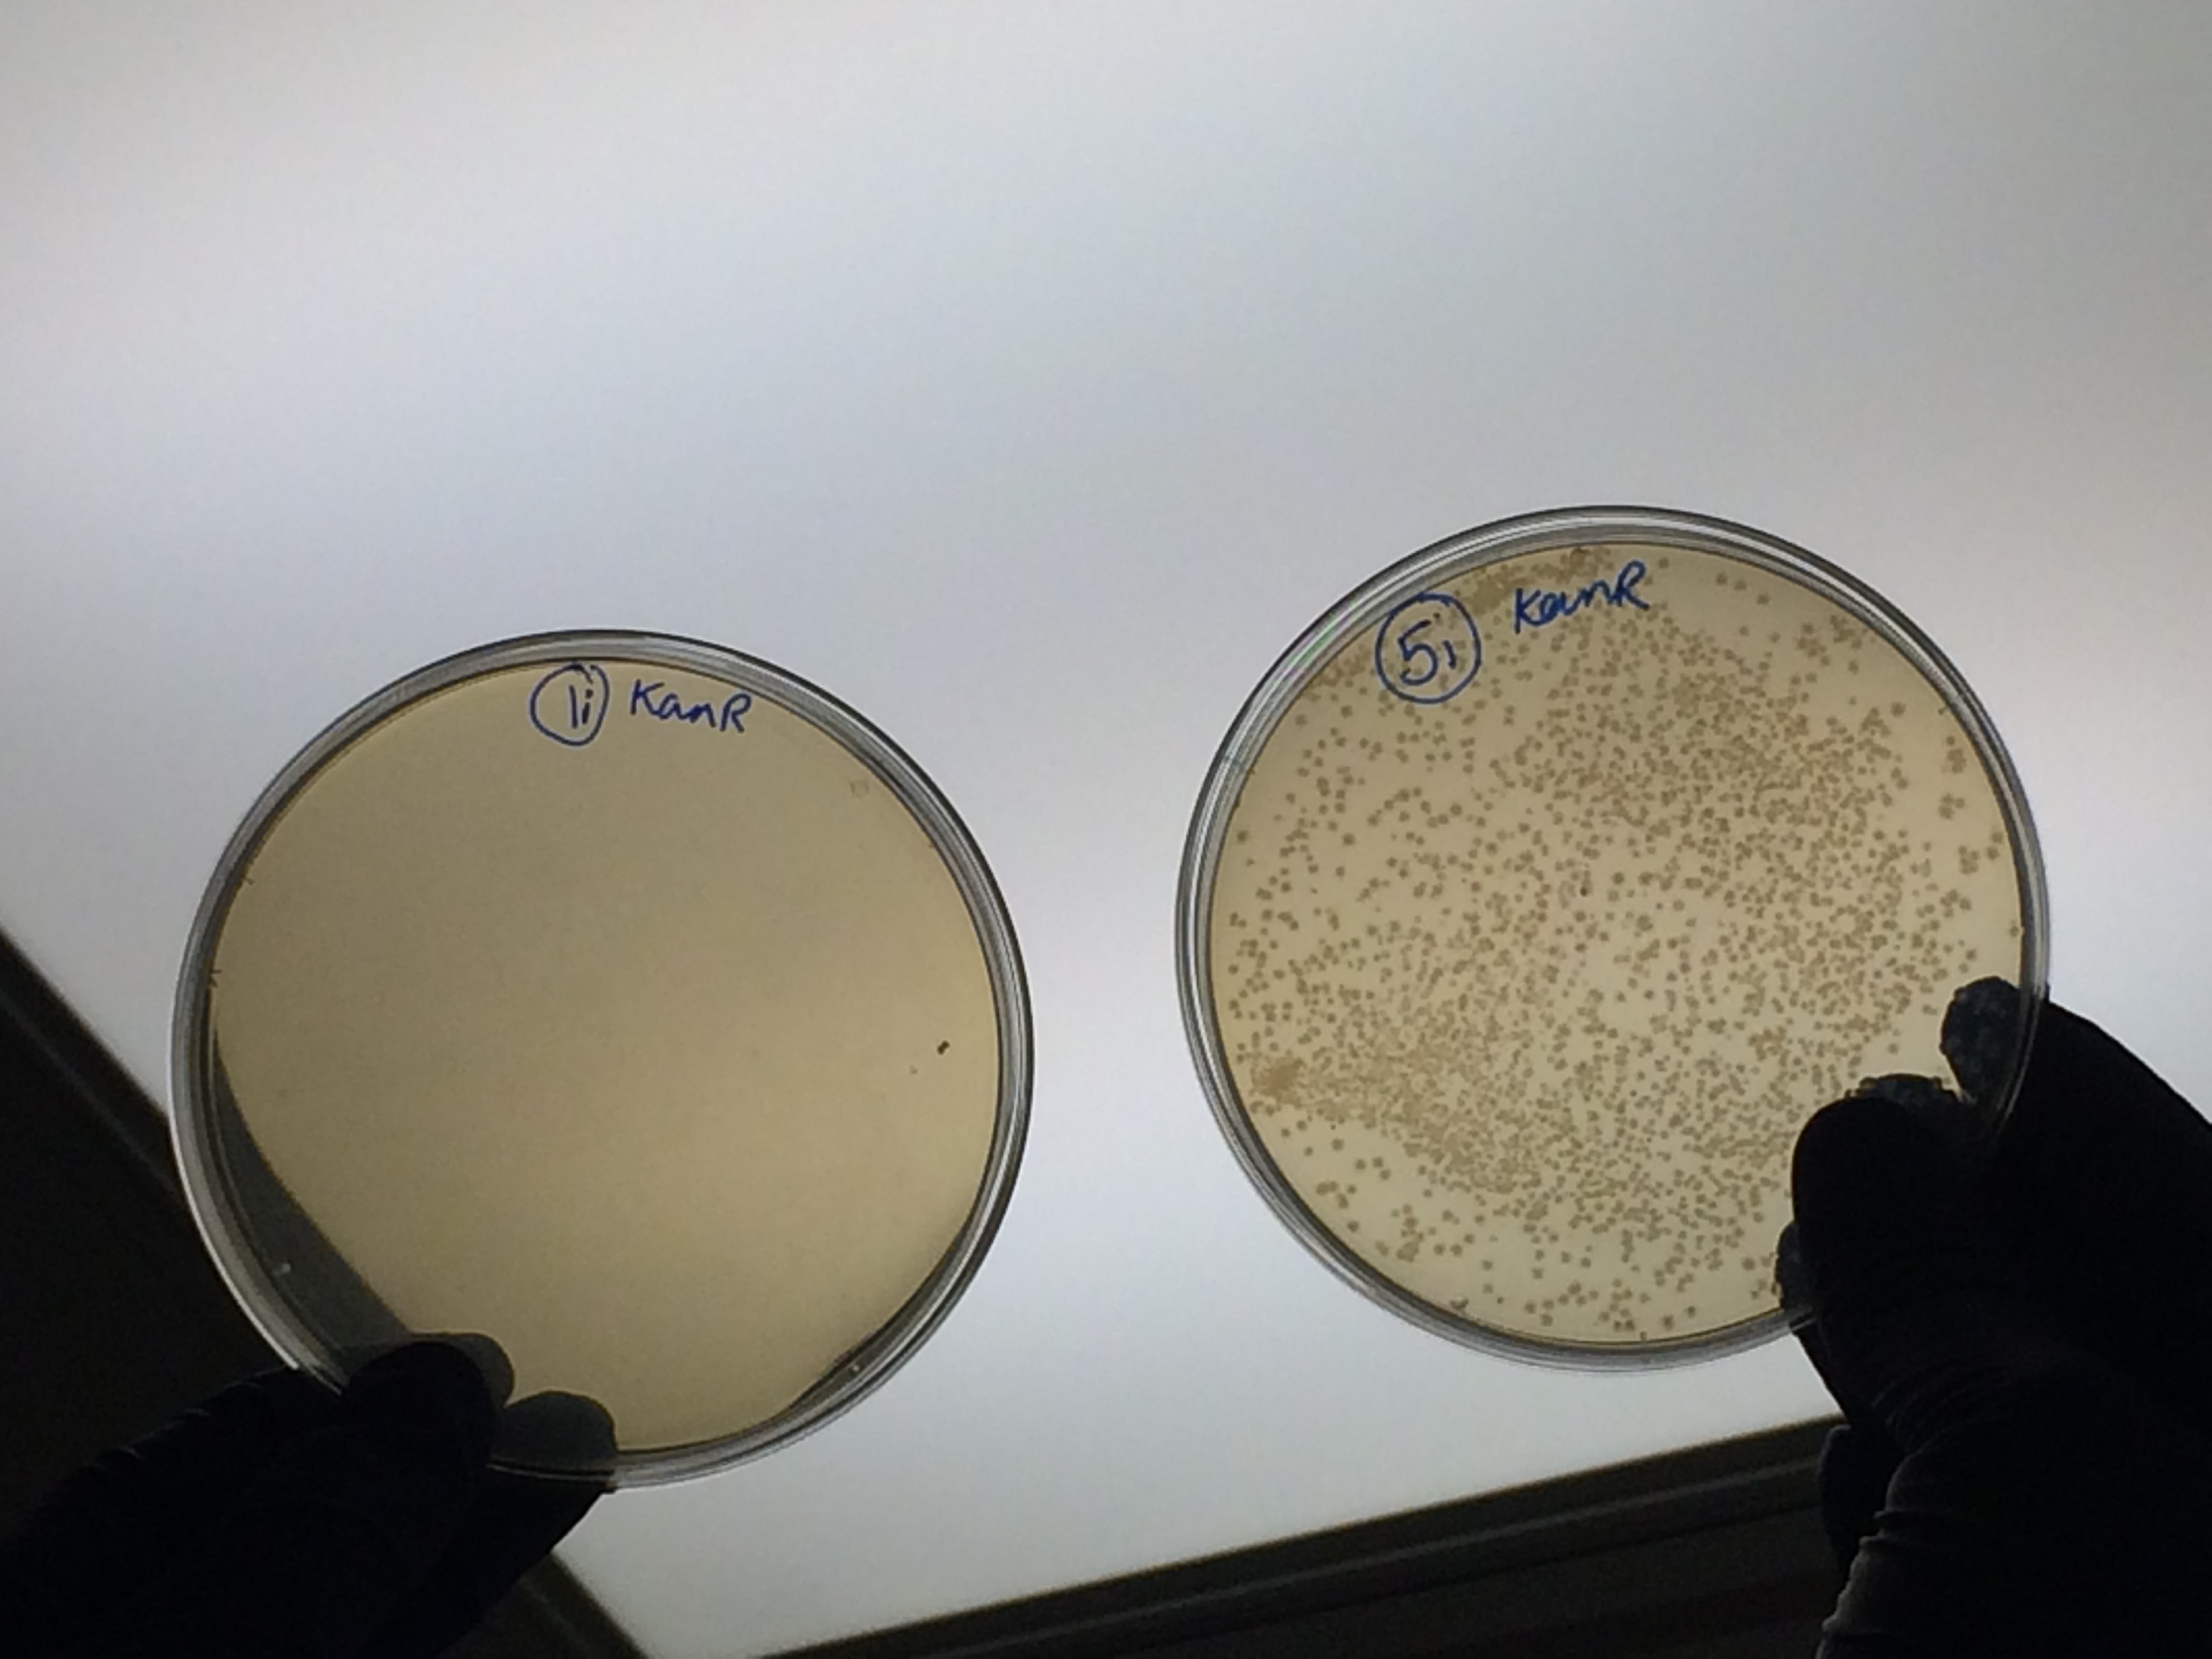
Samples 1i and 5i differed only in their clean-up method; 5i has lots of growth and 1i has none. This comparison holds true for Samples 2+6, 3+7 and 4+8 with the same result:
This suggests that we should use the Promega PCR clean-up kit and not the QIAquick Gel extraction. We will still run our samples on a gel to check the quality of our PCR reactions. We may investigate the Promega Gel extraction kit as this will enable us to pick our desired band out of a PCR that has also generated non-specific fragments which we cannot do with the Promega PCR clean-up protocol.
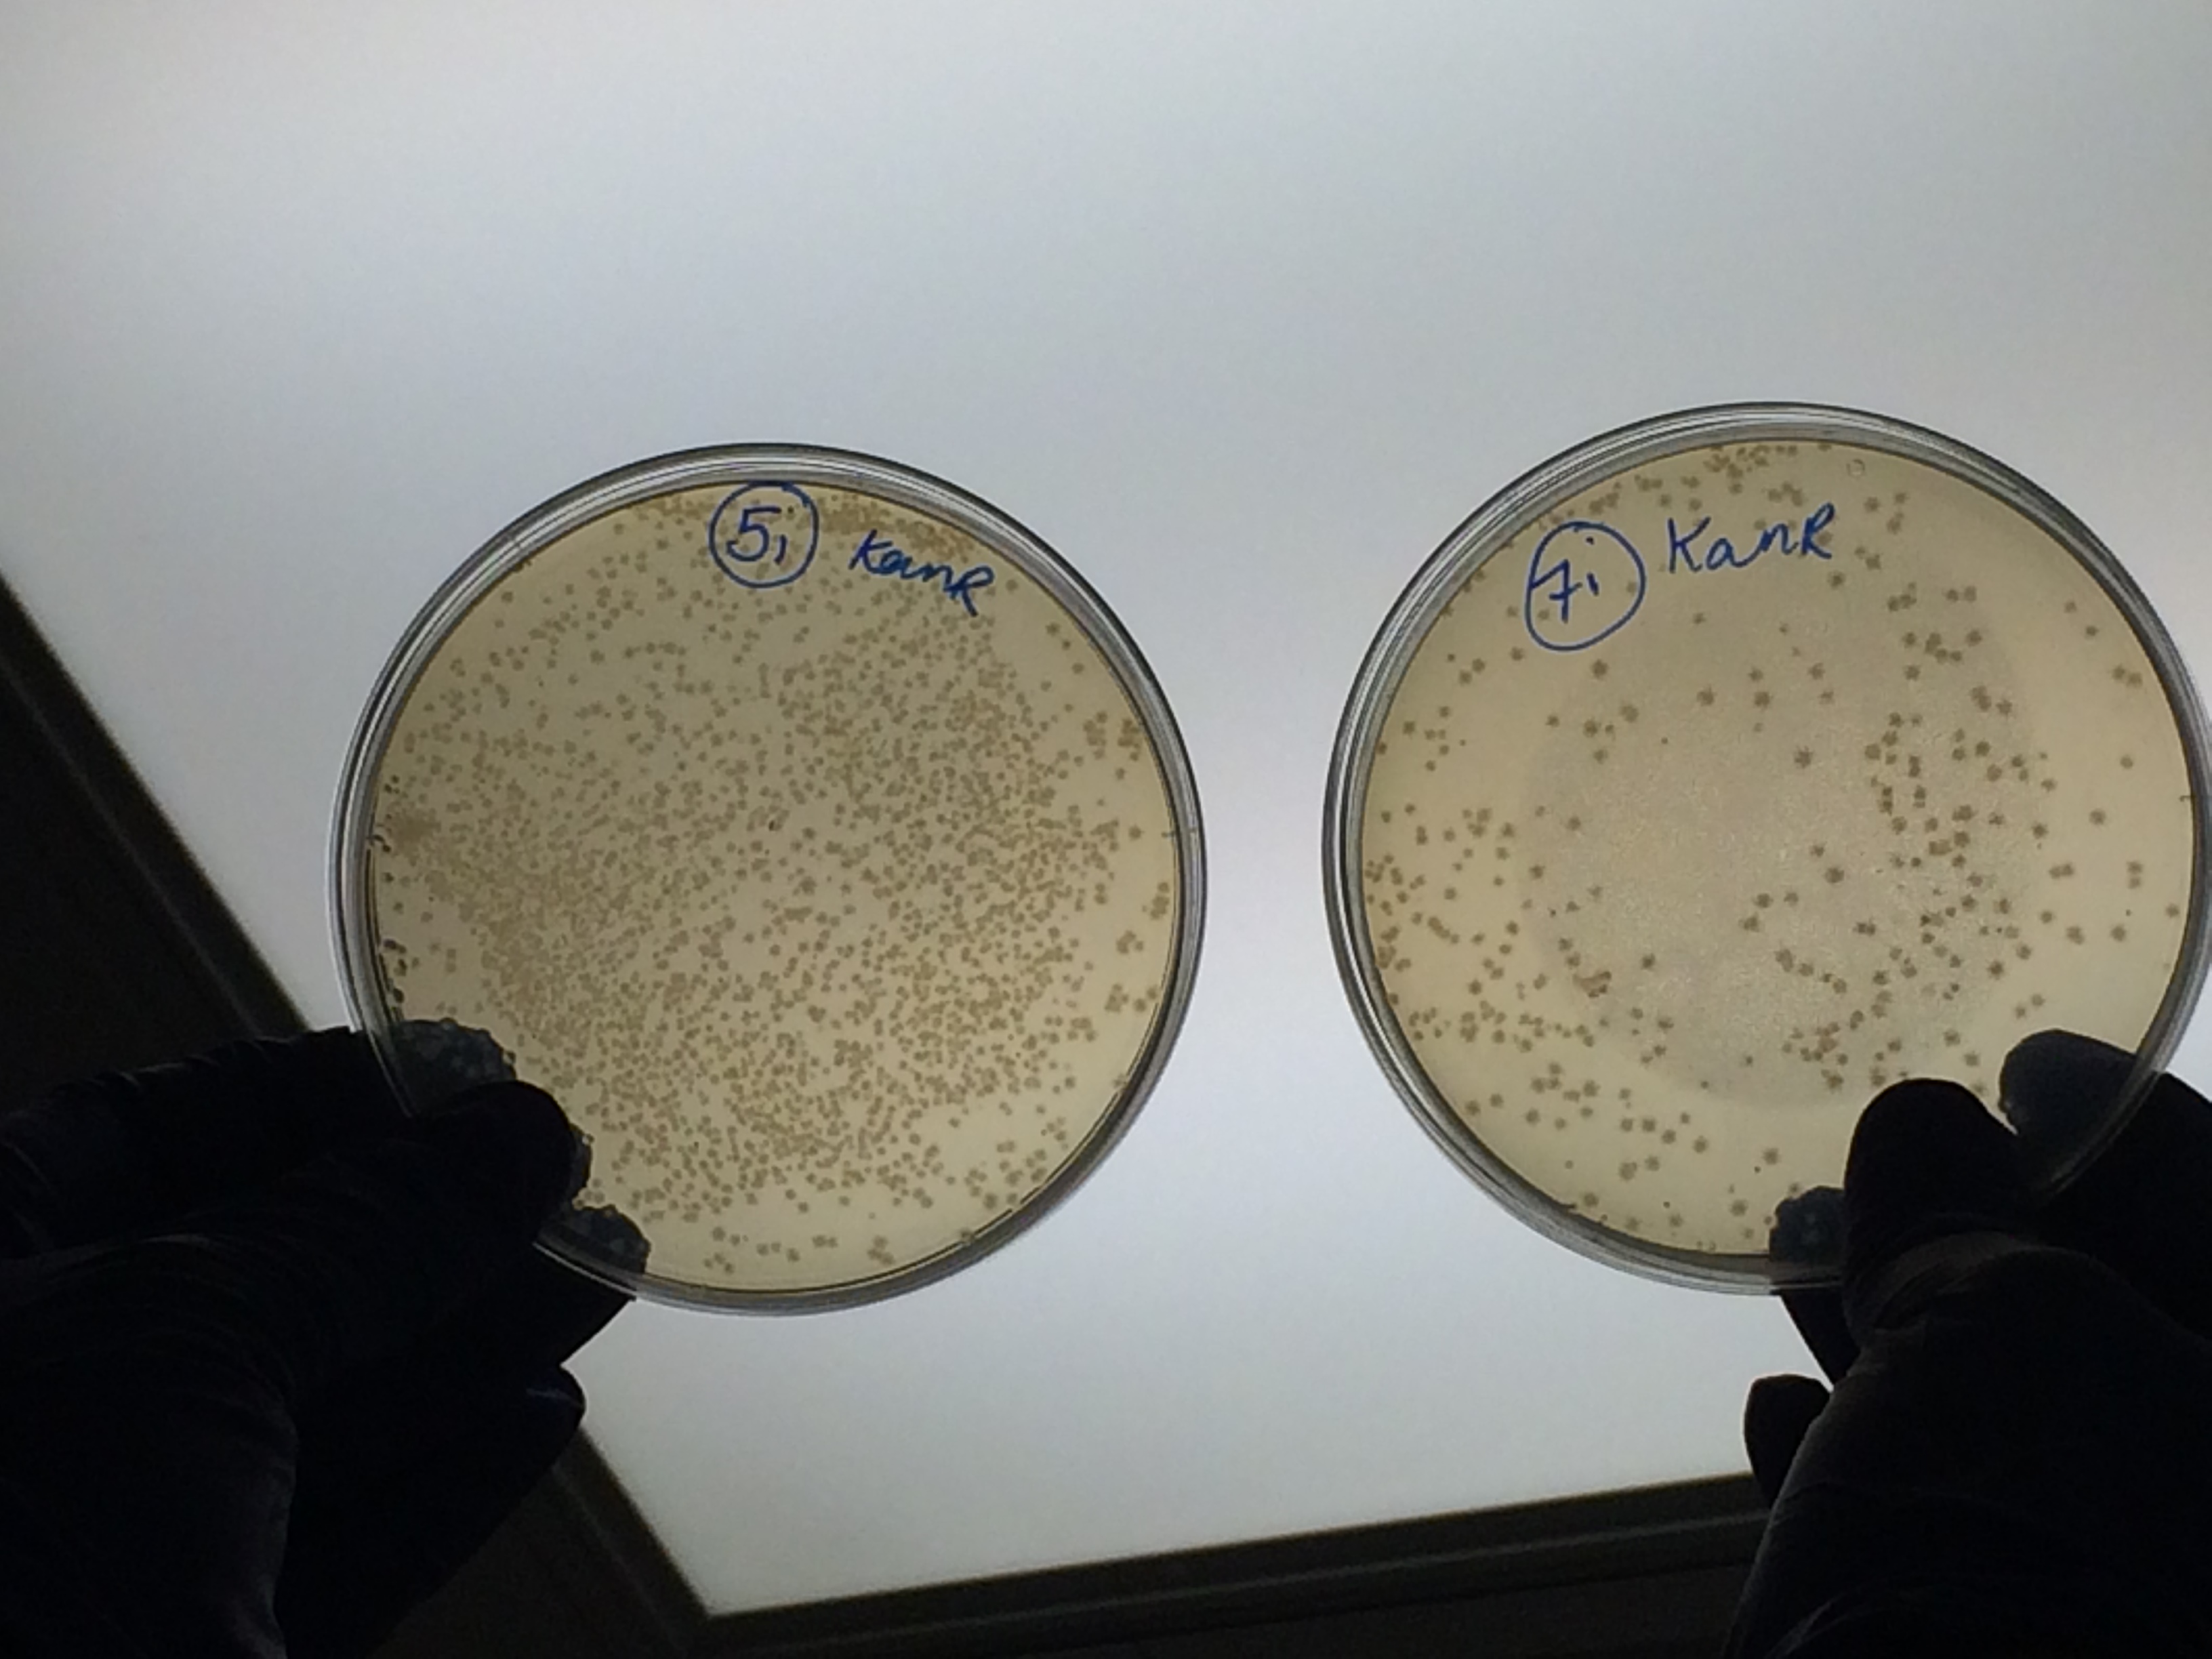
The samples that were treated with the master-mix and ligase supplied by Ciaran had more colonies than those that were treated with the NEB supplied master-mix as shown by the comparison between samples 5i and 7i:
This suggests that in future we should use the master-mix supplied by Ciaran.
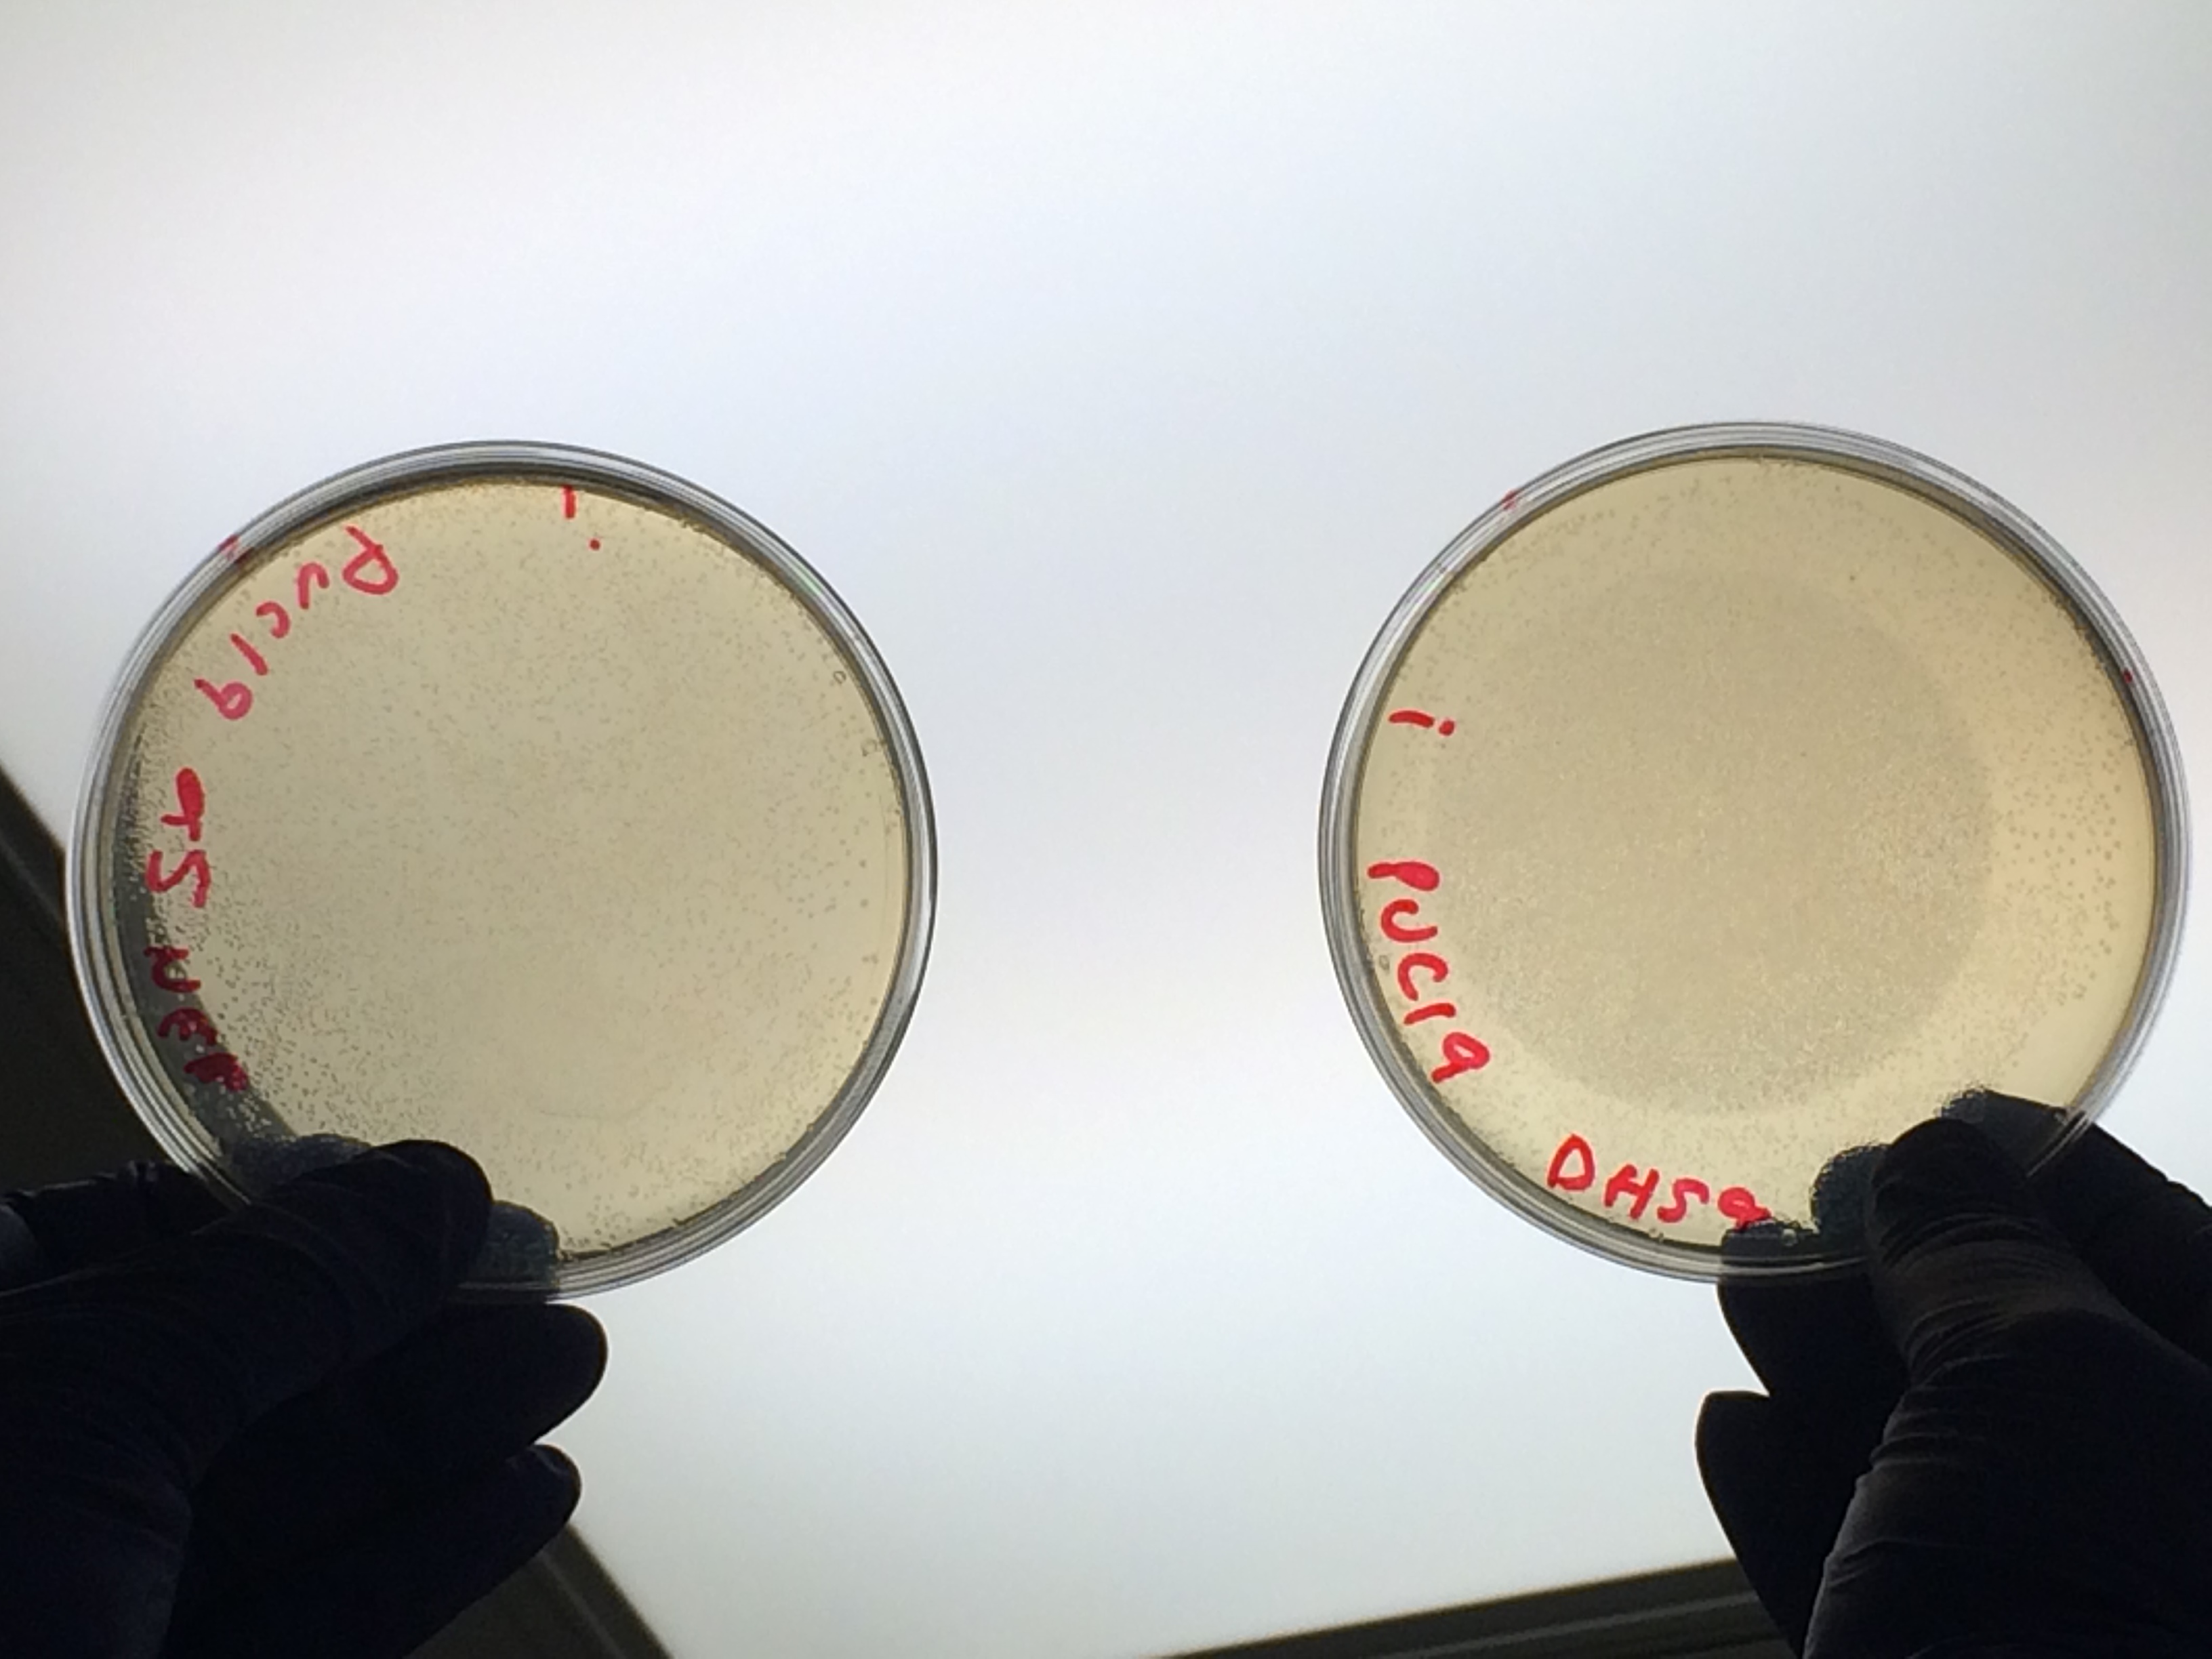
All the controls grew showing that the lack of growth of samples 1- 4 was not due to inefficient transformation:
There was no observable difference between sample 8 and sample 7 which were treated the same but which used different chemically competent cells. Thus we can continue to use either the NEB 5-alpha or DH5-alpha chemically competent cells.
There was no observable difference between the samples that correspond to A Gibson assembly reactions (template for PCR primers and therefore fragment = pCM66) and those that correspond to B Gibson assembly reactions (PCR primers and therefore fragment include Pamp).
We picked colonies from the successful plates to grow up cultures overnight:
We extracted the plasmids from each overnight culture using the Miniprep protocol. We centrifuged 250μl of cells and then added another 250μl and centrifuged in order to get as much DNA as possible. We eluted the each sample in only 30μl of elution buffer to concentrate the sample. We used the Nanodrop to measure the concentration of the plasmid:
We then prepared each sample for sequencing by SourceBioscience. N.B. each sample sent for sequencing was at a lower concentration than the optimal so we provided them with 5μl of the above concentrations (from the first elution only). Sequencing will hopefully confirm that the plasmid in each plate of transformed cells is the desired product. We are fairly confident that it is the correct product as the fragment we were inserting was the kanamycin resistance itself which is necessary for growth on the kanamycin plates.
Week 3
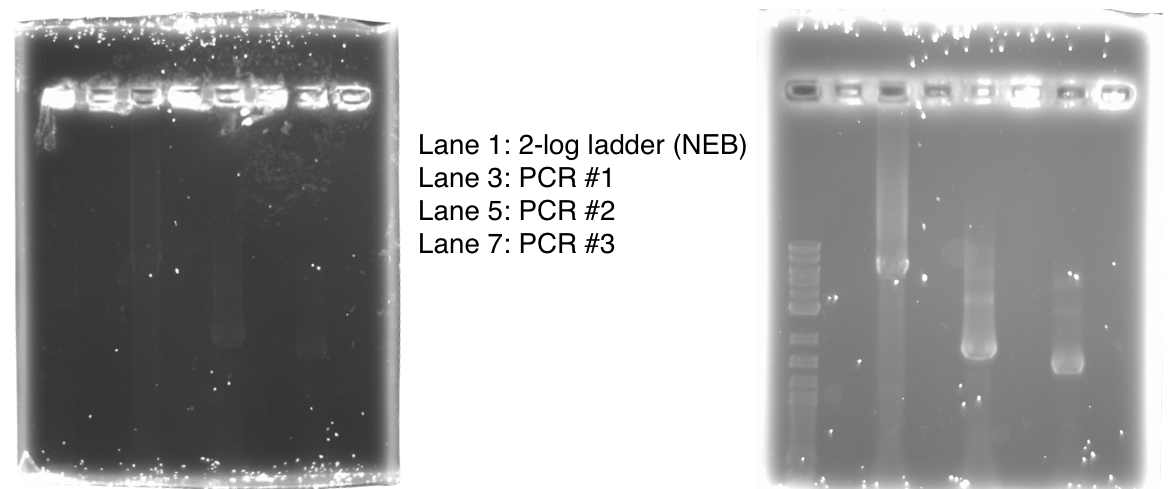
We used PCR to amplify the plasmid backbones of pME6010-KanR (from weeks 1 and 2) and pBBR1 MCS-5 which will host the gblocks for dcmR inducible production and the dcmA upstream region respectively.We ran the PCR product on a 0.8% agarose gel according to our Gel Electrophoresis protocol. After 40mins of EtBr treatment we saw no bands on our gel in any of the lanes (NEB ladder included) - seen below (left). To remedy this we first left the gel for a further 30min EtBr treatment. The gel is then shown below (right):
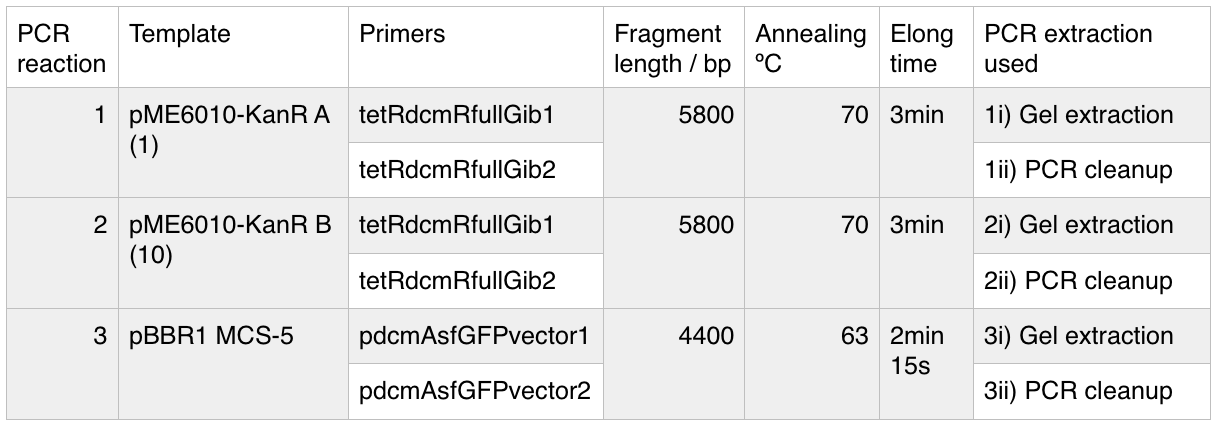
The gel showed bands of unexpected lengths. To test whether this could be because of unexpected DNA fragments being present we will digest each of our PCR templates with a uniquely cutting restriction enzyme: HindIII. With this, we would expect to see lengths of 5.6kb (pME6010-KanR) and 4.8kb (pBBR1 MCS-5). However, if we see a fragment of 2.6kb this means that the template plasmid, pCM66, from which we extracted KanR is still present. Its presence would have given a false positive result when grown on kanamycin plates. The resulting gel is shown below We then attempted a number of different PCR reactions to try and obtain better results. First we used the Gel extraction from the above gel as template. We extracted this gel using the promega gel extraction kit eluting in 30µl MilliQ water. This yielded a poor concentration of 8ng/µl. The next PCR to be done repeated the above one but at a lower annealing temperature to encourage initial annealing. The third PCR involved the other plasmid extraction from KanR plate 1ii (extraction 2 above). Finally, the pBBR1 MCS-5 (pSRKGm) template PCR will be repeated but at a higher temperature after a second annealing site was seen when the hybridisation parameters were set less stringent in SnapGene. These four PCR reactions are summarised below:
For these PCR reactions with a total volume of 25µl the following volumes were used
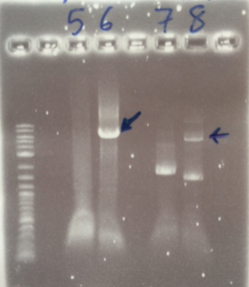
The PCR Gel is seen below. From this we can see that lowering the annealing temperature for plasmid 1 worked very well with an expected band of 5.8kb while the chase PCR (5) and plasmid 2 (7) did not work as well. The pSRK Gm (pBBR1-MCS5) plasmid PCR worked relatively well with a small band indicated. However, this was a weak band amongst some other, non-specific, bands.
We then extracted these bands using the QIAGEN PCR gel extraction as well as performing a Promega PCR cleanup on the remaining 15µl of the loading DNA. These clean-ups eluted the following concentrations:
Using these concentration values we set up the gibson reactions for each plasmid to insert the gblocks. Into pME6010-KanR goes RBSdcmRnew (fragment 1), ptetW****r (fragment 2), and pamptetRterm (fragment 3). Into plasmid pSRK-Gm goes pdcmAsfGFP (fragment 1). The Gibson reaction was set up to have the amount of vector between 30-100ng and the fragments in equimolar amounts with the total DNA volume not exceeding 5µl. To this was added 13µl Gibson Master Mix and 2µl Taq Ligase to make a total reaction concentration of 20µl.
These Gibson reactions were set up for 8hrs overnight at a temperature of 50ºC. In plasmid selection for PCR ID #6 was based upon sequencing data from Source Biosciences, Oxford using our 15A sequencing primer. This sequencing data shows the 6 candidate plasmids extracted from the KanR plates.
We treated the resulting Gibson assembly products with a PCR clean-up (labelled resulting samples 6i and 8i respectively) and gel extraction (labelled resulting samples 6ii and 8ii respectively). We then transformed these samples into chemically competent NEB alpha-4 cells. Having allowed these to grow up overnight on kanamycin plates we had colonies on all four plates. This confirms that the transformation worked but does not confirm that our Gibson assembly reaction was successful. We will test this next week so the plates have been placed in the cold room to prevent too much growth.
Week 4
Tasks completed:
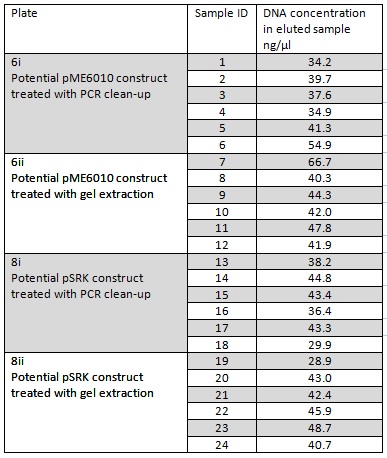
We grew up overnight liquid cultures of our Gibson assemblies. We extracted the plasmids from these samples (in order to get as much DNA as possible we used all the cells available resulting in several centrifugation steps to achieve a bacterial pellet before lysis). We eluted the each sample in only 30μl of elution buffer to concentrate the sample and the following NanoDrop data was acquired:
Samples 1-12 were prepared and sent for sequencing by Source Bioscience. N.B. each sample sent for sequencing was at a lower concentration than the optimal so we provided them with 5μl of the above concentrations. We ordered our own sequencing primer that would give a readout covering the backbone and our insert if it has correctly assembled in the construct, however this did not arrive in time. Instead we asked Source Bioscience to use a primer that is complementary to a region inside our insert. Our sample was unable to be sequenced which suggesting that the DNA the sequencing primer was complementary to was not in the sample. This indicates that our insert was not in the fragment and thus our Gibson assembly had not worked.
To test this theory we did a double restriction enzyme digest using HindIII and PstI using the following amounts and incubating at 37⁰c for an hour:
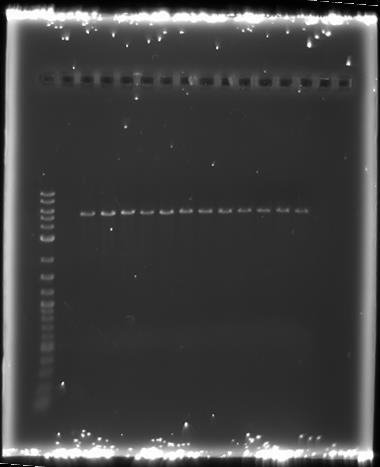
We ran these digests on a gel, the results of which are shown below:
All the samples we ran at approximately 5.5kb and were only cut once. This is what we would expect from the backbone without the inserts:
If the construct had assembled correctly we would have expected 2 bands one at ~2kb and one at ~5.5kb:
When our own primer arrived we re-sent samples 1-12 for sequencing with the new primer with the following results:
This further confirms our conclusion that our Gibson assembly reaction has failed and the vector backbone re-ligated without the insertion of the fragments.
To ensure that none of our colonies had the complete construct we selected 12 more colonies from plates 6i and 6ii and grew them up in liquid culture with kanamycin overnight (labelled 1B-12B). We then extracted the plasmids from the cultures and repeated the same double restriction enzyme digest with HindIII and PstI. We however found the same result as before with only a single band running at ~5.5kb:
This indicates that none of the colonies on our plate have the full construct but have the re-ligated backbone.
Sequencing data for samples 13-24 which potentially contain the pSRK-pdcmA-sfGFP construct came back as shown below:
This suggests that the pSRK plasmid backbone had re-ligated during the Gibson assembly without the G-blocks ligating.
Thus we will have to repeat the Gibson assembly for both our constructs. To this end we have used PCR to amplify the pME6010 Kan and pSRK Gm vector backbones, essentially repeating PCR reactions #6 and #8:
We will run a 2 hour DpnI digest on the resulting PCR products to ensure that there is none of the original template left. We will also run them very slowly on a gel to ensure maximum separation before excising the fragments and extracting them from the gel.
In addition to the above we made stocks of chemically competent MG155 E.coli cells to transform our plasmids into when we have succeeded in constructing them. We will make competent Pseudomonas stocks when we have our constructs completed as these need to be made only shortly before the actual transformation.
Part C - Catalysis Optimisation
Weeks 1 and 2
Tasks completed:
Notebook:
We grew bacteria containing pUni-ABTUNJK (1) and pSB1C3-ABTUNJK (2) in LB overnight. The bacteria were pelleted by centrifugation (twice, to make sure there is no medium left during the purification steps. We used the Miniprep kits to extract each plasmid and then measured the DNA-concentration using used the Nanodrop with the following results:
In order to transform the plasmids we will be working with into Pseudomonas, we have generated liquid cultures of both Pseudomonas putida (KT2440)and Pseudomonas fluorescens (SBW25).
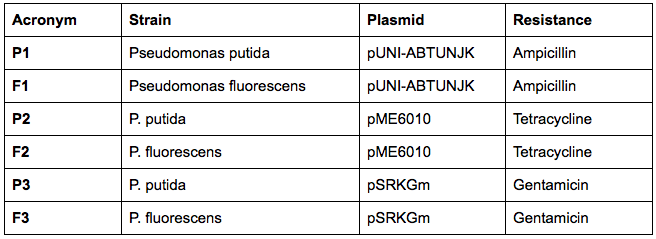
The next day, we have transformed the three plasmids listed below into both strains using the electroporation protocol for Pseudomonas:
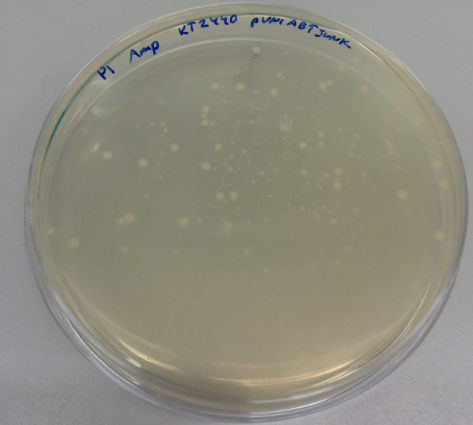
We have collected the plates from the previous day and found out that there was bacterial growth on all plates. However, the Pseudomonas fluorescens strain formed a big bacterial lawn on the ampicillin-containing plate, which could potentially suggest that Pseudomonas fluorescens is inherently resistant to ampicillin. The most important result is the fact that we managed to transform the pUNI-ABTUNJK plasmid into P. putida, especially since pUNI is not a plasmid designed for Pseudomonas strains:
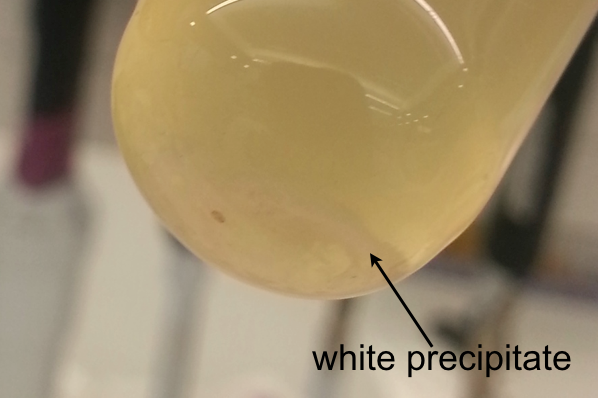
We have taken aliquots of the liquid cultures to generate frozen cultures according to our standard protocoll. However, we found a white precipitate in the liquid culture of P1 (Pseudomonas putida with the pUNI-plasmid). To make sure that this is not a contamination we generated five liquid cultures of P1 from the original plate to grow them overnight. Again, in all five replicates, we could see a white precipitate:
We are not entirely sure why the white precipitate forms, the plasmid might cause a stress response of the cell.
To test whether our Pseudomonas fluorescens strain is actually resistant to ampicillin, and whether there are any other resistances, we plated out both WT-strains on ampicillin, gentamicin, kanamycin, tetracycline and chloramphenicol-plates. In fact, the next day, we found Pseudomonas fluorescens growing on the ampicillin-plate and Pseudomonas putida growing on the chloramphenicol plate.
So far we have inserted the pUNI-plasmid containing the subunits for the microcompartment into P. putida. However, in order to test whether these subunits are in fact expressed in P. putida we prepared a western Blot by making a RAPID reducing buffer and a Blotting Buffer. We spun down 5mL aliquits of the liquid cell culture for 10 minutes at 2000rpm. After removing the supernatant, we resuspended the the pellet in the SDS-loading buffer. After freezing at -20°C for one hour and then boiling for 10 min. (to denature the proteins), we stored the samples ready for the Western blot in the -20°C freezer.
Week 3
Tasks completed:
Early this week we designed primers for inserting the wild-type dcmA gene and its upstream region into DM4.
In order to confirm our transformation of the pUNI-ABTUNJK into P. putida, we carried out a His-Tag In-Gel Stain of 3 samples of cultures grown overnight. This was followed by Coomassie staining to detect the total amount of protein present. While a large amount of protein was observed in the sample lanes, no clear bands were detectable
We also carried out a Western blot of the same 3 samples. Unfortunately, none of the sample lanes showed any chemiluminescence.
 "
"
