Team:CU-Boulder/Notebook/Measurement
From 2014.igem.org
Contents |
Week 1
7/1/14
Dry Lab only: Planning and research into this study. From the description on iGEM’s website
(https://2014.igem.org/Tracks/Measurement/Interlab_study):
The first device is already built and available in the distribution kit. The second and third devices must be built using the BioBricks standard protocol by the teams participating in this study.
1. Existing device: BBa_I20260 (J23101-B0032-E0040-B0015) in the pSB3K3 vector. Kit location Plate 4, Well 18A
2. New device to be built by the iGEM team: BBa_J23101 + BBa_E0240 (B0032-E0040-B0015), must be built in the pSB1C3 backbone Kit locations BBa_J23101 (called BBa_K823005 when in pSB1C3): Plate 1, Well 20K BBa_E0240 (in pSB1C3): Plate 2, Well 24B
3. New device to be built by the iGEM team: BBa_J23115 + BBa_E0240 (B0032-E0040-B0015), must be built in the pSB1C3 backbone Kit locations BBa_J23115 (called BBa_K823012 when in pSB1C3): Plate 1, Well 22I BBa_E0240 (in pSB1C3): Plate 2, Well 24B
PLEASE NOTE: The J23115 part in this year's distribution kit has two mismatched basepairs and instead matches the K823012sequence (which was already known to have these mismatches). You can either (a) use the J23115 part as distributed or (b) re-clone J23115 and correct the mismatch. Please let us know which path you will choose at measurement at igem dot org.
Thank you! (*This note was not originally on the webpage – it was added around July 12th)
7/3/14
Resuspended DNA from 2014 distribution kit to obtain the 4 parts/devices needed for this study Transformation of Device 1 (I20260) into BWF+ comp cells - Two reactions were performed according to transformation protocol, one is negative control - Heat shock was done for 45 sec - Cultures were plated at full strength and 1:10 dilution with 20 uL each
Week 2
7/7/14
Examined plates and observed that growth occurred on both, including the negative control plate. This reveals a problem. It was later discovered that the BW comp cells used in this transformation have Kan resistance, thus explaining the growth on the negative control plate. Transformation will need to be repeated using different comp cells; DH5 alpha cells have been suggested and are available. - Notation: K will be used for Kan plates and C for Chloroamp.
7/10/14
Transformation of all the parts needed from the distribution kit was performed. Each well in the distribution kit from iGEM contains 2-3 ng of DNA. So each transformation contains 200-300 pg/uL. All reactions were done following standard transformation protocol including 45 sec heat shock at 42°C. DH5 alpha comp cells were obtained from Dowell Lab for the reaction.
Sample Volume DNA Volume Comp Cells I20260 (Dev1) 1.5 uL 40 uL J23101 1.5 uL 40 uL J23115 1.5 uL 40 uL E0240 1.5 uL 40 uL Neg Control (1.5 uL MQ H2O) 40 uL
Following the transformation, 25 uL of mixture plated full strength on u of plate, 20 uL at 1:10 dilution plated on other u of plate containing the appropriate antibiotic.
Week 3
7/14/14
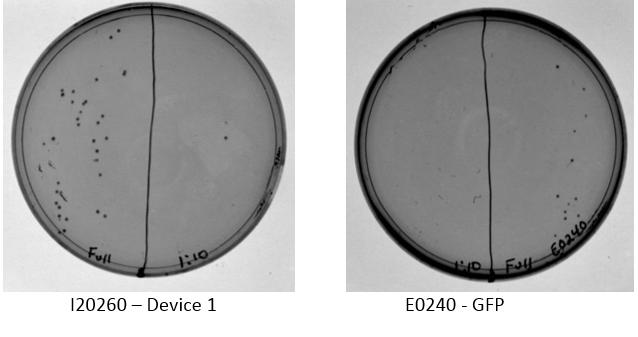
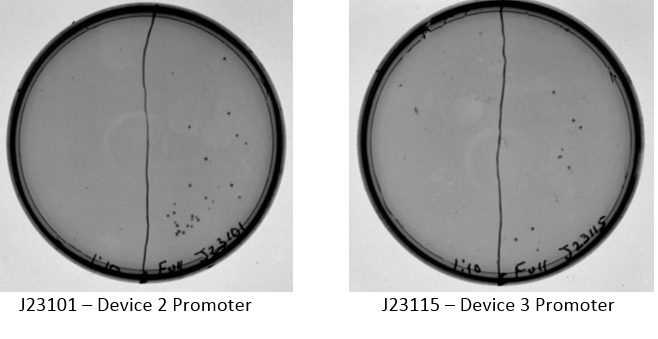
Examination of plates from transformation shows various single colonies in the full strength and very few, if any colonies on the 1:10 dilution side of plates. This may indicate low transformation efficiency or could be due to slow growth of comp cells, which was observed by other iGEM students. Plates images shown below. Colonies were taken from I20260, E0240, and J23101 plates for overnight cultures in the appropriate antibiotic.
7/15/14
Minipreps were done according to manufacturer’s recommendations for each of the overnight cultures. Bacterial pellets were made with the remainder of the cultures. Nanodrop performed on the miniprepped products as shown below:
| Sample | ng/ uL | 260/280 | 260/230 |
|---|---|---|---|
| Dev1 (I20260) | 43.9 | 1.93 | 2.13 |
| J23101 | 54.7 | 1.88 | 2.15 |
| E0240 | 13.2 | 1.92 | 1.10 |
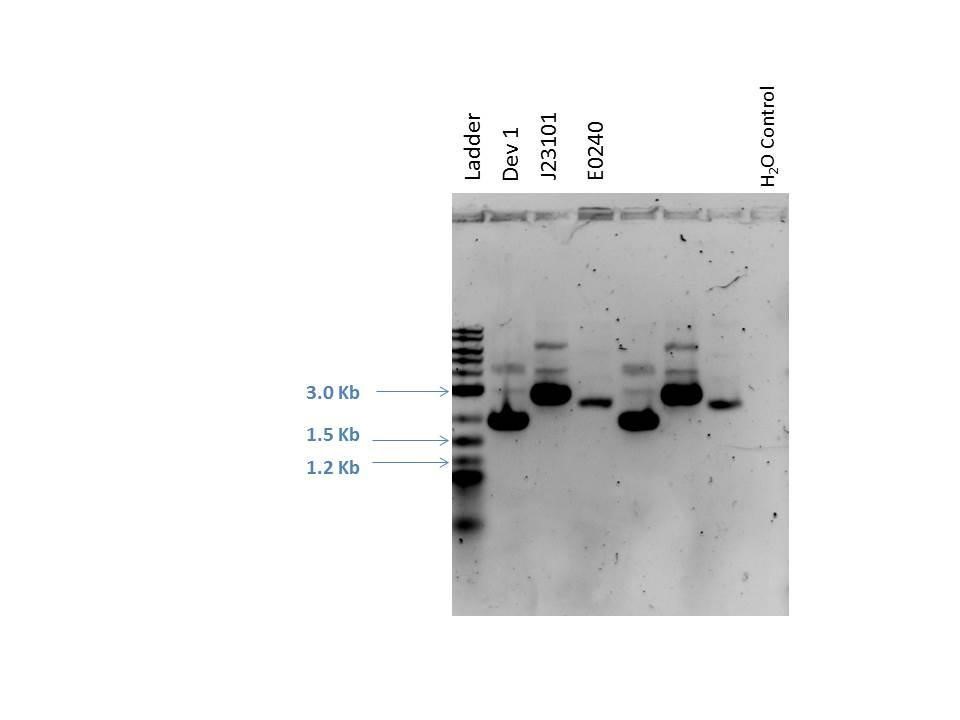
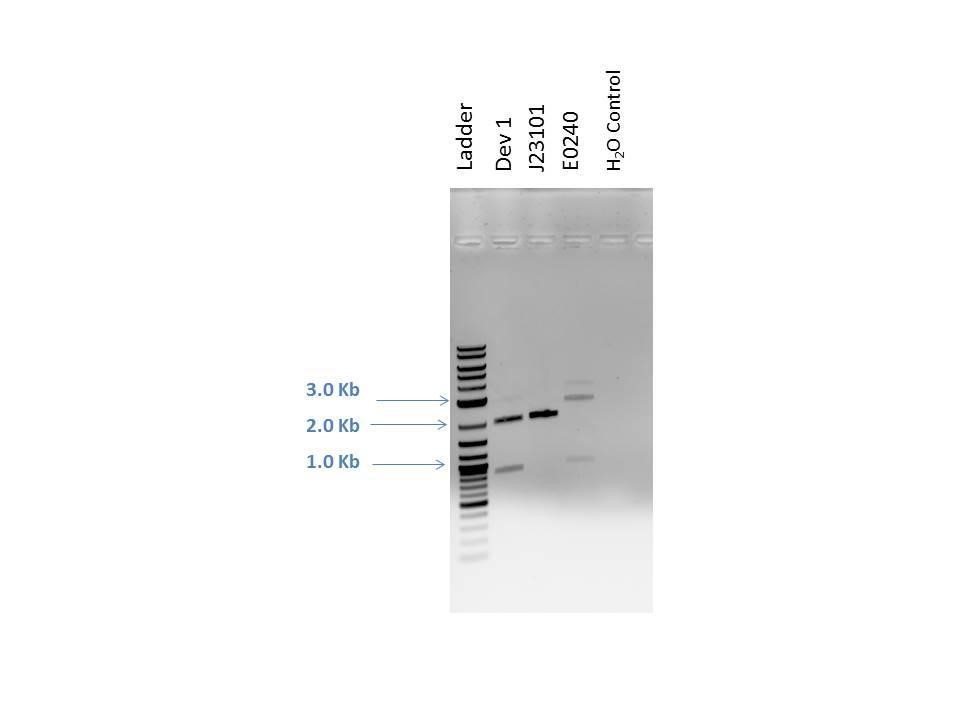
Gel electrophoresis was performed on the products. A 1% agarose gel (0.3 g agarose) with 3.0 uL EtBr in 30 mL TAE was prepared. 5 uL of a 2-Log DNA ladder was loaded followed by 5.0 uL of each sample with 1.0 uL loading dye into the following lanes:
| Well | Loaded | Expected Size (bp) |
|---|---|---|
| 1 | 2-Log DNA Ladder | N/A |
| 2 | D1 (I20260) | 3669 |
| 3 | J23101 | 2100 |
| 4 | E0240 | 2946 |
| 5 | D1 (I20260) | 3669 |
| 6 | J23101 | 2100 |
| 7 | E0240 | 2946 |
| 8 | H2O Control | -- |
As seen from the gel (shown above), various bands are visible for most of the samples. Since these are uncut plasmids, it is assumed that this is from supercoiling.
7/16/14
Restriction Digestion was performed on the 3 samples, followed by gel electrophoresis to analyze the products isolated. The digestion was done according to protocol using a 1 hour digestion at 37 °C followed by 20 min heat inactivation at 80°C. Enzymes and buffer obtained from NEB.
| I20260 | J23101 | E0240 | |
|---|---|---|---|
| CutSmart Buffer | 5.0 uL | 5.0 uL | 5.0 uL |
| PstI | 1.0 uL | 1.0 uL | 1.0 uL |
| SpeI | -- | 1.0 uL | -- |
| XbaI | 1.0 uL | -- | 1.0 uL |
| DNA (250 ng) | 5.7 uL | 4.6 uL | 18.9 uL |
| MQ H2O | 37.3 uL | 38.4 uL | 24.1 uL |
| Total Volume | 50.0 uL | 50.0 uL | 50.0 uL |
7/17/14
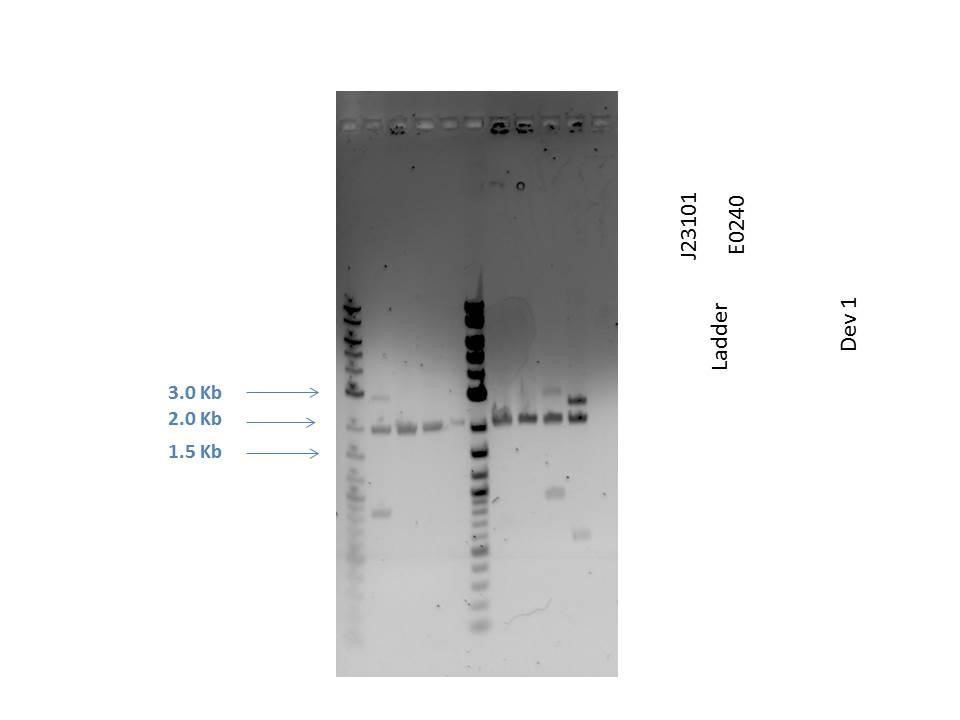
Products from reaction were run on a 1% agarose gel with EtBr. 1.0 uL of loading dye was added to 5.0 uL of each sample as well as 5.0 uL of 2-Log DNA Ladder. Lanes and expected band sizes shown below. There appears to be undigested product present in the E0240 sample.
| Well | Loaded | Expected Sizes (bp) |
|---|---|---|
| 1 | 2-Log DNA Ladder | N/A |
| 2 | D1 (I20260) | 2724, 945 |
| 3 | J23101 | 2261 |
| 4 | E0240 | 2042, 900 |
| 5 | H2O Control | -- |
J23101 and E0240 digest products are used in a ligation reaction to build Device 2. NEBioCalculator (http://nebiocalculator.neb.com ) was used to calculate the suggested ratio of 1:3 vector to insert for DNA sizes. The reaction included a negative control and was done using the following reagents according to NEB ligation protocol:
| Sample | Neg Control | |
|---|---|---|
| T4 Ligase | 1.25 uL | 1.25 uL |
| T4 Ligase Buffer | 2.5 uL | 2.5 uL |
| J23101 Vector DNA (40 ng) | 8.0 uL | 18.0 uL |
| E0240 Insert DNA (50 ng) | 10.0 uL | -- |
| MQ H2O | 3.25 uL | 3.25 uL |
| Total Volume | 25.0 uL | 25.0 uL |
The reaction was allowed to proceed for 15 minutes at room temperature. The resulting product was transformed into DH5alpha competent cells using standard protocol. The plates were left to incubate, but even after several days no growth was observed.
Week 4
7/21/14
Ligation from last week repeated using the same protocol and volumes. However, to improve chances of getting product formation, an overnight ligation will be used. The reaction was placed in a thermocycler and set to 16 °C for 16 hours.
7/22/14
Ligation reaction was heat inactivated at 65°C for 10 minutes. 10 uL of the product was transformed into 40 uL competent cells and plated onto the appropriate antibiotic plate in both full strength and as a 1:10 dilution. The negative control was also transformed and plated for comparison.
Week 5
7/28/14
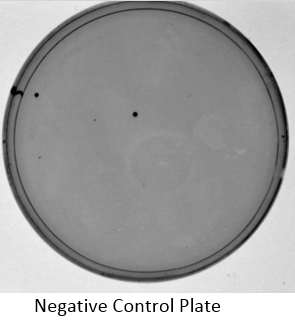
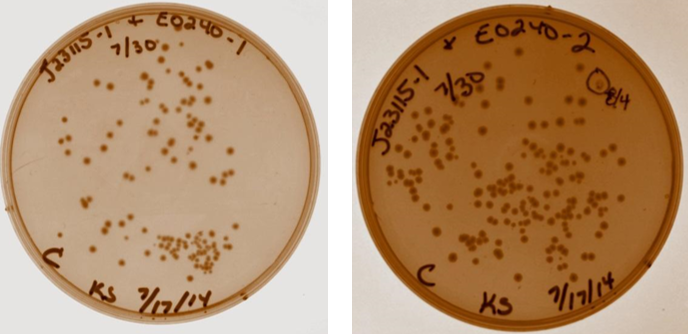
Competent cells were made with Josephina. Overnight cultures prepared from plates including device 2 and parts to build device 3. Six cultures were prepared. Shown below is the device 2 transformation plate (left) and negative control (right).

7/29/14
Miniprep was performed on overnight cultures followed by Nanodrop to assess purity and concentration of samples.
| Sample | ng/ uL | 260/280 | 260/230 |
|---|---|---|---|
| Dev2 #1 | 124.5 | 1.85 | 2.16 |
| Dev2 #2 | 160.5 | 1.91 | 2.29 |
| E0240 #1 | 150.9 | 1.82 | 1.61 |
| E0240 #2 | 91.0 | 1.87 | 2.15 |
| J23115 #1 | 114.5 | 1.83 | 1.97 |
| J23115 #2 | 148.5 | 1.79 | 2.29 |
Restriction Digestion was performed on the products using standard protocol and with the following enzymes:
| D1 | D2 #1 | D2 #2 | E0240 #1 | E0240 #2 | J23115 #1 | J23115 #2 | (-) Control | |
|---|---|---|---|---|---|---|---|---|
| CutSmart Buffer | 5.0 uL | 5.0 uL | 5.0 uL | 5.0 uL | 5.0 uL | 5.0 uL | 5.0 uL | 5.0 uL |
| PstI | 1.0 uL | 1.0 uL | 1.0 uL | 1.0 uL | 1.0 uL | 1.0 uL | 1.0 uL | 1.0 uL |
| XbaI | 1.0 uL | 1.0 uL | 1.0 uL | 1.0 uL | 1.0 uL | 1.0 uL | ||
| SpeI | -- | -- | -- | -- | -- | 1.0 uL | 1.0 uL | -- |
| DNA (500 ng) | 11.4 uL | 4.0 uL | 3.1 uL | 3.3 uL | 5.5 uL | 4.4 uL | 3.4 uL | -- |
| MQ H2O | 31.6 uL | 39.0 uL | 39.9 uL | 39.7 uL | 37.5 uL | 38.6 uL | 39.6 uL | 43.0 uL |
| Total Volume | 50.0 uL | 50.0 uL | 50.0 uL | 50.0 uL | 50.0 uL | 50.0 uL | 50.0 uL | 50.0 uL |
Ligation reaction was performed to build device 3 from the digested products. This time, several samples will be made. For each reaction, a ratio of 1:3 vector to insert will again be used. A strip of numbered PCR tubes were used for the reactions, with each reaction containing the following reagents. All were placed at 16 °C for 16 hours.
| T4 Ligase | 1.0 uL |
|---|---|
| T4 Ligase Buffer | 2.0 uL |
| J23101 Vector DNA (50 ng) | 5.0 uL |
| E0240 Insert DNA (62.5 ng) | 6.25 uL |
| MQ H2O | 5.75 uL |
| Total Volume | 20.0 uL |
| Sample | Tube # |
|---|---|
| J23115-1 & E0240-1 | 3 |
| J23115-2 & E0240-1 | 4 |
| J23115-1 & E0240-2 | 5 |
| J23115-2 & E0240-2 | 6 |
| Neg Control – J23115-2 and H2O | 7 |
| Empty | 8 |
Week 6
7/30/14
A heat inactivation was performed on the ligation products. Next, 10 uL of each of the four device 3 samples and the negative control from tube 7 were transformed into 40 uL DH5u competent cells (made 7/28). 80 uL of each was plated after 1.5 hour incubation.
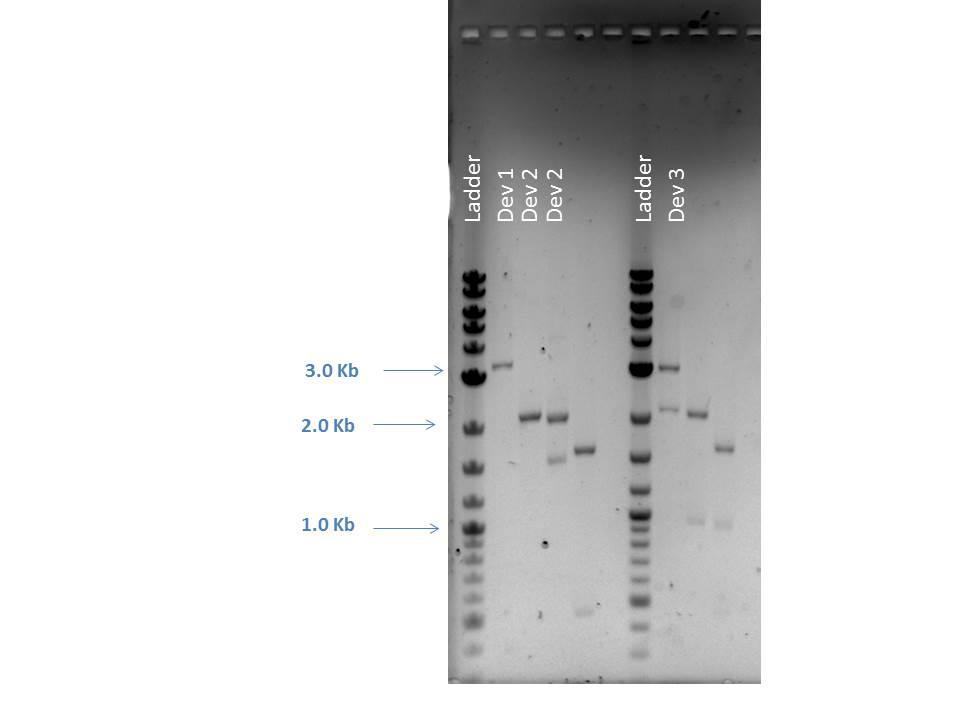
Gel electrophoresis was performed on digested products from 7/29/14. A 1% agarose gel with EtBr was used and loaded with 5 uL of ladder and 5 uL of each sample with 1 uL loading dye as follows:
| Well | Loaded | Expected Sizes (bp) |
|---|---|---|
| 1 | 2-Log DNA Ladder | N/A |
| 2 | D1 | 2724, 945 |
| 3 | D2-1 | 2261 |
| 4 | D2-2 | 2042, 900 |
| 5 | Empty | -- |
| 6 | 2-Log DNA Ladder | N/A |
| 7 | J23115-1 | 2100 |
| 8 | J23115-2 | 2100 |
| 9 | E0240-1 | 2100, 875 |
| 10 | E0240-2 | 2100, 875 |
| 11 | (-) Control | -- |
From these data, the device 3 parts J23115-1, J23115-2, and E0240-1 are the correct size. E0240-2 may be undigested product, but will probably be excluded from further study. Device 1 reflects some undigested product in lane 2. It is unknown why a single band is present for both device 2 samples.
8/1/14
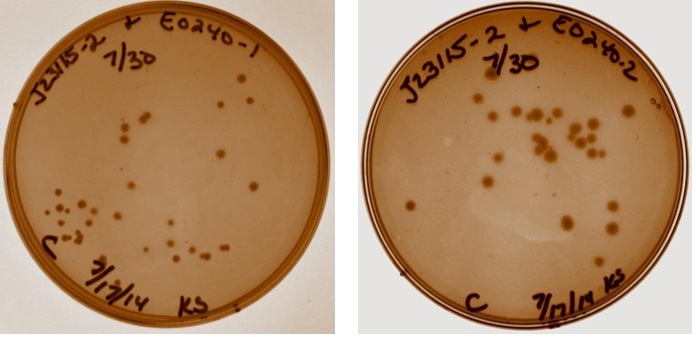
A discussion took place with Sam to discuss strange gel results and lack of visual fluorescence on plates or cultures. It was suggested that I have a positive control with known fluorescence, Sam will provide this. It was also suggested that multiple digests be done on samples to verify size. Plates with ligation products for device 3 removed from incubator. As shown below, all four ligation products have growth on the plates, no growth present on negative control plate (not shown). Device 3 samples used in further studies were taken from plate with J23115-1 & E0240-1.
8/4/14
20 Chloramphenicol and 10 Kan plates were made. BL21_GFP plate obtained from Sam to use as positive control. These cells have Amp resistance and need 0.3% glucose in media. GFP expression will be induced with 0.3 mM IPTG. An overnight culture of 10 mL LB with Amp and glucose was started for the BL21 sample. Overnight cultures of D2-2 and D3 from plate J23115-1 & E0240-2 was also prepared. In order to rule out contamination of any of the parts or other devices into device 1, a streak plate was made on a chloroamp plate (D1 has Kan resistance).
8/5/14
Control plate with device 1 looks good – no growth. Some of the DH5u cells are slow to grow so it will be left for several more days in incubator to be sure. Unfortunately, positive control cells BL21_GFP obtained from Garcea lab did not grow. The plate they were taken from may be too old. An amp plate was prepared and streaked from glycerol stock. Colonies were taken from all four device 3 plate for overnight cultures.
Week 7
8/8/14
Control plate with device 1 shows no growth. This indicates that this product has not been contaminated with any of the parts from device 2 or device 3. BL21_GFP cells from overnight culture were diluted to OD of 0.4 and induced with 0.3 mM IPTG and allowed to regrow for 30 minutes (to OD 0.525). Device 3 overnight culture was also diluted to OD of 0.4 and allowed to regrow for 30 minutes, resulting in 0.494 OD. 100 uL of each sample (with LB as negative control blank) underwent a 1:2 serial dilution and was placed into a 96 well plate. Fluorescent measurements were taken using a Synergy 2 Plate Reader (courtesy of the Cech lab, University of Colorado at Boulder) using the built-in ZsGreen protocol (excitation 485/20, emission reading 528/20), raw data shown below.
| Sample | Full | 50% | 25% | 12.5% | 6.25% |
|---|---|---|---|---|---|
| LB | 265 | 269 | 259 | 267 | 260 |
| Dev 1 | 1078 | 541 | 360 | 288 | 249 |
| BL21 | 780 | 549 | 308 | 212 | 218 |
After subtracting the fluorescence readings by LB alone, both samples demonstrate clear values that decline with decreasing concentrations as expected. The purpose of using the BL21 cell line was to compare cells with known fluorescence against the devices prepared for this study. These results indicate that these cells are producing fluorescence and thus are thought to contain the GFP gene and promoter. With these results, fluorescent measurements can now be taken of all three devices in biological triplicate. After discussing these data with Sam, it was also suggested that cells lacking the GFP gene (such as one of the parts for the promoter for device 2 or 3) be used for a negative control in further studies. These cells would be used to account for fluorescence from the DH5u cells and the pSB1C3 backbone.
8/12/14
Overnight cultures prepared of device 1, 2, and 3. BL21 culture induced with 0.3mM IPTG.
8/13/14
Minipreps and nanodrops prepared from overnight cultures with data shown below. Device 1 and device 2 samples demonstrate very low concentrations. These samples were then used for restriction digestion with multiple enzymes followed by agarose gel electrophoresis (1% agarose with EtBr as previously described).
| Sample | ng/ uL | 260/280 | 260/230 |
|---|---|---|---|
| Dev 1 | 9.6 | 1.90 | 1.40 |
| Dev 2 | 35.7 | 1.87 | 2.29 |
| Dev 3 | 230.8 | 1.87 | 2.37 |
Restriction Digestion
| Sample | FD Buffer | NcoI | HaeII | NotI | DNA (200 ng) | MQ H2O | Total Volume | Bands Expected (Bp) |
|---|---|---|---|---|---|---|---|---|
| D1-Double | 2.0 uL | 1.0 uL | -- | -- | 20.8 uL | 1.16 uL | 25.0 uL | 3296, 373 |
| D2-1 Single | 2.0 uL | -- | 1.0 uL | -- | 5.6 uL | 16.4 uL | 25.0 uL | 2981 |
| D2-1 Double | 2.0 uL | -- | -- | 1.0 uL | 5.6 uL | 16.4 uL | 25.0 uL | 2046, 935 |
| D2-1 Triple | 2.0 uL | -- | 1.0 uL | 1.0 uL | 5.6 uL | 15.4 uL | 25.0 uL | 1595, 935, 451 |
| D3-1 Single | 2.0 uL | -- | 1.0 uL | -- | 0.86 uL | 21.14 uL | 25.0 uL | 2981 |
| D3-1 Double | 2.0 uL | -- | -- | 1.0 uL | 0.86 uL | 21.14 uL | 25.0 uL | 2046, 935 |
| D3-1 Triple | 2.0 uL | -- | 1.0 uL | 1.0 uL | 0.86 uL | 20.14 uL | 25.0 uL | 1595, 935, 451 |
| Well | Loaded | Expected Sizes (bp) |
|---|---|---|
| 1 | 2-Log DNA Ladder | N/A |
| 2 | D1 Double | 3296, 373 |
| 3 | D2 Single | 2981 |
| 4 | D2 Double | 2046, 935 |
| 5 | D2 Triple | 1595, 935, 451 |
| 6 | Empty | N/A |
| 7 | 2-Log DNA Ladder | N/A |
| 8 | D3 Single | 2981 |
| 9 | D3 Double | 2046, 935 |
| 10 | D3 Triple | 1595, 935, 451 |
| 11 | (-) Control | -- |
As seen from the image above, smaller bands ran off the bottom of the gel and could not be readily visualized. However, the approximate sizes of the bands are as expected for each sample. Another 96 well plate was loaded using the sample protocol as previously described. Samples were measured after dilution and regrowth to OD of 0.5. J23101 and BL21 samples were used as controls, raw data shown below.
| Sample | Full | 50% | 25% | 12.5% | 6.25% |
|---|---|---|---|---|---|
| LB | 706 | 268 | 188 | 137 | 123 |
| J23101 | 935 | 294 | 204 | 145 | 125 |
| BL21 | 1277 | 349 | 226 | 159 | 130 |
| Dev 1 | 1623 | 438 | 258 | 182 | 145 |
| Dev 2 | 920 | 303 | 193 | 134 | 123 |
| Dev 3 | 1147 | 367 | 219 | 157 | 126 |
As with the previous test, all 3 devices demonstrate fluorescence in excess of the negative control sample. Values at full and below 12.5% concentration may be beyond the optimal range for the instrument to detect. The dilution amounts should be adjusted for the full test based on these data.
Week 8
8/18/14
Made LB agar plates with appropriate antibiotics. 100 uL of each sample was plated and placed in incubator for overnight growth. These will be used to pull individual colonies for the biological triplicates needed in the fluorescent measurements to be performed. A repeat miniprep was performed on the device 1 sample from 8/13/14 in an attempt to obtain a higher concentration.
8/19/14
Plates made yesterday grew too well and single colonies could not be isolated. New streak plates were created for each sample (plates were not imaged).
8/20/14
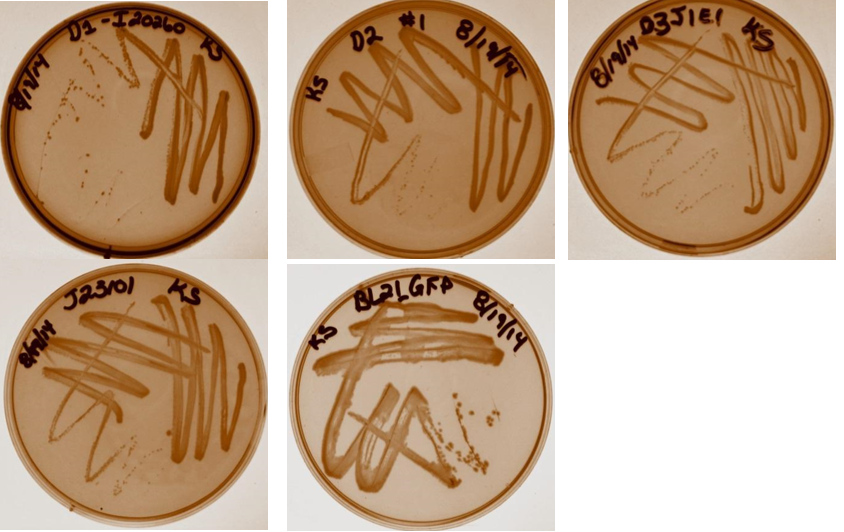
Three colonies were taken from each streak plate to be used as biological triplicates in the study. Plates are shown below (Top row from left; Dev 1, Dev 2, Dev 3. Bottom row: J23101 negative control, BL21 positive control).
Week 9
8/21/14
Samples were monitored throughout the day and diluted as necessary to keep them in log phase. Since samples did not grow at the same rate, some difficulties were apparent when trying to get each sample to the same OD at the same time as the other samples. The volume per well will be increased to 150 uL and the concentrations adjusted for the measurement.
8/22/14
Fluorescence measurements were taken of device 1, 2 and 3 biological triplicate samples as previously described. Samples were all in log phage growth with OD of approximately 0.5 as shown below. Due to the number of samples, two separate 96 well plates were prepared using the same controls. Raw data is shown below.
| Sample | Final OD |
|---|---|
| J23101 | 0.508 |
| Dev 1-1 | 0.515 |
| Dev 1-2 | 0.514 |
| Dev 1-3 | 0.509 |
| Dev 2-1 | 0.490 |
| Dev 2-2 | 0.508 |
| Dev 2-3 | 0.526 |
| Dev 3-1 | 0.512 |
| Dev 3-2 | 0.501 |
| Dev 3-3 | 0.520 |
| 100 | 0.67 | 0.44 | 0.3 | 0.2 | 13.4 | 0.09 | |
|---|---|---|---|---|---|---|---|
| LB Blank | 778 | 785 | 774 | 766 | 780 | 775 | 788 |
| Neg Control (J23101) | 1068 | 903 | 854 | 821 | 807 | 794 | 788 |
| Dev 3 #1 | 1142 | 995 | 895 | 831 | 804 | 809 | 798 |
| Dev 3 #2 | 1125 | 940 | 852 | 823 | 796 | 805 | 788 |
| Dev 3 #3 | 1035 | 951 | 888 | 837 | 824 | 812 | 797 |
| Dev 2 #1 | 992 | 925 | 849 | 812 | 805 | 779 | 779 |
| Dev 2 #2 | 1083 | 924 | 820 | 813 | 791 | 776 | 761 |
| Dev 2 #3 | 1047 | 879 | 824 | 801 | 776 | 782 | 772 |
Plate #1 raw data with sample concentrations shown as decimals.
| 100 | 0.67 | 0.44 | 0.3 | 0.2 | 13.4 | 0.09 | |
|---|---|---|---|---|---|---|---|
| LB Blank | 816 | 825 | 849 | 816 | 844 | 827 | 825 |
| Neg Control (J23101) | 982 | 925 | 886 | 850 | 845 | 833 | 807 |
| Dev 1 #1 | 1728 | 1450 | 1153 | 1024 | 899 | 881 | 838 |
| Dev 1 #2 | 1830 | 1413 | 1142 | 1010 | 921 | 841 | 861 |
| Dev 1 #3 | 1790 | 1446 | 1155 | 975 | 911 | 861 | 854 |
Plate #2 raw data with sample concentrations shown as decimals.
Week 10
9/4/14
Minipreps done on triplicate samples for J, D1, D2, & D3
9/5/14
Nanodrop done on mini prepped samples (results shown below) followed by restriction digestion using NcoI. The products were run on a 1% agarose gel with EtBr as previously described. This was done to ensure that all of the samples used in the fluorescence measurements are of the correct size. Although the gel is slightly distorted, the size of the bands correspond with the expected products (image not shown).
| Sample | ng/ uL | 260/280 | 260/230 |
|---|---|---|---|
| Dev 1 #1 | 13.7 | 1.99 | 2.24 |
| Dev 1 #2 | 12.0 | 1.94 | 2.20 |
| Dev 1 #3 | 14.1 | 1.86 | 1.56 |
| Dev 2-1 #1 | 79.0 | 1.87 | 2.24 |
| Dev 2-1 #2 | 68.0 | 1.83 | 2.14 |
| Dev 2-1 #3 | 88.1 | 1.84 | 2.24 |
| Dev 3 #1 | 577.3 | 1.85 | 2.37 |
| Dev 3 #2 | 272.8 | 1.87 | 2.33 |
| Dev 3 #3 | 840.2 | 1.86 | 2.35 |
| J23115 #1 | 254.3 | 1.85 | 1.70 |
| J23115 #2 | 557.1 | 1.82 | 2.26 |
| J23115 #3 | 784.5 | 1.84 | 2.28 |
Restriction Digestion
| FD Buffer | NcoI | DNA (250 ng) | MQ H2O | Total Volume | Bands Expected (Bp) | |
|---|---|---|---|---|---|---|
| J1 | 2.0 uL | 1.0 uL | 1.0 uL | 21.0 uL | 25.0 uL | 1335, 770 |
| J2 | 2.0 uL | 1.0 uL | 0.9 uL† | 21.1 uL | 25.0 uL | 1335, 770 |
| J3 | 2.0 uL | 1.0 uL | 0.3 uL† (0.95 of 1:3) | 21.1 uL | 25.0 uL | 1335, 770 |
| D2-1* | 2.0 uL | 1.0 uL | 2.5 uL | 14.5 uL | 20.0 uL | 1991, 990 |
| D2-2* | 2.0 uL | 1.0 uL | 2.9 uL | 14.1 uL | 20.0 uL | 1991, 990 |
| D2-3* | 2.0 uL | 1.0 uL | 2.3 uL | 14.7 uL | 20.0 uL | 1991, 990 |
| D3-1 | 2.0 uL | 1.0 uL | 0.45 uL† (0.9 of 1:2) | 21.1 uL | 25.0 uL | 1991, 990 |
| D3-2 | 2.0 uL | 1.0 uL | 0.92 uL | 21.1 uL | 25.0 uL | 1991, 990 |
| D3-3 | 2.0 uL | 1.0 uL | 0.3 (0.9 of 1:3) uL† | 21.1 uL | 25.0 uL | 1991, 990 |
- Digest done with 200 ng and 20 uL volume 2 hours prior to the other reactions
†Volume after DNA was diluted
| Lane # | Sample | Bands Expected (Bp) |
|---|---|---|
| 1 | 2-Log DNA Ladder | N/A |
| 2 | J1 (Hole in Gel) | 1335, 770 |
| 3 | J1 | 1335, 770 |
| 4 | J2 | 1335, 770 |
| 5 | J3 | 1335, 770 |
| 6 | 2-Log DNA Ladder | N/A |
| 7 | D2-1* | 1991, 990 |
| 8 | D2-2* | 1991, 990 |
| 9 | D2-3* | 1991, 990 |
| 10 | 2-Log DNA Ladder | N/A |
| 11 | D3-1 | 1991, 990 |
| 12 | D3-2 | 1991, 990 |
| 13 | D3-3 | 1991, 990 |
| 14 | 2-Log DNA Ladder | N/A |
| 15 | H2O Control | N/A |
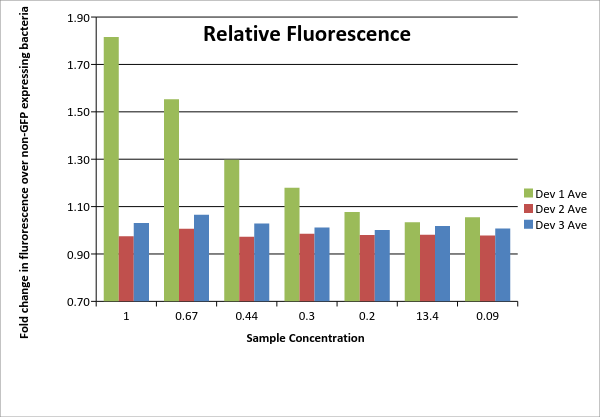
DATA ANALYSIS Analysis of the fluorescence data measurements obtained is shown below.
| 1.00 | 0.67 | 0.44 | 0.3 | 0.2 | 13.4 | 0.09 | |
|---|---|---|---|---|---|---|---|
| Dev 1 #1 Actual | 1728 | 1450 | 1153 | 1024 | 899 | 881 | 838 |
| Calculated | 746 | 525 | 267 | 174 | 54 | 48 | 31 |
| Dev 1 #2 Actual | 1830 | 1413 | 1142 | 1010 | 921 | 841 | 861 |
| Calculated | 848 | 488 | 256 | 160 | 76 | 8 | 54 |
| Dev 1 #3 Actual | 1790 | 1446 | 1155 | 975 | 911 | 861 | 854 |
| Calculated | 808 | 521 | 269 | 125 | 66 | 28 | 47 |
| Dev 2 #1 Actual | 992 | 925 | 849 | 812 | 805 | 779 | 779 |
| Calculated | -76 | 22 | -5 | -9 | -2 | -15 | -9 |
| Dev 2 #2 Actual | 1083 | 924 | 820 | 813 | 791 | 776 | 761 |
| Calculated | 15 | 21 | -34 | -8 | -16 | -18 | -27 |
| Dev 2 #3 Actual | 1047 | 879 | 824 | 801 | 776 | 782 | 772 |
| Calculated | -21 | -24 | -30 | -20 | -31 | -12 | -16 |
| Dev 3 #1 Actual | 1142 | 995 | 895 | 831 | 804 | 809 | 798 |
| Calculated | 74 | 92 | 41 | 10 | -3 | 15 | 10 |
| Dev 3 #2 Actual | 1125 | 940 | 852 | 823 | 796 | 805 | 788 |
| Calculated | 57 | 37 | -2 | 2 | -11 | 11 | 0 |
| Dev 3 #3 Actual | 1035 | 951 | 888 | 837 | 824 | 812 | 797 |
| Calculated | -33 | 48 | 34 | 16 | 17 | 18 | 9 |
Table 1: Fluorescence data. For each of the three devices, 3 biological replicates were measured (labeled #1, #2, #3 for each device). Data shown includes actual measurements and derived quantities obtained by subtracting fluorescence measured from non-GFP expressing E. coli of the same strain on the same plate. Promoter J23115 for device #3 was used as distributed. In addition, each sample underwent a serial dilution (concentrations listed as fractions across top of table).
| 100 | 0.67 | 0.44 | 0.3 | 0.2 | 13.4 | 0.09 | |
|---|---|---|---|---|---|---|---|
| Dev 1 Ave | 1.82 | 1.55 | 1.30 | 1.18 | 1.08 | 1.03 | 1.05 |
| Dev 1 Std. Dev | 0.05 | 0.02 | 0.01 | 0.03 | 0.01 | 0.02 | 0.01 |
| Dev 2 Ave | 0.97 | 1.01 | 0.97 | 0.98 | 0.98 | 0.98 | 0.98 |
| Dev 2 Std. Dev | 0.04 | 0.03 | 0.02 | 0.01 | 0.02 | 0.00 | 0.01 |
| Dev 3 Ave | 1.03 | 1.07 | 1.03 | 1.01 | 1.00 | 1.02 | 1.01 |
| Dev 3 Std. Dev | 0.05 | 0.03 | 0.03 | 0.01 | 0.02 | 0.00 | 0.01 |
| Total: Dev 1 | 1.23 | ||||||
| Total: Dev 2 | 0.99 | ||||||
| Total: Dev 3 | 1.02 |
Table 2: Average device fluorescence. For each of the three devices, the average and standard sample deviation are given for the triplicates at each concentration. Data is given as fold change over non-GFP expressing E. coli of same DH5u strain. Total data on lower portion of table is an overall average of each device calculated using the averages for each device at all concentrations. No samples were excluded.
 "
"
